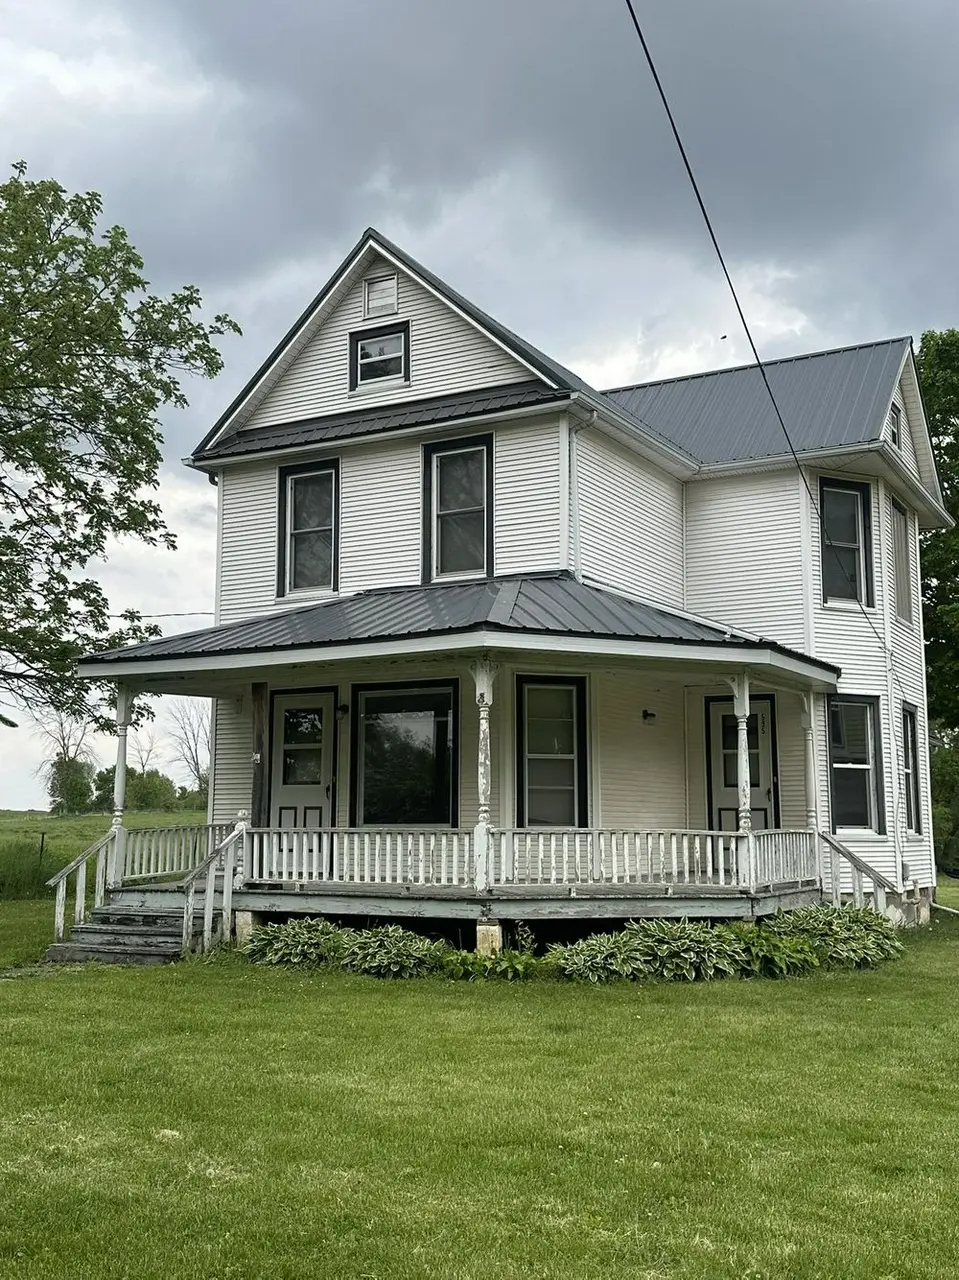
595 N Henderson Rd · Freeport, IL
Flood risk 1/10 · Minimal
- FEMA flood zone
- X (unshaded)
- Chance of flooding over 30 yrs
- 0.0%
- Est. flood insurance / yr
- $473 – $860
Fire risk 3/10 · Minor
- Est. fire insurance / yr
- $804 – $1,492
Heat risk 2/10 · Minimal
- Hot days now (above 101°F)
- 7 days/yr
- Hot days in 30 yrs
- 15 days/yr
Wind risk 2/10 · Minimal
- Chance of severe wind over 30 yrs
- —
Air-quality risk 2/10 · Minimal
- Unhealthy air days now
- 1 days/yr
- Unhealthy air days in 30 yrs
- 2 days/yr
Risk factors via First Street. Map © Google.
Why this score? — see what drove the B- grade
The composite is a weighted blend of 9 inputs, each scored 0–100. Each bar is that input's sub-score; the figure is the points it added to the 100-point composite (weight × sub-score).
- Cash flow +25.9/30.0
- ARV discount +15.0/15.0
- DSCR +8.7/10.0
- 1% rule +6.8/10.0
- Livability +3.6/5.0
- Rent growth +2.5/5.0
- Condition / age +2.5/5.0
- Schools +1.0/10.0
- Appreciation +0.0/10.0
$120,000
🖨 Deal sheet 📄 Offer letter ✓ Due diligence
Listing remarks
Beautiful 2 story country home on a 1.25 acre lot! 3 bedroom (2 upstairs, 1 downstairs), 1 full bath upstairs (newly updated), 1/2 bath downstairs. 1350 total square feet. New electrical/panel, central air, heating is natural gas, good well water (tested within last year), septic, newer water heater & water softener, most windows are new, steel roof, vinyl siding, pex & copper water lines. Newly refinished living room hardwood floor. 1 stall garage with cement floor, also has electric & steel roof. Quiet neighborhood. Long back yard, mini-orchard in back (apples, pear, plums). Plenty of space for a garden, pool, outdoor volleyball, bonfires, etc.
Key facts
- Good well water
- Natural gas heating
- 1.25 acre lot
Tags
Property features AI
Exterior
- Home design: House
- Construction: Living area approximately 1,350
- Exterior features: Property sits on a 1.25-acre lot
Neighborhood map
What this means for you Summary
Snapshot
- This is a 3-bed/1.5-bath single-family listed at $120k.
Deal economics
- At list price, monthly cash flow is $297 ($4k/yr) — positive.
- The deal already cash-flows at list — no discount required.
- Meets the 1% rule at list price ($1k rent vs $120k).
- Cap rate 9.3% vs local median 5.8% in Freeport — top-decile yield for the area; either an underpriced asset or a hidden risk that comps aren't pricing in. Stress-test before assuming the spread holds.
Location & tenants
- Location reads 72/100 on livability (#302 in IL) — a middle-class / working-renter tenant base. Strengths: cost of living A+, health & safety A+, housing A-; Watch: schools F, commute F, employment F.
- Freeport SD 145 (town): math 11% / reading 12% proficiency, ranked #565 of 620 in IL (top 91%) — low school quality limits family demand, transient renter base, plan for 1-2y turnover; 65% free/reduced lunch — lower-income household profile, screen leases tightly.
- Market conditions: 197 active listings in the ZIP; 4 comparable units currently listed for rent nearby; rentals lingering (median 44d on market — plan ~5-8 weeks vacancy on turnover, expect pricing pressure); 75% of comp listings sitting > 30 days — soft ceiling on asking rent; 7 units permitted in Stephenson County in 2024 (0 in 5+ unit buildings).
Forward outlook
- Local home prices are declining (-3.0%/yr); year-one equity from $830 of loan paydown is wiped out by about $4k of value loss. Plan a longer hold.
- Stephenson County population projected at -29% by 2050 — secular population decline; favor cash flow + early exit over multi-decade hold.
Negotiation context
- Only 14 days on market — expect competitive offers; lowballing is unlikely to land.
- Current owner paid $61k; list at $120k implies a 98% gain — meaningful room to come down on a strong offer.
Risks & watch-outs
- Watch-outs: built in 1900 — expect roof / HVAC / electrical / plumbing capex.
Questions for the listing agent
- Built in 1900 — when were the roof, HVAC, electrical panel, plumbing, and water heater last replaced?
- Is there a deadline driving the sale (1031 exchange, divorce, estate, relocation)? That informs how much negotiation room exists.
- Schools are F-rated, which usually means shorter tenancies and higher turnover. Who's the typical renter profile here, and what's been the actual vacancy rate?
- What's the average days-on-market for RENTAL listings here right now (not sales)? A rising rental-DOM trend means longer vacancies and softer asking-rent achievability than the comps imply.
- What's the recent tenant-quality profile in this submarket — average credit score on applications, eviction rate, late-payment / NSF rate, and stable-employment percentage? A property-management company in the area should have these aggregated.
- How much new for-sale + rental construction is in the pipeline within 1–3 miles? Heavy new supply typically softens prices + rents 12–24 months out; constrained supply supports both.
Investment metrics
- 1% rule
- 1.18% ✓
- Cap rate
- 9.26%
- Cash-on-cash
- 10.60%
- DSCR
- 1.47
- GRM
- 7.1
CMA / ARV
- ARV (on-the-fly)
- $180,900
- Comps found
- 2
Show comp detail 2 sales within ~0.75 mi
| Address | Dist | Beds/Ba | Sqft | Sold | Price | $/sf | Match |
|---|---|---|---|---|---|---|---|
| 593 N Henderson Rd | 0.01mi | 3/1.0 | 1,526 (+13%) | 10mo | $43,959 | $29 | 68 |
| 1165 N Henderson Rd | 0.43mi | 3/1.5 | 1,488 (+10%) | 1mo | $200,000 | $134 | 62 |
Match score weights: distance 35% · size 25% · config 20% · recency 20%. Top-matched comps best support the ARV.
Projected returns pro-forma
-3.0% appreciation · 3.0% rent growth · sell at horizon
- IRR
- -0.4%
- Equity multiple
- 0.98×
- Total profit
- $-531
- Equity at exit
- $17,892
- IRR
- 9.3%
- Equity multiple
- 1.71×
- Total profit
- $23,938
- Equity at exit
- $10,375
Cash invested: $33,600 (down + closing). Projections, not guarantees.
Landlord ↔ Tenant lean methodology
- Overall (STATE)
- 43 Moderately Tenant-Leaning
- State Illinois
- 43 Moderately Tenant-Leaning · D+7
- County
- — inherits STATE
- City
- — inherits STATE
ZIP-level market 61032
- Home prices YoY
- -19.5%
- Active inventory
- 197
- Price-to-rent
- 7.1×
Monthly cashflow live
- Estimated rent
- $1,415 medium interval (Pro) →
- Mortgage (P&I)
- −$629
- Tax from tax record
- −$142 /mo · $1,703/yr
- Insurance
- −$50
- HOA
- −$0
- Vacancy / Maint / Mgmt
- −$297
- Net cashflow
- $297
Break-even live
UW: 25.0% down · 7.5% · 30yr · 1.5% tax · 5.0% vac · 8.0% maint · 8.0% mgmt
Financing live
Cash to close
- Down payment
- $30,000
- Closing costs
- $3,600
- Reserves months
- —
- Total cash needed
- —
Loan-product check · same deal, 3 products live
Conventional
25% down · 7.5% · 30yr
- Down + closing
- —
- Monthly P&I
- —
- Monthly cashflow
- —
- DSCR
- —
- Eligible?
- —
Personal DTI + credit; lowest rate.
DSCR
20% down · 8.5% · 30yr
- Down + closing
- —
- Monthly P&I
- —
- Monthly cashflow
- —
- DSCR
- —
- Eligible?
- —
No personal income docs; deal must DSCR.
Hard money
10% down · 12.0% · 12mo
- Down + closing
- —
- Monthly P&I
- —
- Monthly cashflow
- —
- DSCR
- —
- Eligible?
- —
Short-term bridge; refi at stabilization.
Rent comps 4 comps
| Address | Beds | Baths | Sqft | Rent | $/sqft | DOM | Units | Dist |
|---|---|---|---|---|---|---|---|---|
| 435 N Apple Ave Freeport, IL | 4.0 | 2.0 | 1500 | $1,450 | $0.97 | 43d | 1 | 1.11mi |
| 320 W Clark St Freeport, IL | 4.0 | 1.0 | 1509 | $1,395 | $0.92 | 43d | 1 | 1.13mi |
| 810 E Shawnee St Freeport, IL | 2.0 | 1.0 | 962 | $1,495 | $1.55 | 21d | 1 | 1.42mi |
| 816 S James Ave Freeport, IL | 3.0 | 1.0 | 1152 | $1,325 | $1.15 | 43d | 1 | 1.46mi |
Listing history 11 events
-
2026-06-18days on market $120,000 Active 14 DOM
-
2026-06-17days on market $120,000 Active 13 DOM
-
2026-06-16days on market $120,000 Active 12 DOM
-
2026-06-15days on market $120,000 Active 11 DOM
-
2026-06-13days on market $120,000 Active 9 DOM
-
2026-06-12days on market $120,000 Active 8 DOM
-
2026-06-09days on market $120,000 Active 5 DOM
-
2026-06-08days on market $120,000 Active 4 DOM
-
2026-06-07days on market $120,000 Active 3 DOM
-
2026-06-07remarks 661-char remark
-
2026-06-07$120,000 Active 2 DOM
ⓘ Source: listings_history table (triggers on properties + properties_extension) + one-shot
backfill from property_details.listing_events for pre-trigger history.
Tax reassessment forecast IL · Partial reset (capped growth)
- Current annual tax
- $1,703 · $142/mo
- Projected year-2 tax
- $2,214 · $184/mo
- Expected delta
- +$510/yr (+$43/mo · 30.0%)
ⓘ Screening estimate from a state-policy table — verify with the county assessor before closing.
Climate risk First Street
- Flood 1/10 Low FEMA zone X (unshaded) · 0% chance over 30 yrs
- Wildfire 3/10 Moderate
- Heat 2/10 Low 7 d/yr ≥101°F today · 15 d/yr by 30 yrs out
- Wind 2/10 Low
- Air quality 2/10 Low 1 unhealthy d/yr today · 2 by 30 yrs out
Nearby sold comps map
Loading sold comps map…
Walkable amenities ~0.75 mi
Loading nearby amenities…
Taxation est. · year 1
- Rental income
- $16,981
- − Mortgage interest
- −$6,722
- − Property taxes
- −$1,703
- − Insurance
- −$600
- − Repairs & maintenance
- −$1,358
- − Management
- −$1,358
- − Depreciation
- −$3,491
- Taxable income
- $1,748
- Est. tax owed @ 24.0%
- −$420
- After-tax cash flow
- $3,141/yr
For passive investors: Depreciation is non-cash, so a rental often shows a tax loss while cash-flowing — sheltering income. Rental losses are passive: they offset passive income freely, and up to $25,000/yr can offset ordinary (W-2) income if you actively participate and your MAGI is under $100k (phasing out to $0 by $150k); unused losses carry forward. On sale, claimed depreciation is recaptured at up to 25%, and gains may owe capital-gains tax (a 1031 exchange can defer both). Figures are a year-1 estimate at your 24.0% rate — not tax advice; consult a CPA.
Schools (NCES district)
- District
- Freeport SD 145
- NCES district ID
- 1715900
- Math proficiency
- 11% ▼ -3.00%
- Reading proficiency
- 12% ▼ -5.00%
- Median HH income
- $39,803
- Composite
- 9.89/100
- National rank
- #9821
- State rank
- #565 of 620 in IL
Livability — Freeport
- Score
- 72/100
- State rank
- #302
- US rank
- #5927
Category grades
Schools grade is shown separately in the Schools card above.
Census & demographics
- Population (ZIP)
- 29,072
Population outlook (Stephenson County) Hauer SSP2
- Today (2025)
- 41,802 people
- By 2030
- 39,487 · -5.5%
- By 2040
- 34,534 · -17.4%
- By 2050
- 29,693 · -29.0%
- By 2075
- 21,196 · -49.3%
- By 2100
- 14,596 · -65.1%
Race, ethnicity, and origin ACS 2023
- Neighborhood character
- Predominantly White (73%)
- Race & ethnicity
- White 73% Black 12% Two or more races 10% Hispanic / Latino 6% Asian 1%
- Hispanic origin (detail)
- Mexican 4% Puerto Rican 1%
- Common ancestry
- Iranian 3% Romanian 2% Lithuanian 2%
- Foreign-born
- 3% · Canada
- Languages at home
- 96% English-only · Spanish 3% Other Indo-European 1%
Political lean MEDSL · Stephenson
- 2024 margin
- R (+19.4) · D 39.5% · R 58.9% · Other 1.6%
- 2008→2024 swing
- -26.1pp toward R · 2008: 6.7pp · 2024: -19.4pp
- All cycles
- 2024: R+19.4 2020: R+15.7 2016: R+17.0 2012: R+4.6 2008: D+6.7
Not yet ingested
- Civics
- —
Market trends
- HPI YoY
- ▼ -39.75%
- Current HPI
- 163.677
- Rent YoY
- —
- Metro
- —
- State GDP YoY
- ▲ 1.59%
- F500 in state
- 60
Industry mix (Fortune 500 HQ in IL)
| Industry | F500 HQs | Revenue |
|---|---|---|
| Insurance | 4 | $201B |
|
||
| Consumer Goods | 4 | $87B |
|
||
| Industrial Machinery | 3 | $64B |
|
||
| Healthcare | 2 | $55B |
|
||
| Retail / Pharmacy | 1 | $148B |
|
||
| Agriculture / Food | 1 | $86B |
|
||
Price history
+97.9% since first listed2 events — show timeline
- 2026-06-04 Listed $120,000 ForSaleByOwner.com
- 2011-11-23 Sold (Public Records) $60,630 Public Records
Property tax history
+4.0%/yrLatest (2024): $1,703 · +12.7% YoY. Source: county tax records.
Cash-flow waterfall
monthlySold comps — $/sqft
last 12 mo · ≤1 miLoading sold comps…