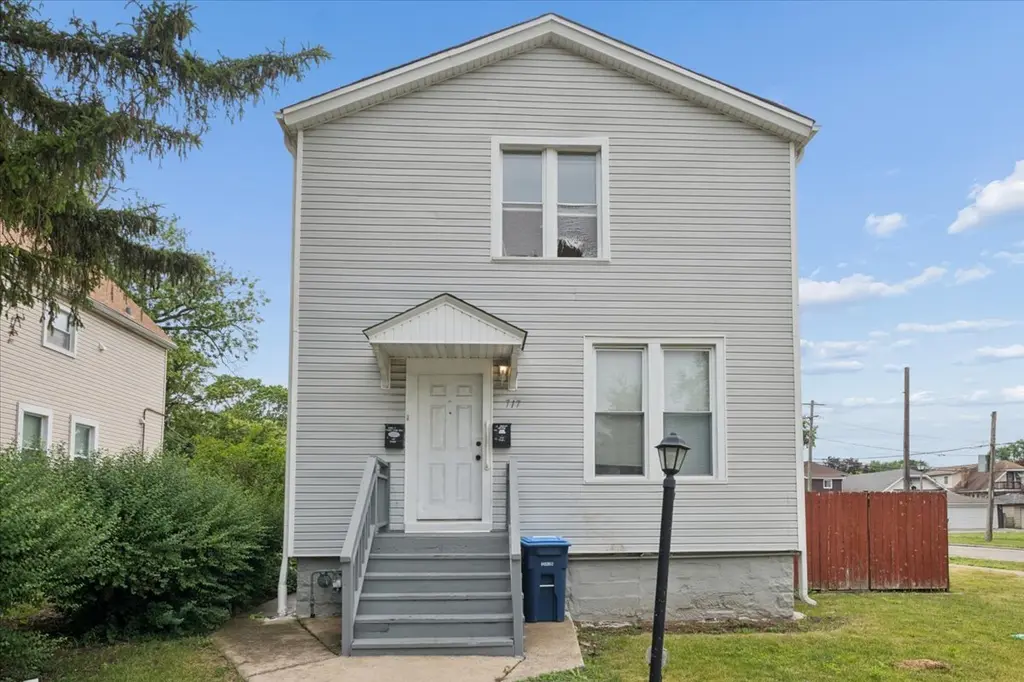
717 S 9th Ave · Maywood, IL
Flood risk 6/10 · Moderate
- FEMA flood zone
- X (unshaded)
- Chance of flooding over 30 yrs
- 0.74%
- Est. flood insurance / yr
- $473 – $860
Fire risk 1/10 · Minimal
- Est. fire insurance / yr
- $804 – $1,492
Heat risk 3/10 · Minor
- Hot days now (above 100°F)
- 7 days/yr
- Hot days in 30 yrs
- 14 days/yr
Wind risk 2/10 · Minimal
- Chance of severe wind over 30 yrs
- 1.0%
Air-quality risk 5/10 · Moderate
- Unhealthy air days now
- 6 days/yr
- Unhealthy air days in 30 yrs
- 8 days/yr
Risk factors via First Street. Map © Google.
Why this score? — see what drove the C- grade
The composite is a weighted blend of 9 inputs, each scored 0–100. Each bar is that input's sub-score; the figure is the points it added to the 100-point composite (weight × sub-score).
- Cash flow +15.6/30.0
- ARV discount +15.0/15.0
- 1% rule +6.4/10.0
- DSCR +4.8/10.0
- Livability +3.9/5.0
- Rent growth +2.5/5.0
- Condition / age +2.5/5.0
- Schools +1.9/10.0
- Appreciation +0.0/10.0
$195,000
🖨 Deal sheet (PDF) 📄 Offer letter ✓ Due diligence
Key facts
- Large corner lot
- 7,840 sq ft lot
- 2 garage spots
Tags
Property features AI
Finance
- Other: Fee simple ownership; Not currently leased; Possession at closing
- HOA & community: No master association fees required
Exterior
- Parking: Detached garage (owned) with 2 garage spaces, 2 parking spaces total
- Utilities: Water source: Lake Michigan; Public sewer
- Home design: Detached single-family home; Two-story
- Construction: Vinyl siding; Property over 100 years old; Built before 1978
- Exterior features: Lot less than 0.25 acre; Lot dimensions: 7744
Interior
- Kitchen: Second-level kitchenette plus main-level kitchen
- Bedrooms: 4 bedrooms (Master, plus three additional bedrooms on main and second levels)
- Bathrooms: 2 full bathrooms
- Heating & cooling: Natural gas heating
- Interior features: Unfinished partial basement; 8 total rooms
- Laundry & utility: Dedicated laundry room
Neighborhood map
What this means for you Summary
Snapshot
- This is a 3-bed/2.0-bath single-family listed at $195k.
Deal economics
- At list price, monthly cash flow is $82 ($981/yr) — positive.
- The deal already cash-flows at list — no discount required.
- Meets the 1% rule at list price ($2k rent vs $195k).
- Cap rate 6.8% vs local median 4.5% in Maywood — top-decile yield for the area; either an underpriced asset or a hidden risk that comps aren't pricing in. Stress-test before assuming the spread holds.
Location & tenants
- Location reads 78/100 on livability (#146 in IL, #2,694 nationally) — a middle-class / working-renter tenant base. Strengths: commute A+, cost of living A+, housing A+; Watch: health & safety C-, crime D+, amenities D-.
- Maywood-Melrose Park-Broadview 89 (suburban): math 14% / reading 21% proficiency, ranked #738 of 919 in IL (top 80%) — low school quality limits family demand, transient renter base, plan for 1-2y turnover; 74% free/reduced lunch — lower-income household profile, screen leases tightly.
- Zoned schools: Washington Dual Language Academy (363 students, 0% FRL); Proviso West High School (math 6% / reading 11%, grade F, #584 of 693 statewide, top 85%, 1,868 students, 0% FRL) — zoned schools average 0% FRL vs 74% district-wide (74 pts lower); this property's tenant base skews higher-income than the district average.
- Market conditions: 72 active listings in the ZIP; 12 comparable units currently listed for rent nearby; rentals leasing fast (median 3d on market — plan ~1-2 weeks tenant-placement turnaround); 6,272 units permitted in Cook County in 2024 (4,658 in 5+ unit buildings).
- This rent runs 39% of the median local income ($69k/yr) — at the standard rent-burdened threshold; future hikes will face affordability resistance.
Forward outlook
- Local home prices are declining (-3.0%/yr); year-one equity from $1k of loan paydown is wiped out by about $6k of value loss. Plan a longer hold.
Negotiation context
- Only 9 days on market — expect competitive offers; lowballing is unlikely to land.
Risks & watch-outs
- Watch-outs: property tax is 3.5% of price; built in 1913 — expect roof / HVAC / electrical / plumbing capex.
- Climate carrying-cost: major flood risk — expect insurance premiums to compound above CPI over the hold.
Questions for the listing agent
- Built in 1913 — when were the roof, HVAC, electrical panel, plumbing, and water heater last replaced?
- Property tax is high relative to price — has the assessment been appealed recently, and will the sale trigger a re-assessment?
- Is there a deadline driving the sale (1031 exchange, divorce, estate, relocation)? That informs how much negotiation room exists.
- Schools are F-rated, which usually means shorter tenancies and higher turnover. Who's the typical renter profile here, and what's been the actual vacancy rate?
- Crime grade is D in this area — have there been break-ins, vandalism, or insurance claims at this property in the last 3 years? What carrier currently insures it and at what premium?
- What's the average days-on-market for RENTAL listings here right now (not sales)? A rising rental-DOM trend means longer vacancies and softer asking-rent achievability than the comps imply.
- What's the recent tenant-quality profile in this submarket — average credit score on applications, eviction rate, late-payment / NSF rate, and stable-employment percentage? A property-management company in the area should have these aggregated.
- How much new for-sale + rental construction is in the pipeline within 1–3 miles? Heavy new supply typically softens prices + rents 12–24 months out; constrained supply supports both.
Investment metrics
- 1% rule
- 1.14% ✓
- Cap rate
- 6.80%
- Cash-on-cash
- 1.80%
- DSCR
- 1.08
- GRM
- 7.3
CMA / ARV
- ARV (on-the-fly)
- $274,176
- Comps found
- 12
Show comp detail 12 sales within ~0.75 mi
| Address | Dist | Beds/Ba | Sqft | Sold | Price | $/sf | Match |
|---|---|---|---|---|---|---|---|
| 1115 S 3rd Ave | 0.45mi | 3/2.0 | 1,292 (-4%) | 4mo | $320,000 | $248 | 69 |
| 501 S 9th Ave | 0.16mi | 3/2.0 | 1,170 (-13%) | 5mo | $310,000 | $265 | 67 |
| 622 S 11th Ave | 0.17mi | 3/1.0 | 1,200 (-11%) | 9mo | $77,914 | $65 | 63 |
| 820 S 17th Ave | 0.54mi | 3/2.0 | 1,420 (+6%) | 4mo | $290,000 | $204 | 62 |
| 1415 Washington Blvd | 0.40mi | 3/2.0 | 1,240 (-8%) | 9mo | $347,900 | $281 | 61 |
| 126 S 12th Ave | 0.48mi | 3/1.5 | 1,440 (+7%) | 5mo | $290,000 | $201 | 59 |
| 1318 S 6th Ave | 0.42mi | 3/2.0 | 1,476 (+10%) | 10mo | $330,000 | $224 | 56 |
| 1710 S 2nd Ave | 0.74mi | 3/2.0 | 1,400 (+4%) | 4mo | $250,000 | $179 | 56 |
| 1203 S 4th Ave | 0.43mi | 3/1.5 | 1,500 (+12%) | 4mo | $337,500 | $225 | 55 |
| 813 S 3rd Ave | 0.39mi | 3/1.0 | 1,213 (-10%) | 10mo | $227,000 | $187 | 53 |
| 316 S 2nd Ave | 0.48mi | 4/1.5 (+1) | 1,500 (+12%) | 1mo | $269,900 | $180 | 50 |
| 35 S 16th Ave | 0.71mi | 2/1.0 (-1) | 1,465 (+9%) | 3mo | $296,000 | $202 | 40 |
Match score weights: distance 35% · size 25% · config 20% · recency 20%. Top-matched comps best support the ARV.
Projected returns pro-forma
-3.0% appreciation · 3.0% rent growth · sell at horizon
- IRR
- -13.3%
- Equity multiple
- 0.52×
- Total profit
- $-26,153
- Equity at exit
- $29,075
- IRR
- -4.2%
- Equity multiple
- 0.72×
- Total profit
- $-15,102
- Equity at exit
- $16,860
Cash invested: $54,600 (down + closing). Projections, not guarantees.
Landlord ↔ Tenant lean methodology
- Overall (STATE)
- 43 Moderately Tenant-Leaning
- State Illinois
- 43 Moderately Tenant-Leaning · D+7
- County
- — inherits STATE
- City
- — inherits STATE
ZIP-level market 60153
- Home prices YoY
- -20.5%
- Active inventory
- 72
- Price-to-rent
- 7.3×
Monthly cashflow live
- Estimated rent
- $2,229 high interval (Pro) →
- Mortgage (P&I)
- −$1,023
- Tax from tax record
- −$576 /mo · $6,907/yr
- Insurance
- −$81
- HOA
- −$0
- Vacancy / Maint / Mgmt
- −$468
- Net cashflow
- $82
Break-even live
Sensitivity live
| Price | -10% $192 | -5% $137 | +0% $82 | +5% $27 | +10% $-29 |
|---|---|---|---|---|---|
| Rent | -10% $-94 | -5% $-6 | +0% $82 | +5% $170 | +10% $258 |
| Rate | -1.0pp $180 | -0.5pp $131 | base $82 | +0.5pp $31 | +1.0pp $-20 |
UW: 25.0% down · 7.5% · 30yr · 1.5% tax · 5.0% vac · 8.0% maint · 8.0% mgmt
Financing live
Cash to close
- Down payment
- $48,750
- Closing costs
- $5,850
- Reserves months
- —
- Total cash needed
- —
Loan-product check · same deal, 3 products live
Conventional
25% down · 7.5% · 30yr
- Down + closing
- —
- Monthly P&I
- —
- Monthly cashflow
- —
- DSCR
- —
- Eligible?
- —
Personal DTI + credit; lowest rate.
DSCR
20% down · 8.5% · 30yr
- Down + closing
- —
- Monthly P&I
- —
- Monthly cashflow
- —
- DSCR
- —
- Eligible?
- —
No personal income docs; deal must DSCR.
Hard money
10% down · 12.0% · 12mo
- Down + closing
- —
- Monthly P&I
- —
- Monthly cashflow
- —
- DSCR
- —
- Eligible?
- —
Short-term bridge; refi at stabilization.
Rent comps 12 comps
| Address | Beds | Baths | Sqft | Rent | $/sqft | DOM | Units | Dist |
|---|---|---|---|---|---|---|---|---|
| 903 S 5th Ave Unit 2D Maywood, IL | 3.0 | 2.0 | 1008 | $2,100 | $2.08 | 0d | 1 | 0.29mi |
| 410 School St Unit 1B Maywood, IL | 3.0 | 2.0 | 1218 | $2,200 | $1.81 | 0d | 1 | 0.30mi |
| 218 S 13th Ave Unit 2 Maywood, IL | 2.0 | 1.0 | 1050 | $1,650 | $1.57 | 7d | 1 | 0.40mi |
| 1814 Warren St Maywood, IL | 3.0 | 1.0 | 1200 | $2,500 | $2.08 | 12d | 1 | 0.62mi |
| 1814 Warren St Unit 2W Maywood, IL | 3.0 | 1.0 | 1200 | $2,500 | $2.08 | 0d | 1 | 0.62mi |
| 1610 S 4th Ave Maywood, IL | 3.0 | 2.5 | 1754 | $4,500 | $2.57 | 0d | 1 | 0.64mi |
| 604 N 8th Ave Maywood, IL | 2.0 | 1.0 | 1200 | $2,350 | $1.96 | 24d | 1 | 0.82mi |
| 2040 16th Ave Unit 2C Broadview, IL | 2.0 | 1.0 | 900 | $1,595 | $1.77 | 15d | 1 | 1.09mi |
| 2036 S 1st Ave Maywood, IL | 4.0 | 2.0 | 1363 | $2,750 | $2.02 | 0d | 1 | 1.13mi |
| 2036 S 1st Ave Maywood, IL | 4.0 | 2.0 | 1363 | $2,750 | $2.02 | 3d | 1 | 1.13mi |
| 7753 Van Buren St #212 Forest Park, IL | 2.0 | 2.0 | 1289 | $2,800 | $2.17 | 12d | 1 | 1.34mi |
| 1419 N 16th Ave Melrose Park, IL | 2.0 | 1.0 | 1000 | $1,650 | $1.65 | 0d | 1 | 1.42mi |
Listing history 6 events
-
2026-06-21days on market $195,000 Active 9 DOM
-
2026-06-18days on market $195,000 Active 6 DOM
-
2026-06-17days on market $195,000 Active 5 DOM
-
2026-06-16days on market $195,000 Active 4 DOM
-
2026-06-15days on market $195,000 Active 3 DOM
-
2026-06-13$195,000 Active 1 DOM
ⓘ Source: listings_history table (triggers on properties + properties_extension) + one-shot
backfill from property_details.listing_events for pre-trigger history.
Tax reassessment forecast IL · Partial reset (capped growth)
- Current annual tax
- $6,907 · $576/mo
- Projected year-2 tax
- $6,907 · $576/mo
- Expected delta
- $0/yr ($0/mo · 0.0%)
ⓘ Screening estimate from a state-policy table — verify with the county assessor before closing.
Climate risk First Street
- Flood 6/10 Major FEMA zone X (unshaded) · 74% chance over 30 yrs
- Wildfire 1/10 Low
- Heat 3/10 Moderate 7 d/yr ≥100°F today · 14 d/yr by 30 yrs out
- Wind 2/10 Low 100% chance of damaging wind over 30 yrs
- Air quality 5/10 Major 6 unhealthy d/yr today · 8 by 30 yrs out
Nearby sold comps map
Loading sold comps map…
Walkable amenities ~0.75 mi
Loading nearby amenities…
Taxation est. · year 1
- Rental income
- $26,753
- − Mortgage interest
- −$10,923
- − Property taxes
- −$6,907
- − Insurance
- −$975
- − Repairs & maintenance
- −$2,140
- − Management
- −$2,140
- − Depreciation
- −$5,673
- Taxable loss
- −$2,006
- Est. tax savings @ 24.0%
- +$481
- After-tax cash flow
- $1,463/yr
For passive investors: Depreciation is non-cash, so a rental often shows a tax loss while cash-flowing — sheltering income. Rental losses are passive: they offset passive income freely, and up to $25,000/yr can offset ordinary (W-2) income if you actively participate and your MAGI is under $100k (phasing out to $0 by $150k); unused losses carry forward. On sale, claimed depreciation is recaptured at up to 25%, and gains may owe capital-gains tax (a 1031 exchange can defer both). Figures are a year-1 estimate at your 24.0% rate — not tax advice; consult a CPA.
Schools (NCES district)
- District
- Maywood-Melrose Park-Broadview 89
- NCES district ID
- 1725110
- Math proficiency
- 14% ▲ 1.00%
- Reading proficiency
- 21% ▲ 4.00%
- Median HH income
- $45,567
- Composite
- 18.75/100
- National rank
- #14003
- State rank
- #738 of 919 in IL
Livability — Maywood
- Score
- 78/100
- State rank
- #146
- US rank
- #2694
Category grades
Schools grade is shown separately in the Schools card above.
Census & demographics
- Census place
- Maywood, IL
- County
- Cook County · 4,486,803 people
- City population
- 23,201
- Metro
- Chicago-Naperville-Elgin, IL-IN-WI
- Population (ZIP)
- 23,201
- Household income
- $68,815
- Rent vs Own
- Severe rent burden
- 869.0
Population outlook (Cook County) Hauer SSP2
- Today (2025)
- 5,347,519 people
- By 2030
- 5,357,703 · +0.2%
- By 2040
- 5,324,924 · -0.4%
- By 2050
- 5,230,762 · -2.2%
- By 2075
- 4,785,735 · -10.5%
- By 2100
- 4,188,836 · -21.7%
Race, ethnicity, and origin ACS 2023
- Neighborhood character
- Diverse neighborhood (Simpson 0.56)
- Race & ethnicity
- Black 57% Hispanic / Latino 33% Two or more races 11% White 6%
- Hispanic origin (detail)
- Mexican 28% Puerto Rican 3%
- Common ancestry
- Romanian 1% British 1%
- Foreign-born
- 14% · Canada, Jamaica
- Languages at home
- 68% English-only · Spanish 30% French/Haitian/Cajun 2%
Political lean MEDSL · Cook
- 2024 margin
- Solid D (+42.0) · D 70.4% · R 28.4% · Other 1.2%
- 2008→2024 swing
- -11.4pp toward R · 2008: 53.4pp · 2024: 42.0pp
- All cycles
- 2024: D+42.0 2020: D+50.3 2016: D+53.0 2012: D+49.4 2008: D+53.4
Not yet ingested
- Civics
- —
Market trends
- HPI YoY
- ▼ -86.90%
- Current HPI
- 336.2159
- Rent YoY
- —
- Metro
- Chicago-Naperville-Elgin, IL-IN-WI
- State GDP YoY
- ▲ 1.59%
- F500 in state
- 60
Industry mix (Fortune 500 HQ in IL)
| Industry | F500 HQs | Revenue |
|---|---|---|
| Insurance | 4 | $201B |
|
||
| Consumer Goods | 4 | $87B |
|
||
| Industrial Machinery | 3 | $64B |
|
||
| Healthcare | 2 | $55B |
|
||
| Retail / Pharmacy | 1 | $148B |
|
||
| Agriculture / Food | 1 | $86B |
|
||
Price history
+0.0% since first listed2 events — show timeline
- 2026-06-12 Listed $195,000 MRED as Distributed by MLS Grid
- 2026-06-11 Coming Soon $195,000 MRED as Distributed by MLS Grid
Property tax history
+4.4%/yrLatest (2023): $6,907 · +121.6% YoY. Source: county tax records.
Cash-flow waterfall
monthlySold comps — $/sqft
last 12 mo · ≤1 miLoading sold comps…