 🏷️ Likely Rental
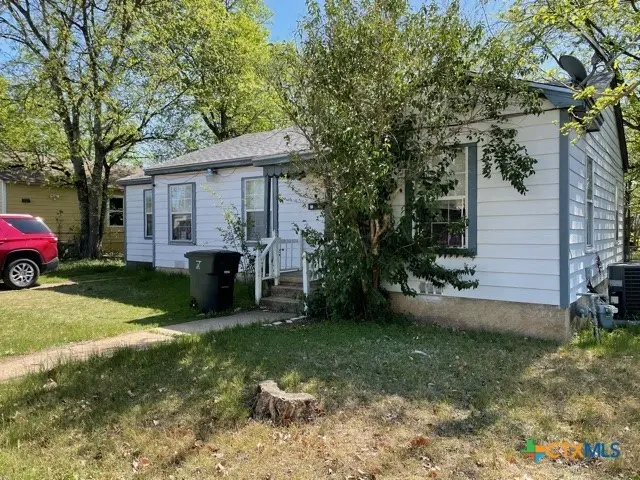
210 Carter St · Killeen, TX
Flood risk 1/10 · Minimal
- FEMA flood zone
- X (unshaded)
- Chance of flooding over 30 yrs
- 0.0%
- Est. flood insurance / yr
- $507 – $1,088
Fire risk 4/10 · Minor
- Est. fire insurance / yr
- $1,222 – $2,270
Heat risk 7/10 · Major
- Hot days now (above 107°F)
- 7 days/yr
- Hot days in 30 yrs
- 24 days/yr
Wind risk 6/10 · Moderate
- Chance of severe wind over 30 yrs
- 58.0%
Air-quality risk 1/10 · Minimal
- Unhealthy air days now
- 0 days/yr
- Unhealthy air days in 30 yrs
- 0 days/yr
Risk factors via First Street. Map © Google.
Why this score? — see what drove the B- grade
The composite is a weighted blend of 9 inputs, each scored 0–100. Each bar is that input's sub-score; the figure is the points it added to the 100-point composite (weight × sub-score).
- Cash flow +22.6/30.0
- ARV discount +15.0/15.0
- DSCR +7.2/10.0
- 1% rule +6.7/10.0
- Appreciation +6.1/10.0
- Livability +3.2/5.0
- Schools +3.0/10.0
- Condition / age +2.5/5.0
- Rent growth +2.0/5.0
$87,500
🖨 Deal sheet (PDF) 📄 Offer letter ✓ Due diligence
Listing remarks MLS
Great SFR - Was rented month to month for $1050! Good condition, recently painted inside. 1/2 bath in Master, full bath on hall, large fenced backyard! New roof installed Sept 2025! Priced appropriately!
Key facts
- New roof installed
- 6,865 sq ft lot
- Built 1948
Tags
Neighborhood map
What this means for you Summary
Snapshot
- This is a 3-bed/1.0-bath single-family listed at $88k.
Deal economics
- At list price, monthly cash flow is $149 ($2k/yr) — positive.
- The deal already cash-flows at list — no discount required.
- Meets the 1% rule at list price ($1k rent vs $88k).
- Recommended offer: $77k (12.0% below list) — sets the bar for market timing.
- Cap rate 8.3% vs local median 3.9% in Killeen — top-decile yield for the area; either an underpriced asset or a hidden risk that comps aren't pricing in. Stress-test before assuming the spread holds.
Location & tenants
- Location reads 63/100 on livability (#853 in TX) — a middle-class / working-renter tenant base. Strengths: cost of living A+, housing A+; Watch: amenities D, employment D, crime D-.
- Killeen ISD (urban): math 31% / reading 38% proficiency, ranked #524 of 826 in TX (top 63%) — families likely to look elsewhere, expect single-tenant / working-renter base with shorter leases.
- Zoned schools: Killeen H S (math 29% / reading 40%, grade F, #963 of 1,632 statewide, top 61%, 2,076 students, 69% FRL) — zoned schools average 69% FRL vs 47% district-wide (22 pts higher); higher-poverty schools than district average — tighter screening recommended.
- Market conditions: Rents soft (-2.0%/yr); 126 active listings in the ZIP; 40 comparable units currently listed for rent nearby; rentals lingering (median 46d on market — plan ~5-8 weeks vacancy on turnover, expect pricing pressure); 65% of comp listings sitting > 30 days — soft ceiling on asking rent; lower-income renter base — watch delinquency; 3,222 units permitted in Bell County in 2024 (246 in 5+ unit buildings).
Forward outlook
- In year one you build about $3k of equity ($605 loan paydown + $2k appreciation (2.3% local appreciation)).
- Bell County population projected at +21% by 2050 — long-run rental-demand tailwind backs the buy-and-hold thesis.
- At projected returns (2.3% appreciation + 0.0% rent growth), your $24k cash investment doubles in ~6 years — after that, you're playing with house money.
Negotiation context
- It's been on market 138 days — a 12% lower offer ($77k) is reasonable based on typical stale-listing flexibility.
- 6 sale attempts since 13y ago with the ask held roughly flat each time — persistent listings suggest the price (not the market) is what's stuck; bring a comps-based counter.
- Current owner paid $45k; list at $88k implies a 94% gain — meaningful room to come down on a strong offer.
Risks & watch-outs
- Watch-outs: built in 1948 — expect roof / HVAC / electrical / plumbing capex.
- Climate carrying-cost: major wind risk, 58% chance of damaging wind over 30y; extreme-heat days projected 7→24/yr by 2055 (HVAC capex compounding) — expect insurance premiums to compound above CPI over the hold.
Questions for the listing agent
- It's been on market 138 days. Have you received any prior offers? Is the seller open to a 12% concession, seller financing, or rate buy-down credit?
- Built in 1948 — when were the roof, HVAC, electrical panel, plumbing, and water heater last replaced?
- Why hasn't it sold? Are there any deal-killer items the seller is aware of (foundation, flood, title, zoning, code violations)?
- Is there a deadline driving the sale (1031 exchange, divorce, estate, relocation)? That informs how much negotiation room exists.
- Schools are D-rated, which usually means shorter tenancies and higher turnover. Who's the typical renter profile here, and what's been the actual vacancy rate?
- Crime grade is D in this area — have there been break-ins, vandalism, or insurance claims at this property in the last 3 years? What carrier currently insures it and at what premium?
- What's the average days-on-market for RENTAL listings here right now (not sales)? A rising rental-DOM trend means longer vacancies and softer asking-rent achievability than the comps imply.
- What's the recent tenant-quality profile in this submarket — average credit score on applications, eviction rate, late-payment / NSF rate, and stable-employment percentage? A property-management company in the area should have these aggregated.
- How much new for-sale + rental construction is in the pipeline within 1–3 miles? Heavy new supply typically softens prices + rents 12–24 months out; constrained supply supports both.
Investment metrics
- 1% rule
- 1.17% ✓
- Cap rate
- 8.33%
- Cash-on-cash
- 7.29%
- DSCR
- 1.32
- GRM
- 7.1
CMA / ARV
- ARV (median comp)
- $120,658
- List price
- $87,500
- Delta
- -27.48%
- Verdict
- UNDERPRICED
- Comps
- 20 within 1.0 mi
Show comp detail 2 sales within ~0.75 mi
| Address | Dist | Beds/Ba | Sqft | Sold | Price | $/sf | Match |
|---|---|---|---|---|---|---|---|
| 807 Cloud St | 0.47mi | 3/1.0 | 1,160 (+2%) | 3mo | $90,000 | $78 | 71 |
| 608 Dimple St | 0.48mi | 2/1.0 (-1) | 996 (-12%) | 14mo | $102,000 | $102 | 41 |
Match score weights: distance 35% · size 25% · config 20% · recency 20%. Top-matched comps best support the ARV.
Projected returns pro-forma
2.26% appreciation · 0.0% rent growth · sell at horizon
- IRR
- 10.4%
- Equity multiple
- 1.56×
- Total profit
- $13,693
- Equity at exit
- $35,756
- IRR
- 11.5%
- Equity multiple
- 2.48×
- Total profit
- $36,347
- Equity at exit
- $52,463
Cash invested: $24,500 (down + closing). Projections, not guarantees.
Landlord ↔ Tenant lean methodology
- Overall (STATE)
- 87 Strongly Landlord-Friendly
- State Texas
- 87 Strongly Landlord-Friendly · R+5
- County
- — inherits STATE
- City
- — inherits STATE
ZIP-level market 76541
- Home prices YoY
- 1.4%
- Rents YoY
- -2.0%
- Active inventory
- 126
- Price-to-rent
- 7.1×
Monthly cashflow live
- Estimated rent
- $1,024 high interval (Pro) →
- Mortgage (P&I)
- −$459
- Tax from tax record
- −$165 /mo · $1,974/yr
- Insurance
- −$36
- HOA
- −$0
- Vacancy / Maint / Mgmt
- −$215
- Net cashflow
- $149
Break-even live
Sensitivity live
| Price | -10% $198 | -5% $174 | +0% $149 | +5% $124 | +10% $99 |
|---|---|---|---|---|---|
| Rent | -10% $68 | -5% $108 | +0% $149 | +5% $189 | +10% $230 |
| Rate | -1.0pp $193 | -0.5pp $171 | base $149 | +0.5pp $126 | +1.0pp $103 |
UW: 25.0% down · 7.5% · 30yr · 1.5% tax · 5.0% vac · 8.0% maint · 8.0% mgmt
Financing live
Cash to close
- Down payment
- $21,875
- Closing costs
- $2,625
- Reserves months
- —
- Total cash needed
- —
Loan-product check · same deal, 3 products live
Conventional
25% down · 7.5% · 30yr
- Down + closing
- —
- Monthly P&I
- —
- Monthly cashflow
- —
- DSCR
- —
- Eligible?
- —
Personal DTI + credit; lowest rate.
DSCR
20% down · 8.5% · 30yr
- Down + closing
- —
- Monthly P&I
- —
- Monthly cashflow
- —
- DSCR
- —
- Eligible?
- —
No personal income docs; deal must DSCR.
Hard money
10% down · 12.0% · 12mo
- Down + closing
- —
- Monthly P&I
- —
- Monthly cashflow
- —
- DSCR
- —
- Eligible?
- —
Short-term bridge; refi at stabilization.
Rent comps 40 comps
| Address | Beds | Baths | Sqft | Rent | $/sqft | DOM | Units | Dist |
|---|---|---|---|---|---|---|---|---|
| 207 Cloud St Killeen, TX | 2.0 | 1.0 | 894 | $797 | $0.89 | 46d | 1 | 0.01mi |
| 303 Cloud St Killeen, TX | 2.0 | 1.0 | 768 | $895 | $1.17 | 25d | 1 | 0.09mi |
| 717 Norris Ave Killeen, TX | 3.0 | 1.0 | 1118 | $1,000 | $0.89 | 46d | 1 | 0.25mi |
| 309 Root Ave Unit 1 Killeen, TX | 2.0 | 1.0 | 700 | $850 | $1.21 | 16d | 1 | 0.42mi |
| 514 McArthur Dr Killeen, TX | 3.0 | 1.0 | 1084 | $995 | $0.92 | 46d | 1 | 0.43mi |
| 512 Raymond St Unit B Killeen, TX | 3.0 | 2.5 | 1336 | $1,300 | $0.97 | 25d | 1 | 0.44mi |
| 512 Raymond St Killeen, TX | 3.0 | 2.5 | 1336 | $1,300 | $0.97 | 46d | 1 | 0.44mi |
| 605 Stringer St Unit A Killeen, TX | 3.0 | 2.5 | 1334 | $1,500 | $1.12 | 46d | 1 | 0.47mi |
| 614 Stringer St Killeen, TX | 1.0–2.0 | 1.0 | 607 | $699 | $1.15 | 16d | 8 | 0.50mi |
| 505 W Church Ave Killeen, TX | 3.0 | 1.0 | 1160 | $1,100 | $0.95 | 16d | 1 | 0.51mi |
| 603 Wolf St Killeen, TX | 3.0 | 1.0 | 786 | $952 | $1.21 | 46d | 1 | 0.57mi |
| 905 N Gilmer St Killeen, TX | 1.0–3.0 | 1.0–2.0 | 925 | $1,395 | $1.51 | 16d | 5 | 0.58mi |
| 209 West Avenue A Unit A Killeen, TX | 3.0 | 2.0 | 876 | $935 | $1.07 | 16d | 1 | 0.61mi |
| 806 Houston St Killeen, TX | 2.0 | 1.0 | 748 | $900 | $1.20 | 46d | 1 | 0.67mi |
| 906 Sissom Rd Apt 1 Killeen, TX | 2.0 | 1.0 | 998 | $875 | $0.88 | 25d | 1 | 0.74mi |
| 909 Houston St Killeen, TX | 3.0 | 2.0 | 1200 | $1,195 | $1.00 | 46d | 1 | 0.76mi |
| 901 Sissom Rd Unit 3 Killeen, TX | 2.0 | 1.0 | 1000 | $875 | $0.88 | 16d | 1 | 0.76mi |
| 1111 N College St Unit B Killeen, TX | 3.0 | 2.0 | 1235 | $995 | $0.81 | 16d | 1 | 0.76mi |
| 409 Short Ave Killeen, TX | 4.0 | 2.0 | 1220 | $1,300 | $1.07 | 46d | 1 | 0.77mi |
| 907 San Antonio St Killeen, TX | 3.0 | 1.5 | 1303 | $1,195 | $0.92 | 46d | 1 | 0.79mi |
| 1203 N College St Unit 1203-207 Killeen, TX | 2.0 | 2.0 | 980 | $725 | $0.74 | 46d | 1 | 0.80mi |
| 1003 San Antonio St Killeen, TX | 4.0 | 1.0 | 1452 | $1,095 | $0.75 | 46d | 1 | 0.81mi |
| 910 San Antonio St Killeen, TX | 3.0 | 1.0 | 1208 | $995 | $0.82 | 46d | 1 | 0.82mi |
| 912 Southside Dr Killeen, TX | 3.0 | 1.0 | 841 | $995 | $1.18 | 46d | 1 | 0.85mi |
| 608 W Dean Ave Killeen, TX | 2.0 | 1.0 | 775 | $1,000 | $1.29 | 25d | 1 | 0.85mi |
| 919 Southside Dr Killeen, TX | 3.0 | 1.0 | 925 | $1,300 | $1.41 | 46d | 1 | 0.87mi |
| 903 W Kern Rd Killeen, TX | 2.0 | 1.0 | 768 | $700 | $0.91 | 46d | 1 | 0.87mi |
| 805 W Dean Ave Killeen, TX | 2.0 | 1.0 | 808 | $675 | $0.84 | 46d | 1 | 0.91mi |
| 1006 N 4th St Unit 8 Killeen, TX | 2.0 | 1.0 | 750 | $700 | $0.93 | 46d | 1 | 0.91mi |
| 201 E Bryce Dr Killeen, TX | 1.0–2.0 | 1.0 | 620 | $1,010 | $1.63 | 46d | 9 | 0.93mi |
| 1717 Walton Walker Dr Unit 1717 Killeen, TX | 3.0 | 1.5 | 1300 | $895 | $0.69 | 46d | 1 | 0.94mi |
| 414 East Avenue A Unit 106 Killeen, TX | 2.0 | 1.0 | 800 | $705 | $0.88 | 16d | 1 | 0.95mi |
| 1112 Williamson Dr Killeen, TX | 2.0 | 1.0 | 815 | $875 | $1.07 | 46d | 1 | 0.96mi |
| 1106 Williamson Dr Unit A Killeen, TX | 3.0 | 1.0 | 900 | $875 | $0.97 | 46d | 1 | 0.96mi |
| 1313 Elia St Killeen, TX | 3.0 | 1.5 | 1104 | $1,050 | $0.95 | 46d | 1 | 0.97mi |
| 1403 N 2nd St Killeen, TX | 1.0–2.0 | 1.0 | 673 | $745 | $1.11 | 16d | 5 | 0.97mi |
| 1117 N 8th St Killeen, TX | 1.0–2.0 | 1.0 | 675 | $800 | $1.19 | 46d | 5 | 1.02mi |
| 110 E Texas Ave Killeen, TX | 2.0 | 1.0 | 832 | $825 | $0.99 | 23d | 1 | 1.02mi |
| 118 E Fowler Ave Killeen, TX | 3.0 | 1.0 | 902 | $875 | $0.97 | 46d | 1 | 1.11mi |
| 1015 N 10th St Unit B Killeen, TX | 3.0 | 2.0 | 1118 | $1,100 | $0.98 | 46d | 1 | 1.12mi |
Listing history 36 events
-
2026-06-22days on market $87,500 Active 138 DOM
-
2026-06-18days on market $87,500 Active 135 DOM
-
2026-06-17days on market $87,500 Active 134 DOM
-
2026-06-16days on market $87,500 Active 133 DOM
-
2026-06-15days on market $87,500 Active 132 DOM
-
2026-06-14days on market $87,500 Active 130 DOM
-
2026-06-13days on market $87,500 Active 129 DOM
-
2026-06-10days on market $87,500 Active 127 DOM
-
2026-06-09days on market $87,500 Active 126 DOM
-
2026-06-08days on market $87,500 Active 125 DOM
-
2026-06-07days on market $87,500 Active 124 DOM
-
2026-06-03days on market $87,500 Active 120 DOM
-
2026-06-02days on market $87,500 Active 119 DOM
-
2026-06-01days on market $87,500 Active 118 DOM
-
2026-05-31days on market $87,500 Active 117 DOM
-
2026-05-30days on market $87,500 Active 116 DOM
-
2026-04-16price $87,500 203-char remark
Show marketing remark (203 chars)
Great SFR - Was rented month to month for $1050! Good condition, recently painted inside. 1/2 bath in Master, full bath on hall, large fenced backyard! New roof installed Sept 2025! Priced appropriately!
-
2026-02-03$89,900 Active 203-char remark
Show marketing remark (203 chars)
Great SFR - Was rented month to month for $1050! Good condition, recently painted inside. 1/2 bath in Master, full bath on hall, large fenced backyard! New roof installed Sept 2025! Priced appropriately!
-
2025-12-22historical
-
2025-09-19price $95,000
-
2025-07-10price $97,500
-
2025-06-03price $100,000
-
2024-12-29price $102,500
-
2024-11-18$105,000 Active
-
2022-06-09soldstatus
-
2022-04-07status Pending
-
2022-04-05status Active
-
2022-03-28status Pending
-
2022-03-23$80,000 Active
-
2017-05-23soldstatus
-
2017-05-21soldstatus $45,000
-
2017-01-25$54,500
-
2013-04-25soldstatus
-
2013-04-24soldstatus $29,950
-
2013-03-18$31,696
-
1985-02-26soldstatus
ⓘ Source: listings_history table (triggers on properties + properties_extension) + one-shot
backfill from property_details.listing_events for pre-trigger history.
Tax reassessment forecast TX · Resets to sale price
- Current annual tax
- $1,974 · $165/mo
- Projected year-2 tax
- $1,974 · $165/mo
- Expected delta
- $0/yr ($0/mo · 0.0%)
ⓘ Screening estimate from a state-policy table — verify with the county assessor before closing.
Climate risk First Street
- Flood 1/10 Low FEMA zone X (unshaded) · 0% chance over 30 yrs
- Wildfire 4/10 Moderate
- Heat 7/10 Severe 7 d/yr ≥107°F today · 24 d/yr by 30 yrs out
- Wind 6/10 Major 58% chance of damaging wind over 30 yrs
- Air quality 1/10 Low 0 unhealthy d/yr today · 0 by 30 yrs out
Nearby sold comps map
Loading sold comps map…
Walkable amenities ~0.75 mi
Loading nearby amenities…
Taxation est. · year 1
- Rental income
- $12,283
- − Mortgage interest
- −$4,901
- − Property taxes
- −$1,974
- − Insurance
- −$438
- − Repairs & maintenance
- −$983
- − Management
- −$983
- − Depreciation
- −$2,545
- Taxable income
- $459
- Est. tax owed @ 24.0%
- −$110
- After-tax cash flow
- $1,675/yr
For passive investors: Depreciation is non-cash, so a rental often shows a tax loss while cash-flowing — sheltering income. Rental losses are passive: they offset passive income freely, and up to $25,000/yr can offset ordinary (W-2) income if you actively participate and your MAGI is under $100k (phasing out to $0 by $150k); unused losses carry forward. On sale, claimed depreciation is recaptured at up to 25%, and gains may owe capital-gains tax (a 1031 exchange can defer both). Figures are a year-1 estimate at your 24.0% rate — not tax advice; consult a CPA.
Schools (NCES district)
- District
- Killeen ISD
- NCES district ID
- 4825660
- Math proficiency
- 31% ▼ -16.00%
- Reading proficiency
- 38% ▼ -3.00%
- Median HH income
- $47,665
- Composite
- 29.69/100
- National rank
- #6458
- State rank
- #524 of 826 in TX
Livability — Killeen
- Score
- 63/100
- State rank
- #853
- US rank
- #15359
Category grades
Schools grade is shown separately in the Schools card above.
Census & demographics
- Census place
- Killeen, TX
- County
- Bell County · 345,090 people
- City population
- 163,398
- Metro
- Killeen-Temple, TX
- Population (ZIP)
- 19,011
- Household income
- $37,349
- Rent vs Own
- Severe rent burden
- 1668.0
Population outlook (Bell County) Hauer SSP2
- Today (2025)
- 371,114 people
- By 2030
- 389,104 · +4.8%
- By 2040
- 420,592 · +13.3%
- By 2050
- 447,779 · +20.7%
- By 2075
- 499,130 · +34.5%
- By 2100
- 505,680 · +36.3%
Race, ethnicity, and origin ACS 2023
- Neighborhood character
- Highly diverse neighborhood (Simpson 0.73)
- Race & ethnicity
- Hispanic / Latino 32% White 31% Black 27% Two or more races 10% Asian 3% Pacific Islander 1%
- Hispanic origin (detail)
- Mexican 21% Puerto Rican 6% Dominican 1%
- Common ancestry
- Italian 2% Slovak 1% Lithuanian 1%
- Foreign-born
- 14% · Canada, Vietnam, South Korea
- Languages at home
- 69% English-only · Spanish 25% German/W. Germanic 2% Korean 1%
Political lean MEDSL · Bell
- 2024 margin
- R (+16.2) · D 41.3% · R 57.6% · Other 1.1%
- 2008→2024 swing
- -6.5pp toward R · 2008: -9.8pp · 2024: -16.2pp
- All cycles
- 2024: R+16.2 2020: R+8.5 2016: R+15.1 2012: R+16.4 2008: R+9.8
Not yet ingested
- Civics
- —
Market trends
- HPI YoY
- ▲ 2.26%
- Current HPI
- 168.1206
- Rent YoY
- ▼ -2.00%
- Metro
- Killeen-Temple, TX
- State GDP YoY
- ▲ 3.95%
- F500 in state
- 110
Industry mix (Fortune 500 HQ in TX)
| Industry | F500 HQs | Revenue |
|---|---|---|
| Energy | 16 | $1,198B |
|
||
| Technology | 5 | $198B |
|
||
| Engineering / Construction | 4 | $72B |
|
||
| Energy Services | 3 | $60B |
|
||
| Utilities | 3 | $41B |
|
||
| Healthcare | 2 | $330B |
|
||
Price history
+176.1% since first listed20 events — show timeline
- 2026-04-16 Price Changed $87,500 CTXMLS
- 2026-02-03 Listed $89,900 CTXMLS
- 2025-12-22 Listing Removed — CTXMLS
- 2025-09-19 Price Changed $95,000 CTXMLS
- 2025-07-10 Price Changed $97,500 CTXMLS
- 2025-06-03 Price Changed $100,000 CTXMLS
- 2024-12-29 Price Changed $102,500 CTXMLS
- 2024-11-18 Listed $105,000 CTXMLS
- 2022-06-09 Sold (Public Records) — Public Records
- 2022-04-07 Pending — CTXMLS
- 2022-04-05 Relisted — CTXMLS
- 2022-03-28 Pending — CTXMLS
- 2022-03-23 Listed $80,000 CTXMLS
- 2017-05-23 Sold (Public Records) — Public Records
- 2017-05-21 Sold (MLS) $45,000 CTXMLS
- 2017-01-25 Listed $54,500 CTXMLS
- 2013-04-25 Sold (Public Records) — Public Records
- 2013-04-24 Sold (MLS) $29,950 CTXMLS
- 2013-03-18 Listed $31,696 CTXMLS
- 1985-02-26 Sold (Public Records) — Public Records
Property tax history
+10.1%/yrLatest (2025): $1,974 · +16.0% YoY. Source: county tax records.
Cash-flow waterfall
monthlySold comps — $/sqft
last 12 mo · ≤1 miLoading sold comps…