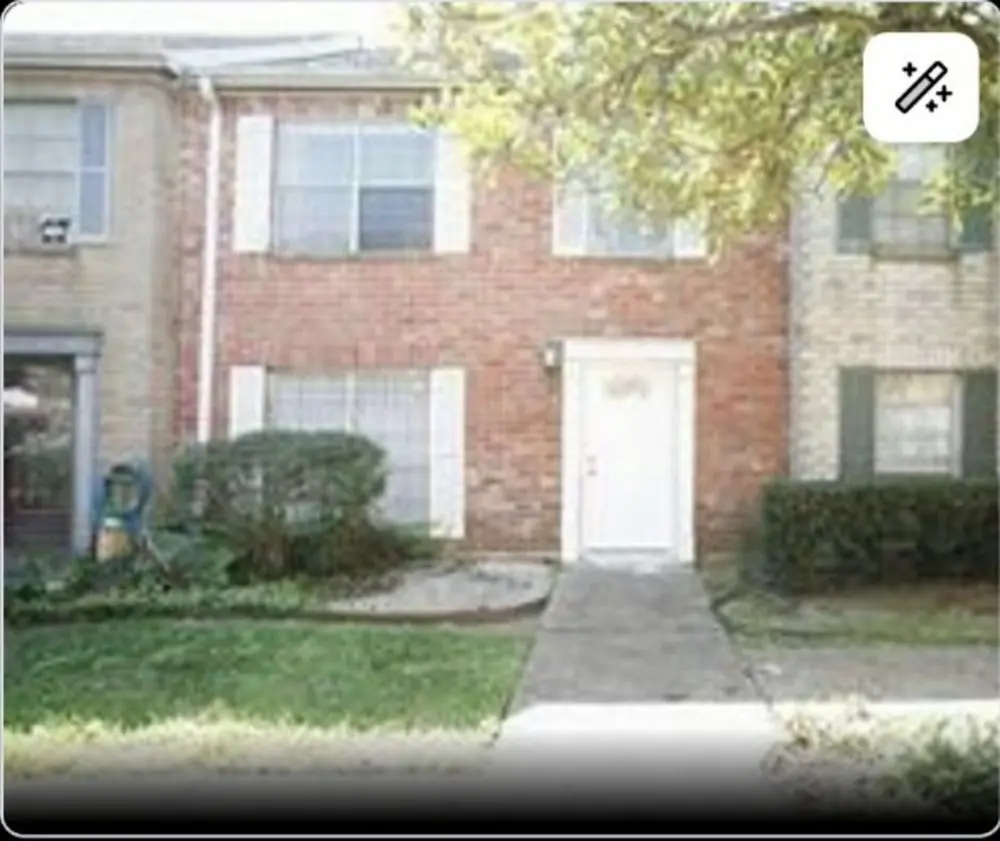
4016 Belle Park Dr · Houston, TX
Flood risk 5/10 · Moderate
- FEMA flood zone
- AE
- Chance of flooding over 30 yrs
- 0.59%
- Est. flood insurance / yr
- $1,737 – $8,500
Fire risk 1/10 · Minimal
- Est. fire insurance / yr
- $1,222 – $2,270
Heat risk 9/10 · Severe
- Hot days now (above 110°F)
- 7 days/yr
- Hot days in 30 yrs
- 23 days/yr
Wind risk 9/10 · Severe
- Chance of severe wind over 30 yrs
- 99.0%
Air-quality risk 2/10 · Minimal
- Unhealthy air days now
- 2 days/yr
- Unhealthy air days in 30 yrs
- 2 days/yr
Risk factors via First Street. Map © Google.
Why this score? — see what drove the D grade
The composite is a weighted blend of 9 inputs, each scored 0–100. Each bar is that input's sub-score; the figure is the points it added to the 100-point composite (weight × sub-score).
- Cash flow +11.8/30.0
- 1% rule +10.0/10.0
- ARV discount +7.5/15.0
- Condition / age +3.8/5.0
- Livability +3.7/5.0
- DSCR +3.5/10.0
- Rent growth +2.5/5.0
- Schools +2.1/10.0
- Appreciation +0.0/10.0
$95,000
🖨 Deal sheet (PDF) 📄 Offer letter ✓ Due diligence
Listing remarks
INVESTOR OR FIRST-TIME BUYER OPPORTUNITY: Priced for an immediate cash or conventional sale at just $95,000, this spacious 1,380 sq. ft. townhome offers massive instant equity in a high-demand Houston location. ATTENTION AGENTS: Seller is proudly offering a 3% commission to any buyer's agent who brings a qualified buyer to a successful closing! ANTI-SCAM & SECURITY DIRECTIVE (READ BEFORE MESSAGING): Strictly NO wholesalers, corporate assignable contracts, or off-platform contact requests. All communication stays strictly inside this platform's messaging system until financial verification is complete. Do NOT send messages asking for my personal cell phone number, email address, or re
Key facts
- High demand location
- Community pool
- Built 1977
Tags
Neighborhood map
What this means for you Summary
Snapshot
- This is a 2-bed/2.5-bath condo listed at $95k. Condition is rated good.
Deal economics
- At list price, monthly cash flow is $-452 ($-5k/yr) — negative.
- The deal already cash-flows at list — no discount required.
- Meets the 1% rule at list price ($1k rent vs $95k).
- Recommended offer: $94k (1.5% below list) — sets the bar for market timing.
- Cap rate 6.0% vs local median 3.2% in Houston — top-decile yield for the area; either an underpriced asset or a hidden risk that comps aren't pricing in. Stress-test before assuming the spread holds.
Location & tenants
- Location reads 74/100 on livability (#184 in TX, #4,771 nationally) — a middle-class / working-renter tenant base. Strengths: amenities A+, cost of living A+, housing A+; Watch: crime F.
- Alief ISD (urban): math 23% / reading 28% proficiency, ranked #717 of 826 in TX (top 87%) — low school quality limits family demand, transient renter base, plan for 1-2y turnover; 74% free/reduced lunch — lower-income household profile, screen leases tightly.
- Zoned schools: Chancellor El (math 26% / reading 24%, grade F, #3,013 of 4,322 statewide, top 70%, 723 students, 92% FRL); Alief Middle (math 22% / reading 26%, grade F, #1,301 of 1,662 statewide, top 79%, 839 students, 87% FRL); Alief Isd J J A E P (13 students, 77% FRL).
- Market conditions: Rents flat; 208 active listings in the ZIP; 40 comparable units currently listed for rent nearby; rentals at typical pace (median 14d on market — plan ~3-4 weeks tenant-placement turnaround); 29,883 units permitted in Harris County in 2024 (8,621 in 5+ unit buildings).
- This rent runs 34% of the median local income ($51k/yr) — at the standard rent-burdened threshold; future hikes will face affordability resistance.
Forward outlook
- Local home prices are declining (-3.0%/yr); year-one equity from $657 of loan paydown is wiped out by about $3k of value loss. Plan a longer hold.
- Harris County population projected at +47% by 2050 — long-run rental-demand tailwind backs the buy-and-hold thesis.
Negotiation context
- It's been on market 18 days — a 2% lower offer ($94k) is reasonable based on typical stale-listing flexibility.
Risks & watch-outs
- Watch-outs: flood insurance adds $427/mo; HOA is 35% of rent.
- Climate carrying-cost: in FEMA flood zone AE (mandatory federal flood insurance); severe wind risk, 99% chance of damaging wind over 30y; extreme-heat days projected 7→23/yr by 2055 (HVAC capex compounding) — expect insurance premiums to compound above CPI over the hold.
Questions for the listing agent
- What do current leases actually rent for vs. the listed asking? Can we see a recent rent roll and the last 12 months of T-12 income?
- Built in 1977 — when were the roof, HVAC, electrical panel, plumbing, and water heater last replaced?
- What's the actual annual flood-insurance premium (NFIP or private), and is the property in a SFHA with mandatory coverage?
- What does the HOA fee cover, when was the last increase, and are there any pending special assessments or reserve-fund shortfalls?
- Any open or pending special assessments — roof, HVAC, plumbing, elevator, façade? What's the per-unit balance and payoff schedule, and is the seller paying it off at close or rolling it to the buyer?
- Is there a deadline driving the sale (1031 exchange, divorce, estate, relocation)? That informs how much negotiation room exists.
- Schools are D-rated, which usually means shorter tenancies and higher turnover. Who's the typical renter profile here, and what's been the actual vacancy rate?
- Crime grade is F in this area — have there been break-ins, vandalism, or insurance claims at this property in the last 3 years? What carrier currently insures it and at what premium?
- The area grade is low — what's the realistic commute time and amenity access for the typical tenant pool here? Any planned neighborhood developments (good or bad) we should know about?
- What's the average days-on-market for RENTAL listings here right now (not sales)? A rising rental-DOM trend means longer vacancies and softer asking-rent achievability than the comps imply.
- What's the recent tenant-quality profile in this submarket — average credit score on applications, eviction rate, late-payment / NSF rate, and stable-employment percentage? A property-management company in the area should have these aggregated.
- How much new apartment / multifamily construction is in the pipeline within 1–3 miles? Heavy new supply (>2% of stock underway) typically softens rents 12–24 months out; light construction supports rent growth.
Investment metrics
- 1% rule
- 1.51% ✓
- Cap rate
- 5.97%
- Cash-on-cash
- -1.16%
- DSCR
- 0.95
- GRM
- 5.5
CMA / ARV
No comps found within radius.
Projected returns pro-forma
-3.0% appreciation · 0.05% rent growth · sell at horizon
- IRR
- -71.7%
- Equity multiple
- -0.80×
- Total profit
- $-47,755
- Equity at exit
- $14,165
- IRR
- —
- Equity multiple
- -2.47×
- Total profit
- $-92,302
- Equity at exit
- $8,214
Cash invested: $26,600 (down + closing). Projections, not guarantees.
Landlord ↔ Tenant lean methodology
- Overall (STATE)
- 87 Strongly Landlord-Friendly
- State Texas
- 87 Strongly Landlord-Friendly · R+5
- County
- — inherits STATE
- City
- — inherits STATE
ZIP-level market 77072
- Home prices YoY
- -26.4%
- Rents YoY
- 0.1%
- Active inventory
- 208
- Price-to-rent
- 5.5×
Monthly cashflow live
- Estimated rent
- $1,438 high interval (Pro) →
- Mortgage (P&I)
- −$498
- Tax est. 1.5%
- −$119 /mo · $1,425/yr
- Insurance
- −$40
- Flood insurance flood zone
- −$427 /mo · $5,118/yr
- HOA est. from 2 same-building comps
- −$505
- Lot rent
- −$0
- Vacancy / Maint / Mgmt
- −$302
- Net cashflow
- $-452
Break-even live
Sensitivity live
| Price | -10% $-387 | -5% $-420 | +0% $-452 | +5% $-485 | +10% $-518 |
|---|---|---|---|---|---|
| Rent | -10% $-566 | -5% $-509 | +0% $-452 | +5% $-396 | +10% $-339 |
| Rate | -1.0pp $-405 | -0.5pp $-428 | base $-452 | +0.5pp $-477 | +1.0pp $-502 |
UW: 25.0% down · 7.5% · 30yr · 1.5% tax · 5.0% vac · 8.0% maint · 8.0% mgmt
Financing live
Cash to close
- Down payment
- $23,750
- Closing costs
- $2,850
- Reserves months
- —
- Total cash needed
- —
Loan-product check · same deal, 3 products live
Conventional
25% down · 7.5% · 30yr
- Down + closing
- —
- Monthly P&I
- —
- Monthly cashflow
- —
- DSCR
- —
- Eligible?
- —
Personal DTI + credit; lowest rate.
DSCR
20% down · 8.5% · 30yr
- Down + closing
- —
- Monthly P&I
- —
- Monthly cashflow
- —
- DSCR
- —
- Eligible?
- —
No personal income docs; deal must DSCR.
Hard money
10% down · 12.0% · 12mo
- Down + closing
- —
- Monthly P&I
- —
- Monthly cashflow
- —
- DSCR
- —
- Eligible?
- —
Short-term bridge; refi at stabilization.
Rent comps 40 comps
| Address | Beds | Baths | Sqft | Rent | $/sqft | DOM | Units | Dist |
|---|---|---|---|---|---|---|---|---|
| 4343 Willow Beach Dr Houston, TX | 2.0 | 2.0 | 1456 | $1,695 | $1.16 | 24d | 1 | 0.41mi |
| 11218 Westpark Dr Houston, TX | 3.0 | 2.0 | 1551 | $1,763 | $1.14 | 19d | 1 | 0.88mi |
| 11218 Westpark Dr Houston, TX | 2.0 | 2.0 | 1132 | $1,461 | $1.29 | 26d | 1 | 0.88mi |
| 11218 Westpark Dr Houston, TX | 3.0 | 2.0 | 1551 | $1,763 | $1.14 | 46d | 1 | 0.88mi |
| 14912 Westpark Dr Houston, TX | 1.0 | 1.0 | 1017 | $1,127 | $1.11 | 24d | 1 | 0.89mi |
| 14912 Westpark Dr Houston, TX | 2.0 | 2.0 | 1332 | $1,349 | $1.01 | 26d | 1 | 0.89mi |
| 14912 Westpark Dr Houston, TX | 1.0 | 1.0 | 1017 | $1,127 | $1.11 | 46d | 1 | 0.89mi |
| 11355 Richmond Ave Houston, TX | 1.0–3.0 | 1.0–2.0 | 909 | $1,401 | $1.54 | 0d | 35 | 0.90mi |
| 4551 Cook Rd Houston, TX | 2.0 | 2.0 | 970 | $1,093 | $1.13 | 46d | 1 | 0.95mi |
| 11212 Westpark Dr Houston, TX | 1.0–3.0 | 1.0–2.0 | 1129 | $1,472 | $1.30 | 1d | 28 | 0.95mi |
| 3231 Woodland Park Dr Houston, TX | 2.0 | 2.0 | 1057 | $1,530 | $1.45 | 46d | 1 | 1.03mi |
| 3225 Woodland Park Dr Houston, TX | 2.0 | 2.0 | 925 | $1,276 | $1.38 | 46d | 1 | 1.06mi |
| 3225 Woodland Park Dr Unit 424 Houston, TX | 2.0 | 2.0 | 925 | $1,239 | $1.34 | 9d | 1 | 1.06mi |
| 3225 Woodland Park Dr Unit 3174 Houston, TX | 3.0 | 2.0 | 1268 | $1,875 | $1.48 | 1d | 1 | 1.06mi |
| 3225 Woodland Park Dr Unit 3282 Houston, TX | 2.0 | 2.0 | 925 | $1,274 | $1.38 | 14d | 1 | 1.06mi |
| 3225 Woodland Park Dr Unit 3258 Houston, TX | 3.0 | 2.0 | 1268 | $1,541 | $1.22 | 46d | 1 | 1.06mi |
| 3225 Woodland Park Dr Unit 3165 Houston, TX | 3.0 | 2.0 | 1268 | $1,875 | $1.48 | 0d | 1 | 1.06mi |
| 3225 Woodland Park Dr Unit 2162 Houston, TX | 2.0 | 2.0 | 925 | $1,239 | $1.34 | 7d | 1 | 1.06mi |
| 3225 Woodland Park Dr Unit 2174 Houston, TX | 2.0 | 2.0 | 925 | $1,274 | $1.38 | 12d | 1 | 1.06mi |
| 3225 Woodland Park Dr Unit 2148 Houston, TX | 2.0 | 2.0 | 925 | $1,264 | $1.37 | 1d | 1 | 1.06mi |
| 3225 Woodland Park Dr Unit 2112 Houston, TX | 2.0 | 2.0 | 925 | $1,274 | $1.38 | 0d | 1 | 1.06mi |
| 12655 W Houston Center Blvd Houston, TX | 1.0–3.0 | 1.0–2.5 | 1042 | $1,609 | $1.54 | 0d | 20 | 1.09mi |
| 3006 Woodland Park Dr Houston, TX | 2.0 | 2.0 | 946 | $1,250 | $1.32 | 26d | 1 | 1.14mi |
| 3000 Woodland Park Dr Houston, TX | 2.0 | 1.0–2.0 | 660 | $1,300 | $1.97 | 4d | 55 | 1.17mi |
| 1 FM 2611 Brazoria, TX | 1.0–3.0 | 1.0–2.0 | 999 | $1,520 | $1.52 | 0d | 31 | 1.18mi |
| 10881 Richmond Ave Unit 1209 Houston, TX | 2.0 | 2.0 | 885 | $1,130 | $1.28 | 26d | 1 | 1.20mi |
| 10881 Richmond Ave Unit 1004 Houston, TX | 2.0 | 2.0 | 885 | $1,170 | $1.32 | 26d | 1 | 1.20mi |
| 7006 Cook Rd Houston, TX | 2.0 | 2.0 | 965 | $1,255 | $1.30 | 46d | 1 | 1.23mi |
| 3411 Walnut Bend Ln Houston, TX | 1.0–3.0 | 1.0–2.0 | 962 | $1,408 | $1.46 | 1d | 13 | 1.23mi |
| 3131 Hayes Rd Houston, TX | 1.0–2.0 | 1.0–2.0 | 831 | $1,090 | $1.31 | 22d | 16 | 1.23mi |
| 3289 Walnut Bend Ln Houston, TX | 3.0 | 2.0 | 1249 | $1,700 | $1.36 | 46d | 1 | 1.24mi |
| 10887 Richmond Ave Houston, TX | 2.0 | 2.0 | 885 | $1,125 | $1.27 | 24d | 1 | 1.24mi |
| 10887 Richmond Ave Houston, TX | 2.0 | 2.0 | 885 | $1,125 | $1.27 | 46d | 1 | 1.24mi |
| 7000 Cook Rd Unit 2162 Houston, TX | 2.0 | 2.0 | 965 | $894 | $0.93 | 7d | 1 | 1.24mi |
| 7000 Cook Rd Unit 424 Houston, TX | 2.0 | 2.0 | 965 | $894 | $0.93 | 9d | 1 | 1.24mi |
| 7000 Cook Rd Unit 425 Houston, TX | 2.0 | 2.0 | 965 | $929 | $0.96 | 0d | 1 | 1.24mi |
| 7000 Cook Rd Unit 2165 Houston, TX | 2.0 | 2.0 | 965 | $919 | $0.95 | 1d | 1 | 1.24mi |
| 11805 Meadowglen Ln Houston, TX | 1.0–2.0 | 1.0–2.0 | 1002 | $2,258 | $2.25 | 7d | 29 | 1.27mi |
| 2909 Hayes Rd Houston, TX | 1.0–2.0 | 1.0–2.0 | 973 | $1,350 | $1.39 | 1d | 19 | 1.34mi |
| 6006 Rogerdale Rd Unit 3112 Houston, TX | 3.0 | 2.0 | 1175 | $1,442 | $1.23 | 0d | 1 | 1.36mi |
HOA detail condo
- Monthly dues
- $0 · $0/yr
- Likely covers
- security
- Assessments
- None detected in remarks — confirm with the listing agent.
Listing history 13 events
-
2026-06-22days on market $95,000 Active 18 DOM
-
2026-06-21days on market $95,000 Active 17 DOM
-
2026-06-18days on market $95,000 Active 14 DOM
-
2026-06-17days on market $95,000 Active 13 DOM
-
2026-06-16days on market $95,000 Active 12 DOM
-
2026-06-15days on market $95,000 Active 11 DOM
-
2026-06-13days on market $95,000 Active 9 DOM
-
2026-06-09days on market $95,000 Active 5 DOM
-
2026-06-08remarks 695-char remark
-
2026-06-08days on market $95,000 Active 4 DOM
-
2026-06-07days on market $95,000 Active 3 DOM
-
2026-06-04remarks 679-char remark
-
2026-06-04$95,000 Active 1 DOM
ⓘ Source: listings_history table (triggers on properties + properties_extension) + one-shot
backfill from property_details.listing_events for pre-trigger history.
Climate risk First Street
- Flood 5/10 Major FEMA zone AE · 59% chance over 30 yrs
- Wildfire 1/10 Low
- Heat 9/10 Extreme 7 d/yr ≥110°F today · 23 d/yr by 30 yrs out
- Wind 9/10 Extreme 99% chance of damaging wind over 30 yrs
- Air quality 2/10 Low 2 unhealthy d/yr today · 2 by 30 yrs out
Nearby sold comps map
Loading sold comps map…
Walkable amenities ~0.75 mi
Loading nearby amenities…
Taxation est. · year 1
- Rental income
- $17,251
- − Mortgage interest
- −$5,321
- − Property taxes
- −$1,425
- − Insurance
- −$5,594
- − Repairs & maintenance
- −$1,380
- − Management
- −$1,380
- − HOA
- −$6,060
- − Depreciation
- −$2,764
- Taxable loss
- −$6,672
- Est. tax savings @ 24.0%
- +$1,601
- After-tax cash flow
- $-3,827/yr
For passive investors: Depreciation is non-cash, so a rental often shows a tax loss while cash-flowing — sheltering income. Rental losses are passive: they offset passive income freely, and up to $25,000/yr can offset ordinary (W-2) income if you actively participate and your MAGI is under $100k (phasing out to $0 by $150k); unused losses carry forward. On sale, claimed depreciation is recaptured at up to 25%, and gains may owe capital-gains tax (a 1031 exchange can defer both). Figures are a year-1 estimate at your 24.0% rate — not tax advice; consult a CPA.
Condition & rehab AI · 11 photos
This 1,380 sq. ft. townhome in Houston's high-demand location is in good condition with minimal repairs needed. Painting and landscaping improvements can significantly enhance its value for both resale and rental.
Value-add opportunities
- Both Painting the exterior and interior walls — Fresh paint enhances curb appeal and interior aesthetics, attracting more buyers and renters.
- Both Landscaping improvements — A well-maintained yard and landscaping can increase the home's curb appeal and property value.
Renovation cost estimate screening
Value-add ROI direction
- Both Painting the exterior and interior walls — Fresh paint enhances curb appeal and interior aesthetics, attracting more buyers and renters. ↑
- Both Landscaping improvements — A well-maintained yard and landscaping can increase the home's curb appeal and property value. ↑
ⓘ Cost ranges are severity-bucket heuristics (US national rule-of-thumb). Get contractor quotes + a written scope before underwriting a rehab budget.
Schools (NCES district)
- District
- Alief ISD
- NCES district ID
- 4807830
- Math proficiency
- 23% ▼ -19.00%
- Reading proficiency
- 28% ▼ -8.00%
- Median HH income
- $37,775
- Composite
- 21.29/100
- National rank
- #8391
- State rank
- #717 of 826 in TX
Livability — Houston
- Score
- 74/100
- State rank
- #184
- US rank
- #4771
Category grades
Schools grade is shown separately in the Schools card above.
Census & demographics
- Census place
- Houston, TX
- County
- Harris County · 4,702,590 people
- City population
- 3,226,434
- Metro
- Houston-The Woodlands-Sugar Land, TX
- Population (ZIP)
- 57,108
- Household income
- $51,070
- Rent vs Own
- Severe rent burden
- 3500.0
Population outlook (Harris County) Hauer SSP2
- Today (2025)
- 5,571,493 people
- By 2030
- 6,089,821 · +9.3%
- By 2040
- 7,142,806 · +28.2%
- By 2050
- 8,185,864 · +46.9%
- By 2075
- 10,574,329 · +89.8%
- By 2100
- 12,109,958 · +117.4%
Race, ethnicity, and origin ACS 2023
- Neighborhood character
- Diverse neighborhood (Simpson 0.68)
- Race & ethnicity
- Hispanic / Latino 45% Asian 24% Black 23% Two or more races 19% White 5% Native American 2%
- Hispanic origin (detail)
- Mexican 24% Puerto Rican 2%
- Foreign-born
- 52% · Canada, Vietnam, China
- Languages at home
- 30% English-only · Spanish 40% Vietnamese 16% Chinese 3%
Political lean MEDSL · Harris
- 2024 margin
- Lean D (+5.5) · D 52.0% · R 46.4% · Other 1.6%
- 2008→2024 swing
- +3.9pp toward D · 2008: 1.6pp · 2024: 5.5pp
- All cycles
- 2024: D+5.5 2020: D+13.3 2016: D+12.4 2012: D+0.1 2008: D+1.6
Not yet ingested
- Civics
- —
Market trends
- HPI YoY
- ▼ -130.12%
- Current HPI
- 362.1985
- Rent YoY
- ▬ 0.05%
- Metro
- Houston-The Woodlands-Sugar Land, TX
- State GDP YoY
- ▲ 3.95%
- F500 in state
- 110
Industry mix (Fortune 500 HQ in TX)
| Industry | F500 HQs | Revenue |
|---|---|---|
| Energy | 16 | $1,198B |
|
||
| Technology | 5 | $198B |
|
||
| Engineering / Construction | 4 | $72B |
|
||
| Energy Services | 3 | $60B |
|
||
| Utilities | 3 | $41B |
|
||
| Healthcare | 2 | $330B |
|
||
Price history
1 event — show timeline
- 2026-06-04 Listed $95,000 ForSaleByOwner.com
Cash-flow waterfall
monthlySold comps — $/sqft
last 12 mo · ≤1 miLoading sold comps…