 Duplex
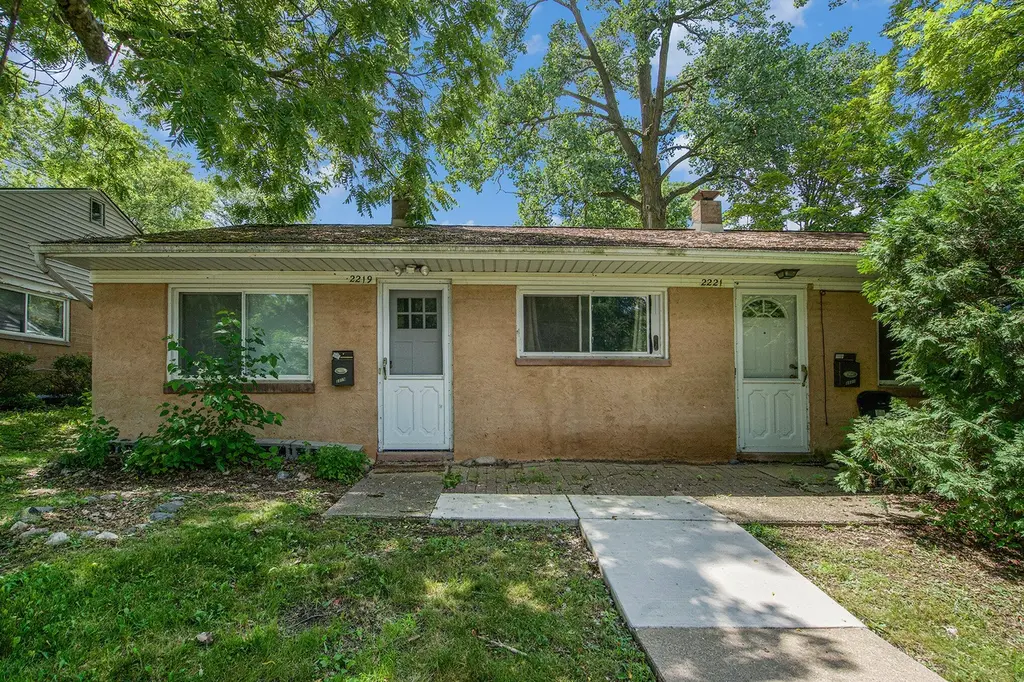
2219/2221 Dexter Ave · Ann Arbor, MI
Flood risk 1/10 · Minimal
- FEMA flood zone
- X (unshaded)
- Chance of flooding over 30 yrs
- 0.0%
- Est. flood insurance / yr
- $473 – $860
Fire risk 1/10 · Minimal
- Est. fire insurance / yr
- $784 – $1,456
Heat risk 3/10 · Minor
- Hot days now (above 98°F)
- 7 days/yr
- Hot days in 30 yrs
- 15 days/yr
Wind risk 2/10 · Minimal
- Chance of severe wind over 30 yrs
- —
Air-quality risk 2/10 · Minimal
- Unhealthy air days now
- 1 days/yr
- Unhealthy air days in 30 yrs
- 2 days/yr
Risk factors via First Street. Map © Google.
Why this score? — see what drove the C grade
The composite is a weighted blend of 9 inputs, each scored 0–100. Each bar is that input's sub-score; the figure is the points it added to the 100-point composite (weight × sub-score).
- Cash flow +16.1/30.0
- ARV discount +15.0/15.0
- Schools +6.5/10.0
- 1% rule +5.0/10.0
- DSCR +5.0/10.0
- Livability +4.4/5.0
- Rent growth +2.5/5.0
- Condition / age +2.5/5.0
- Appreciation +0.0/10.0
$375,000
🖨 Deal sheet 📄 Offer letter ✓ Due diligence
Multi-family units
County records classify this as Multi-Family (2-4 Unit). Listing-text estimate: 2 units. confirmed
Listing remarks MLS
Incredible turn-key investment opportunity within walking distance of downtown Ann Arbor and several parks and nature areas! This well-maintained duplex offers two 1-bedroom, 1-bathroom units, off-street parking, and a manageable yard. Each unit has its own living room and eat-in kitchen. Both units are rented for $1050/month to long-term tenants - 2219 Dexter until 7/31/2026 and 2221 Dexter until 6/30/2026. Landlord pays water/sewer. Tenants pay electric/gas and cable/internet. Certificate of Occupancy expires 9/14/2026. Quick to The Ride lines 31 and 34, which will take you to Maple Village Shopping Center and Plum Market to the west and downtown Ann Arbor to the east. Easy access to I-94 for commuters. 48-hour notice required for showings. Lots of possibilities and tons of potential -
Key facts
- Manageable yard
- Easy access to i-94
- Eat-in kitchen
Tags
Neighborhood map
What this means for you Summary
Snapshot
- This is a 2 × 1-bed/1-bath units multifamily listed at $375k.
Deal economics
- At list price, monthly cash flow is $190 ($2k/yr) — positive. Per door: $95/mo.
- The deal already cash-flows at list — no discount required.
- Meets the 1% rule at list price ($4k rent vs $375k).
- Recommended offer: $330k (12.0% below list) — sets the bar for market timing.
- Cap rate 6.9% vs local median 2.5% in Ann Arbor — top-decile yield for the area; either an underpriced asset or a hidden risk that comps aren't pricing in. Stress-test before assuming the spread holds.
Location & tenants
- Location reads 88/100 on livability (#10 in MI, #155 nationally) — a professional / high-income tenant draw. Strengths: schools A+, amenities A+, commute A+; Watch: cost of living D.
- Ann Arbor Public Schools (urban): math 71% / reading 81% proficiency, ranked #6 of 540 in MI (top 1%) — strong family-tenant draw, lease renewals of 3-5y typical.
- Market conditions: Rents flat; 228 active listings in the ZIP; 22 comparable units currently listed for rent nearby; rentals lingering (median 44d on market — plan ~5-8 weeks vacancy on turnover, expect pricing pressure); 50% of comp listings sitting > 30 days — soft ceiling on asking rent; high-income renter base; 996 units permitted in Washtenaw County in 2024 (492 in 5+ unit buildings).
- This rent runs 39% of the median local income ($116k/yr) — at the standard rent-burdened threshold; future hikes will face affordability resistance.
Forward outlook
- Local home prices are declining (-3.0%/yr); year-one equity from $3k of loan paydown is wiped out by about $11k of value loss. Plan a longer hold.
- Washtenaw County population projected at +25% by 2050 — long-run rental-demand tailwind backs the buy-and-hold thesis.
Negotiation context
- It's been on market 342 days — a 12% lower offer ($330k) is reasonable based on typical stale-listing flexibility.
- 12 sale attempts since 12y ago with the ask held roughly flat each time — persistent listings suggest the price (not the market) is what's stuck; bring a comps-based counter.
- Current owner paid $285k; 32% above their basis — modest negotiation headroom, anchor on the comps not their cost.
Risks & watch-outs
- Watch-outs: built in 1954 — expect roof / HVAC / electrical / plumbing capex.
Questions for the listing agent
- It's been on market 342 days. Have you received any prior offers? Is the seller open to a 12% concession, seller financing, or rate buy-down credit?
- Can we see the unit-by-unit rent roll, current vacancy, and any below-market leases? What's the average tenancy length?
- What capital expenditures (roof, boiler, parking lot, exteriors) have been made in the last 5 years, and what's planned in the next 2?
- Built in 1954 — when were the roof, HVAC, electrical panel, plumbing, and water heater last replaced?
- Why hasn't it sold? Are there any deal-killer items the seller is aware of (foundation, flood, title, zoning, code violations)?
- Is there a deadline driving the sale (1031 exchange, divorce, estate, relocation)? That informs how much negotiation room exists.
- Schools are A-rated — typically a magnet for longer-tenancy family renters. What's the average tenant stay here, and is there a school-zone premium baked into asking?
- What's the average days-on-market for RENTAL listings here right now (not sales)? A rising rental-DOM trend means longer vacancies and softer asking-rent achievability than the comps imply.
- What's the recent tenant-quality profile in this submarket — average credit score on applications, eviction rate, late-payment / NSF rate, and stable-employment percentage? A property-management company in the area should have these aggregated.
- How much new apartment / multifamily construction is in the pipeline within 1–3 miles? Heavy new supply (>2% of stock underway) typically softens rents 12–24 months out; light construction supports rent growth.
Investment metrics
- 1% rule
- 1.00% ✓
- Cap rate
- 6.90%
- Cash-on-cash
- 2.17%
- DSCR
- 1.10
- GRM
- 8.3
CMA / ARV
- ARV (median comp)
- $463,362
- List price
- $375,000
- Delta
- -19.07%
- Verdict
- UNDERPRICED
- Comps
- 16 within 1.0 mi
Projected returns pro-forma
-3.0% appreciation · 0.12% rent growth · sell at horizon
- IRR
- -16.3%
- Equity multiple
- 0.44×
- Total profit
- $-59,099
- Equity at exit
- $55,914
- IRR
- -14.8%
- Equity multiple
- 0.27×
- Total profit
- $-76,232
- Equity at exit
- $32,423
Cash invested: $105,000 (down + closing). Projections, not guarantees.
Landlord ↔ Tenant lean methodology
- Overall (STATE)
- 62 Landlord-Friendly
- State Michigan
- 62 Landlord-Friendly · EVEN
- County
- — inherits STATE
- City
- — inherits STATE
ZIP-level market 48103
- Rents YoY
- 0.1%
- Active inventory
- 228
- Price-to-rent
- 16.6×
Monthly cashflow live
- Estimated rent
- $3,761 high interval (Pro) →
- Mortgage (P&I)
- −$1,967
- Tax from tax record
- −$659 /mo · $7,903/yr
- Insurance
- −$156
- HOA
- −$0
- Vacancy / Maint / Mgmt
- −$790
- Net cashflow
- $190
Break-even live
2-unit breakdown (identical units grouped — click to expand)
| Units | Beds | Baths | Est. rent |
|---|---|---|---|
| 2× units | 1 | 1 | $3,762 |
| #1 | 1 | 1 | $1,881 |
| #2 | 1 | 1 | $1,881 |
| Total (2 units) | $3,761 | ||
UW: 25.0% down · 7.5% · 30yr · 1.5% tax · 5.0% vac · 8.0% maint · 8.0% mgmt
Financing live
Cash to close
- Down payment
- $93,750
- Closing costs
- $11,250
- Reserves months
- —
- Total cash needed
- —
Loan-product check · same deal, 3 products live
Conventional
25% down · 7.5% · 30yr
- Down + closing
- —
- Monthly P&I
- —
- Monthly cashflow
- —
- DSCR
- —
- Eligible?
- —
Personal DTI + credit; lowest rate.
DSCR
20% down · 8.5% · 30yr
- Down + closing
- —
- Monthly P&I
- —
- Monthly cashflow
- —
- DSCR
- —
- Eligible?
- —
No personal income docs; deal must DSCR.
Hard money
10% down · 12.0% · 12mo
- Down + closing
- —
- Monthly P&I
- —
- Monthly cashflow
- —
- DSCR
- —
- Eligible?
- —
Short-term bridge; refi at stabilization.
Rent comps 22 comps
| Address | Beds | Baths | Sqft | Rent | $/sqft | DOM | Units | Dist |
|---|---|---|---|---|---|---|---|---|
| 2319 Walter Dr Ann Arbor, MI | 3.0 | 1.5 | 1047 | $2,600 | $2.48 | 43d | 1 | 0.35mi |
| 1716 Jackson Ave Ann Arbor, MI | 2.0 | 1.0 | 950 | $2,500 | $2.63 | 43d | 1 | 0.36mi |
| 2546 Pamela Ave Ann Arbor, MI | 3.0 | 1.0 | 1050 | $2,300 | $2.19 | 43d | 1 | 0.61mi |
| 1730 W Liberty St Ann Arbor, MI | 3.0 | 1.5 | 1080 | $2,800 | $2.59 | 43d | 1 | 0.61mi |
| 714 Pomona Rd Ann Arbor, MI | 3.0 | 1.0 | 864 | $3,000 | $3.47 | 13d | 1 | 0.71mi |
| 1649 N Maple Rd Ann Arbor, MI | 1.0–2.0 | 1.0 | 942 | $1,995 | $2.12 | 12d | 1 | 0.95mi |
| 854 W Summerfield Glen Cir Unit 2 Ann Arbor, MI | 3.0 | 2.0 | 1412 | $2,200 | $1.56 | 43d | 1 | 1.04mi |
| 856 W Summerfield Glen Cir Unit 2 Ann Arbor, MI | 3.0 | 2.0 | 1412 | $2,200 | $1.56 | 43d | 1 | 1.04mi |
| 930 W Summerfield Glen Cir Ann Arbor, MI | 2.0 | 2.0 | 1227 | $1,900 | $1.55 | 43d | 1 | 1.06mi |
| 1980 Pauline Blvd Ann Arbor, MI | 1.0–2.0 | 1.0 | 718 | $1,549 | $2.16 | 43d | 6 | 1.07mi |
| 65 Westover St Ann Arbor, MI | 2.0 | 1.0 | 975 | $1,950 | $2.00 | 13d | 1 | 1.18mi |
| 2114 Pauline Blvd Unit 102 Ann Arbor, MI | 2.0 | 1.0 | 950 | $1,995 | $2.10 | 43d | 1 | 1.20mi |
| 315 2nd St #305 Ann Arbor, MI | 1.0 | 1.0 | 807 | $2,995 | $3.71 | 43d | 1 | 1.26mi |
| 2845 Sagebrush Cir Ann Arbor, MI | 1.0–3.0 | 1.0–2.0 | 964 | $1,949 | $2.02 | 13d | 5 | 1.26mi |
| 311 W William St Unit 2 Ann Arbor, MI | 3.0 | 1.0 | 1200 | $2,700 | $2.25 | 21d | 1 | 1.26mi |
| 2150 Pauline Blvd #203 Ann Arbor, MI | 2.0 | 2.0 | 1173 | $1,500 | $1.28 | 21d | 1 | 1.27mi |
| 201 S 1st St Unit 1364138P Ann Arbor, MI | 2.0 | 2.0 | 1097 | $4,493 | $4.10 | 13d | 1 | 1.27mi |
| 111 N Ashley St Ann Arbor, MI | 1.0–2.0 | 1.0–2.0 | 803 | $4,000 | $4.98 | 43d | 3 | 1.29mi |
| 441 S 1st St Ann Arbor, MI | 2.0–3.0 | 1.0–1.5 | 1000 | $2,235 | $2.23 | 21d | 5 | 1.34mi |
| 212 S 4th Ave Ann Arbor, MI | 1.0–2.0 | 1.0–2.0 | 850 | $3,167 | $3.73 | 13d | 1 | 1.43mi |
| 1137 S 7th St Ann Arbor, MI | 2.0 | 1.0 | 725 | $3,250 | $4.48 | 13d | 1 | 1.47mi |
| 618 S Main St Ann Arbor, MI | 2.0 | 1.0–2.0 | 740 | $3,550 | $4.80 | 13d | 33 | 1.49mi |
Listing history 47 events
-
2026-06-18days on market $375,000 Active 342 DOM
-
2026-06-17days on market $375,000 Active 341 DOM
-
2026-06-16days on market $375,000 Active 340 DOM
-
2026-06-15days on market $375,000 Active 339 DOM
-
2026-06-14days on market $375,000 Active 337 DOM
-
2026-06-10days on market $375,000 Active 334 DOM
-
2026-06-09days on market $375,000 Active 333 DOM
-
2026-06-08days on market $375,000 Active 332 DOM
-
2026-06-07days on market $375,000 Active 331 DOM
-
2026-06-03days on market $375,000 Active 327 DOM
-
2026-06-02days on market $375,000 Active 326 DOM
-
2026-06-01days on market $375,000 Active 325 DOM
-
2026-05-31days on market $375,000 Active 324 DOM
-
2026-05-30days on market $375,000 Active 323 DOM
-
2025-07-11$375,000 Active 798-char remark
Show marketing remark (918 chars)
Incredible turn-key investment opportunity within walking distance of downtown Ann Arbor and several parks and nature areas! This well-maintained duplex offers two 1-bedroom, 1-bathroom units, off-street parking, and a manageable yard. Each unit has its own living room and eat-in kitchen. Both units are rented for $1050/month to long-term tenants - 2219 Dexter until 7/31/2026 and 2221 Dexter until 6/30/2026. Landlord pays water/sewer. Tenants pay electric/gas and cable/internet. Certificate of Occupancy expires 9/14/2026. Quick to The Ride lines 31 and 34, which will take you to Maple Village Shopping Center and Plum Market to the west and downtown Ann Arbor to the east. Easy access to I-94 for commuters. 48-hour notice required for showings. Lots of possibilities and tons of potential -don't miss this one! Sale is subject to tenants' rights. Home Energy Score of 3. Download report at osi. a2gov.org/herd.
-
2025-07-11$375,000 Active 918-char remark
Show marketing remark (918 chars)
Incredible turn-key investment opportunity within walking distance of downtown Ann Arbor and several parks and nature areas! This well-maintained duplex offers two 1-bedroom, 1-bathroom units, off-street parking, and a manageable yard. Each unit has its own living room and eat-in kitchen. Both units are rented for $1050/month to long-term tenants - 2219 Dexter until 7/31/2026 and 2221 Dexter until 6/30/2026. Landlord pays water/sewer. Tenants pay electric/gas and cable/internet. Certificate of Occupancy expires 9/14/2026. Quick to The Ride lines 31 and 34, which will take you to Maple Village Shopping Center and Plum Market to the west and downtown Ann Arbor to the east. Easy access to I-94 for commuters. 48-hour notice required for showings. Lots of possibilities and tons of potential -don't miss this one! Sale is subject to tenants' rights. Home Energy Score of 3. Download report at osi. a2gov.org/herd.
-
2023-05-25soldstatus $285,000
-
2023-05-24soldstatus $285,000 Sold
-
2023-05-24soldstatus $285,000 Closed
-
2023-05-24soldstatus $285,000
-
2023-05-24soldstatus $285,000
-
2023-05-24soldstatus $285,000
-
2023-04-16historical Accepting Backup Offers
-
2023-04-16historical Active - Contingent
-
2023-04-10price $290,000
-
2023-04-10price $290,000
-
2023-02-16status Active
-
2023-02-16status Active
-
2023-02-13historical Accepting Backup Offers
-
2023-02-13historical Active - Contingent
-
2022-12-16$299,000 Active
-
2022-12-16$299,000 Active
-
2022-12-14historical $299,000
-
2022-12-14historical $299,000
-
2022-12-14$290,000
-
2022-12-14$290,000
-
2022-12-14$290,000
-
2015-10-02soldstatus $170,000
-
2015-09-25soldstatus $170,000 Sold
-
2015-09-25soldstatus $170,000
-
2015-08-20historical
-
2015-08-20historical
-
2015-08-06$180,000 Active
-
2015-08-06$180,000
-
2014-06-03historical
-
2014-03-27$172,000
-
1999-09-01soldstatus $45,000
ⓘ Source: listings_history table (triggers on properties + properties_extension) + one-shot
backfill from property_details.listing_events for pre-trigger history.
Tax reassessment forecast MI · Partial reset (capped growth)
- Current annual tax
- $7,903 · $659/mo
- Projected year-2 tax
- $7,903 · $659/mo
- Expected delta
- $0/yr ($0/mo · 0.0%)
ⓘ Screening estimate from a state-policy table — verify with the county assessor before closing.
Climate risk First Street
- Flood 1/10 Low FEMA zone X (unshaded) · 0% chance over 30 yrs
- Wildfire 1/10 Low
- Heat 3/10 Moderate 7 d/yr ≥98°F today · 15 d/yr by 30 yrs out
- Wind 2/10 Low
- Air quality 2/10 Low 1 unhealthy d/yr today · 2 by 30 yrs out
Nearby sold comps map
Loading sold comps map…
Walkable amenities ~0.75 mi
Loading nearby amenities…
Taxation est. · year 1
- Rental income
- $45,132
- − Mortgage interest
- −$21,006
- − Property taxes
- −$7,903
- − Insurance
- −$1,875
- − Repairs & maintenance
- −$3,611
- − Management
- −$3,611
- − Depreciation
- −$10,909
- Taxable loss
- −$3,783
- Est. tax savings @ 24.0%
- +$908
- After-tax cash flow
- $3,185/yr
For passive investors: Depreciation is non-cash, so a rental often shows a tax loss while cash-flowing — sheltering income. Rental losses are passive: they offset passive income freely, and up to $25,000/yr can offset ordinary (W-2) income if you actively participate and your MAGI is under $100k (phasing out to $0 by $150k); unused losses carry forward. On sale, claimed depreciation is recaptured at up to 25%, and gains may owe capital-gains tax (a 1031 exchange can defer both). Figures are a year-1 estimate at your 24.0% rate — not tax advice; consult a CPA.
Schools (NCES district)
- District
- Ann Arbor Public Schools
- NCES district ID
- 2602820
- Math proficiency
- 71% ▲ 5.00%
- Reading proficiency
- 81% ▲ 11.00%
- Median HH income
- $60,768
- Composite
- 65.34/100
- National rank
- #487
- State rank
- #6 of 540 in MI
Livability — Ann Arbor
- Score
- 88/100
- State rank
- #10
- US rank
- #155
Category grades
Schools grade is shown separately in the Schools card above.
Census & demographics
- Census place
- Ann Arbor, MI
- County
- Washtenaw County · 306,860 people
- City population
- 163,747
- Metro
- Ann Arbor, MI
- Population (ZIP)
- 55,054
- Household income
- $116,194
- Rent vs Own
- Severe rent burden
- 2033.0
Population outlook (Washtenaw County) Hauer SSP2
- Today (2025)
- 402,878 people
- By 2030
- 424,104 · +5.3%
- By 2040
- 464,633 · +15.3%
- By 2050
- 504,728 · +25.3%
- By 2075
- 614,463 · +52.5%
- By 2100
- 676,181 · +67.8%
Race, ethnicity, and origin ACS 2023
- Neighborhood character
- Predominantly White (70%)
- Race & ethnicity
- White 70% Asian 10% Two or more races 9% Hispanic / Latino 6% Black 6%
- Hispanic origin (detail)
- Mexican 2%
- Common ancestry
- Romanian 6% Slovak 3% Iranian 3%
- Foreign-born
- 13% · Canada, China, South Korea
- Languages at home
- 83% English-only · Spanish 4% Chinese 3% Other Indo-European 2%
Political lean MEDSL · Washtenaw
- 2024 margin
- Solid D (+44.4) · D 71.0% · R 26.6% · Other 2.4%
- 2008→2024 swing
- +3.5pp toward D · 2008: 41.0pp · 2024: 44.4pp
- All cycles
- 2024: D+44.4 2020: D+46.6 2016: D+41.5 2012: D+36.0 2008: D+41.0
Not yet ingested
- Civics
- —
Market trends
- HPI YoY
- ▼ -472.49%
- Current HPI
- 244.6891
- Rent YoY
- ▲ 0.12%
- Metro
- Ann Arbor, MI
- State GDP YoY
- ▲ 1.37%
- F500 in state
- 28
Industry mix (Fortune 500 HQ in MI)
| Industry | F500 HQs | Revenue |
|---|---|---|
| Automotive Parts | 3 | $48B |
|
||
| Automotive | 2 | $372B |
|
||
| Chemicals | 1 | $45B |
|
||
| Automotive Retail | 1 | $29B |
|
||
| Healthcare / Medical Devices | 1 | $23B |
|
||
| Automotive Technology | 1 | $20B |
|
||
Price history
+733.3% since first listed33 events — show timeline
- 2025-07-11 Listed $375,000 REALCOMP
- 2025-07-11 Listed $375,000 MiRealSource-MiMLS
- 2023-05-25 Sold (Public Records) $285,000 Public Records
- 2023-05-24 Sold (MLS) $285,000 REALCOMP
- 2023-05-24 Sold (MLS) $285,000 MiRealSource-MiMLS
- 2023-05-24 Sold (MLS) $285,000 SW Michigan MLS
- 2023-05-24 Sold (MLS) $285,000 MiRealSource-MiMLS
- 2023-05-24 Sold (MLS) $285,000 AAMLS
- 2023-04-16 Contingent — MiRealSource-MiMLS
- 2023-04-16 Contingent — AAMLS
- 2023-04-10 Price Changed $290,000 MiRealSource-MiMLS
- 2023-04-10 Price Changed $290,000 AAMLS
- 2023-02-16 Relisted — MiRealSource-MiMLS
- 2023-02-16 Relisted — AAMLS
- 2023-02-13 Contingent — MiRealSource-MiMLS
- 2023-02-13 Contingent — AAMLS
- 2022-12-16 Listed $299,000 MiRealSource-MiMLS
- 2022-12-16 Listed $299,000 AAMLS
- 2022-12-14 Coming Soon $299,000 MiRealSource-MiMLS
- 2022-12-14 Coming Soon $299,000 AAMLS
- 2022-12-14 Listed $290,000 REALCOMP
- 2022-12-14 Listed $290,000 MiRealSource-MiMLS
- 2022-12-14 Listed $290,000 SW Michigan MLS
- 2015-10-02 Sold (Public Records) $170,000 Public Records
- 2015-09-25 Sold (MLS) $170,000 MiRealSource-MiMLS
- 2015-09-25 Sold (MLS) $170,000 REALCOMP
- 2015-08-20 Listing Removed — REALCOMP
- 2015-08-20 Listing Removed — MiRealSource-MiMLS
- 2015-08-06 Listed $180,000 REALCOMP
- 2015-08-06 Listed $180,000 MiRealSource-MiMLS
- 2014-06-03 Listing Removed — MiRealSource-MiMLS
- 2014-03-27 Listed $172,000 MiRealSource-MiMLS
- 1999-09-01 Sold (Public Records) $45,000 Public Records
Property tax history
+7.7%/yrLatest (2025): $7,903 · -20.3% YoY. Source: county tax records.
Cash-flow waterfall
monthlySold comps — $/sqft
last 12 mo · ≤1 miLoading sold comps…