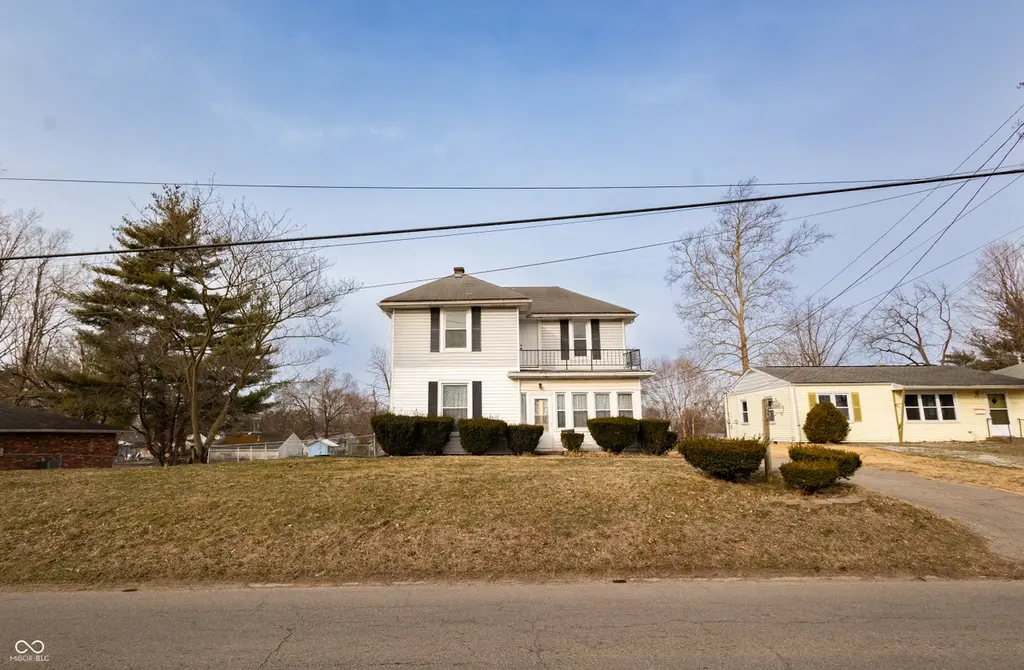
636 S Obrien St · Seymour, IN
Flood risk 1/10 · Minimal
- FEMA flood zone
- X (unshaded)
- Chance of flooding over 30 yrs
- 0.0%
- Est. flood insurance / yr
- $473 – $860
Fire risk 1/10 · Minimal
- Est. fire insurance / yr
- $717 – $1,331
Heat risk 4/10 · Minor
- Hot days now (above 103°F)
- 7 days/yr
- Hot days in 30 yrs
- 19 days/yr
Wind risk 2/10 · Minimal
- Chance of severe wind over 30 yrs
- 1.0%
Air-quality risk 1/10 · Minimal
- Unhealthy air days now
- 0 days/yr
- Unhealthy air days in 30 yrs
- 0 days/yr
Risk factors via First Street. Map © Google.
Why this score? — see what drove the C+ grade
The composite is a weighted blend of 9 inputs, each scored 0–100. Each bar is that input's sub-score; the figure is the points it added to the 100-point composite (weight × sub-score).
- Cash flow +22.0/30.0
- ARV discount +15.0/15.0
- DSCR +7.0/10.0
- 1% rule +6.2/10.0
- Livability +3.4/5.0
- Schools +2.6/10.0
- Rent growth +2.5/5.0
- Condition / age +2.5/5.0
- Appreciation +0.0/10.0
$147,400
🖨 Deal sheet (PDF) 📄 Offer letter ✓ Due diligence
Listing remarks MLS
This character-filled home, built in 1875, offers timeless charm and incredible potential. From the moment you step into the formal foyer, you'll appreciate the generous living spaces designed for both everyday comfort and entertaining. The spacious family room provides plenty of room to gather, and with four bedrooms and one and a half bathrooms, there's flexibility for a variety of living arrangements. With 1,792 finished square feet plus an unfinished basement, the home offers abundant space and opportunity to customize to your needs. Out back, the yard invites you to imagine summer evenings by the pool and creating your own private retreat. This property is ready for its next chapter and offers a wonderful opportunity to blend historic character with modern updates. Being sold as-is, it presents the perfect chance for buyers looking to build equity and bring their vision to life.
Key facts
- Unfinished basement
- Formal foyer
- Private retreat
Tags
Neighborhood map
What this means for you Summary
Snapshot
- This is a 4-bed/1.5-bath single-family listed at $147k.
Deal economics
- At list price, monthly cash flow is $235 ($3k/yr) — positive.
- The deal already cash-flows at list — no discount required.
- Meets the 1% rule at list price ($2k rent vs $147k).
- Recommended offer: $134k (9.0% below list) — sets the bar for market timing.
- Cap rate 8.2% vs local median 3.5% in Seymour — top-decile yield for the area; either an underpriced asset or a hidden risk that comps aren't pricing in. Stress-test before assuming the spread holds.
Location & tenants
- Location reads 68/100 on livability (#211 in IN) — a middle-class / working-renter tenant base. Strengths: crime A+, cost of living A+, housing A+; Watch: schools C-, employment D+, health & safety D.
- Seymour Community Schools (town): math 27% / reading 33% proficiency, ranked #239 of 301 in IN (top 79%) — families likely to look elsewhere, expect single-tenant / working-renter base with shorter leases.
- Market conditions: 245 active listings in the ZIP; 101 units permitted in Jackson County in 2024 (0 in 5+ unit buildings).
Forward outlook
- Local home prices are declining (-3.0%/yr); year-one equity from $1k of loan paydown is wiped out by about $4k of value loss. Plan a longer hold.
- Jackson County population projected at +7% by 2050 — modest demand growth; plan on rents tracking national, not racing it.
Negotiation context
- It's been on market 114 days — a 9% lower offer ($134k) is reasonable based on typical stale-listing flexibility.
Risks & watch-outs
- Watch-outs: built in 1875 — expect roof / HVAC / electrical / plumbing capex.
Questions for the listing agent
- It's been on market 114 days. Have you received any prior offers? Is the seller open to a 9% concession, seller financing, or rate buy-down credit?
- Built in 1875 — when were the roof, HVAC, electrical panel, plumbing, and water heater last replaced?
- Why hasn't it sold? Are there any deal-killer items the seller is aware of (foundation, flood, title, zoning, code violations)?
- Is there a deadline driving the sale (1031 exchange, divorce, estate, relocation)? That informs how much negotiation room exists.
- What's the average days-on-market for RENTAL listings here right now (not sales)? A rising rental-DOM trend means longer vacancies and softer asking-rent achievability than the comps imply.
- What's the recent tenant-quality profile in this submarket — average credit score on applications, eviction rate, late-payment / NSF rate, and stable-employment percentage? A property-management company in the area should have these aggregated.
- How much new for-sale + rental construction is in the pipeline within 1–3 miles? Heavy new supply typically softens prices + rents 12–24 months out; constrained supply supports both.
Investment metrics
- 1% rule
- 1.12% ✓
- Cap rate
- 8.21%
- Cash-on-cash
- 6.84%
- DSCR
- 1.30
- GRM
- 7.5
CMA / ARV
- ARV (median comp)
- $214,536
- List price
- $147,400
- Delta
- -31.29%
- Verdict
- UNDERPRICED
- Comps
- 20 within 1.0 mi
Show comp detail 11 sales within ~0.75 mi
| Address | Dist | Beds/Ba | Sqft | Sold | Price | $/sf | Match |
|---|---|---|---|---|---|---|---|
| 821 Phillips Ln | 0.20mi | 4/2.0 | 1,824 (+2%) | 13mo | $232,900 | $128 | 74 |
| 328 E Laurel St | 0.15mi | 3/1.0 (-1) | 1,952 (+9%) | 9mo | $174,000 | $89 | 64 |
| 226 N Park Dr | 0.39mi | 3/2.0 (-1) | 1,740 (-3%) | 11mo | $239,900 | $138 | 60 |
| 701 S Sycamore Rd | 0.75mi | 3/2.5 (-1) | 1,768 (-1%) | 3mo | $155,000 | $88 | 52 |
| 725 S Sycamore Rd | 0.75mi | 3/2.0 (-1) | 1,787 (-0%) | 9mo | $260,000 | $145 | 50 |
| 728 S Sycamore Rd | 0.72mi | 3/2.5 (-1) | 1,784 (-0%) | 8mo | $270,000 | $151 | 50 |
| 802 S Walnut St | 0.50mi | 3/1.5 (-1) | 1,574 (-12%) | 8mo | $172,000 | $109 | 45 |
| 221 W Harrison Dr | 0.55mi | 3/1.0 (-1) | 1,541 (-14%) | 8mo | $190,000 | $123 | 38 |
| 1305 Gaiser Dr | 0.56mi | 3/2.0 (-1) | 1,566 (-13%) | 11mo | $209,000 | $133 | 36 |
| 719 E 2nd St | 0.71mi | 3/2.0 (-1) | 1,997 (+11%) | 7mo | $205,000 | $103 | 35 |
| 414 E 3rd St | 0.70mi | 3/2.0 (-1) | 1,616 (-10%) | 22mo | $209,000 | $129 | 26 |
Match score weights: distance 35% · size 25% · config 20% · recency 20%. Top-matched comps best support the ARV.
Projected returns pro-forma
-3.0% appreciation · 3.0% rent growth · sell at horizon
- IRR
- -5.8%
- Equity multiple
- 0.79×
- Total profit
- $-8,852
- Equity at exit
- $21,978
- IRR
- 3.9%
- Equity multiple
- 1.29×
- Total profit
- $11,801
- Equity at exit
- $12,744
Cash invested: $41,272 (down + closing). Projections, not guarantees.
Landlord ↔ Tenant lean methodology
- Overall (STATE)
- 90 Strongly Landlord-Friendly
- State Indiana
- 90 Strongly Landlord-Friendly · R+11
- County
- — inherits STATE
- City
- — inherits STATE
ZIP-level market 47274
- Active inventory
- 245
- Price-to-rent
- 7.5×
Monthly cashflow live
- Estimated rent
- $1,648 medium interval (Pro) →
- Mortgage (P&I)
- −$773
- Tax from tax record
- −$232 /mo · $2,788/yr
- Insurance
- −$61
- HOA
- −$0
- Vacancy / Maint / Mgmt
- −$346
- Net cashflow
- $235
Break-even live
Sensitivity live
| Price | -10% $319 | -5% $277 | +0% $235 | +5% $193 | +10% $152 |
|---|---|---|---|---|---|
| Rent | -10% $105 | -5% $170 | +0% $235 | +5% $300 | +10% $365 |
| Rate | -1.0pp $309 | -0.5pp $273 | base $235 | +0.5pp $197 | +1.0pp $158 |
UW: 25.0% down · 7.5% · 30yr · 1.5% tax · 5.0% vac · 8.0% maint · 8.0% mgmt
Financing live
Cash to close
- Down payment
- $36,850
- Closing costs
- $4,422
- Reserves months
- —
- Total cash needed
- —
Loan-product check · same deal, 3 products live
Conventional
25% down · 7.5% · 30yr
- Down + closing
- —
- Monthly P&I
- —
- Monthly cashflow
- —
- DSCR
- —
- Eligible?
- —
Personal DTI + credit; lowest rate.
DSCR
20% down · 8.5% · 30yr
- Down + closing
- —
- Monthly P&I
- —
- Monthly cashflow
- —
- DSCR
- —
- Eligible?
- —
No personal income docs; deal must DSCR.
Hard money
10% down · 12.0% · 12mo
- Down + closing
- —
- Monthly P&I
- —
- Monthly cashflow
- —
- DSCR
- —
- Eligible?
- —
Short-term bridge; refi at stabilization.
Listing history 20 events
-
2026-06-19days on market $147,400 Active 114 DOM
-
2026-06-18days on market $147,400 Active 113 DOM
-
2026-06-17days on market $147,400 Active 112 DOM
-
2026-06-16days on market $147,400 Active 111 DOM
-
2026-06-15days on market $147,400 Active 110 DOM
-
2026-06-14days on market $147,400 Active 108 DOM
-
2026-06-13days on market $147,400 Active 107 DOM
-
2026-06-10days on market $147,400 Active 105 DOM
-
2026-06-09days on market $147,400 Active 104 DOM
-
2026-06-08days on market $147,400 Active 103 DOM
-
2026-06-07days on market $147,400 Active 102 DOM
-
2026-06-05days on market $147,400 Active 99 DOM
-
2026-06-03days on market $147,400 Active 98 DOM
-
2026-06-02days on market $147,400 Active 97 DOM
-
2026-06-01days on market $147,400 Active 96 DOM
-
2026-05-31days on market $147,400 Active 95 DOM
-
2026-05-30days on market $147,400 Active 94 DOM
-
2026-05-12price $147,400 896-char remark
Show marketing remark (896 chars)
This character-filled home, built in 1875, offers timeless charm and incredible potential. From the moment you step into the formal foyer, you'll appreciate the generous living spaces designed for both everyday comfort and entertaining. The spacious family room provides plenty of room to gather, and with four bedrooms and one and a half bathrooms, there's flexibility for a variety of living arrangements. With 1,792 finished square feet plus an unfinished basement, the home offers abundant space and opportunity to customize to your needs. Out back, the yard invites you to imagine summer evenings by the pool and creating your own private retreat. This property is ready for its next chapter and offers a wonderful opportunity to blend historic character with modern updates. Being sold as-is, it presents the perfect chance for buyers looking to build equity and bring their vision to life.
-
2026-03-22price $162,400 896-char remark
Show marketing remark (896 chars)
This character-filled home, built in 1875, offers timeless charm and incredible potential. From the moment you step into the formal foyer, you'll appreciate the generous living spaces designed for both everyday comfort and entertaining. The spacious family room provides plenty of room to gather, and with four bedrooms and one and a half bathrooms, there's flexibility for a variety of living arrangements. With 1,792 finished square feet plus an unfinished basement, the home offers abundant space and opportunity to customize to your needs. Out back, the yard invites you to imagine summer evenings by the pool and creating your own private retreat. This property is ready for its next chapter and offers a wonderful opportunity to blend historic character with modern updates. Being sold as-is, it presents the perfect chance for buyers looking to build equity and bring their vision to life.
-
2026-02-25$172,400 Active 896-char remark
Show marketing remark (896 chars)
This character-filled home, built in 1875, offers timeless charm and incredible potential. From the moment you step into the formal foyer, you'll appreciate the generous living spaces designed for both everyday comfort and entertaining. The spacious family room provides plenty of room to gather, and with four bedrooms and one and a half bathrooms, there's flexibility for a variety of living arrangements. With 1,792 finished square feet plus an unfinished basement, the home offers abundant space and opportunity to customize to your needs. Out back, the yard invites you to imagine summer evenings by the pool and creating your own private retreat. This property is ready for its next chapter and offers a wonderful opportunity to blend historic character with modern updates. Being sold as-is, it presents the perfect chance for buyers looking to build equity and bring their vision to life.
ⓘ Source: listings_history table (triggers on properties + properties_extension) + one-shot
backfill from property_details.listing_events for pre-trigger history.
Tax reassessment forecast IN · Partial reset (capped growth)
- Current annual tax
- $2,788 · $232/mo
- Projected year-2 tax
- $2,788 · $232/mo
- Expected delta
- $0/yr ($0/mo · 0.0%)
ⓘ Screening estimate from a state-policy table — verify with the county assessor before closing.
Climate risk First Street
- Flood 1/10 Low FEMA zone X (unshaded) · 0% chance over 30 yrs
- Wildfire 1/10 Low
- Heat 4/10 Moderate 7 d/yr ≥103°F today · 19 d/yr by 30 yrs out
- Wind 2/10 Low 100% chance of damaging wind over 30 yrs
- Air quality 1/10 Low 0 unhealthy d/yr today · 0 by 30 yrs out
Nearby sold comps map
Loading sold comps map…
Walkable amenities ~0.75 mi
Loading nearby amenities…
Taxation est. · year 1
- Rental income
- $19,776
- − Mortgage interest
- −$8,257
- − Property taxes
- −$2,788
- − Insurance
- −$737
- − Repairs & maintenance
- −$1,582
- − Management
- −$1,582
- − Depreciation
- −$4,288
- Taxable income
- $542
- Est. tax owed @ 24.0%
- −$130
- After-tax cash flow
- $2,692/yr
For passive investors: Depreciation is non-cash, so a rental often shows a tax loss while cash-flowing — sheltering income. Rental losses are passive: they offset passive income freely, and up to $25,000/yr can offset ordinary (W-2) income if you actively participate and your MAGI is under $100k (phasing out to $0 by $150k); unused losses carry forward. On sale, claimed depreciation is recaptured at up to 25%, and gains may owe capital-gains tax (a 1031 exchange can defer both). Figures are a year-1 estimate at your 24.0% rate — not tax advice; consult a CPA.
Schools (NCES district)
- District
- Seymour Community Schools
- NCES district ID
- 1810080
- Math proficiency
- 27% ▼ -10.00%
- Reading proficiency
- 33% ▼ -9.00%
- Median HH income
- $46,122
- Composite
- 25.81/100
- National rank
- #7362
- State rank
- #239 of 301 in IN
Livability — Seymour
- Score
- 68/100
- State rank
- #211
- US rank
- #9328
Category grades
Schools grade is shown separately in the Schools card above.
Census & demographics
- Census place
- Seymour, IN
- County
- Jackson County · 33,068 people
- City population
- 33,068
- Metro
- Seymour, IN
- Population (ZIP)
- 33,068
- Household income
- $71,457
- Rent vs Own
- Severe rent burden
- 453.0
Population outlook (Jackson County) Hauer SSP2
- Today (2025)
- 46,376 people
- By 2030
- 47,344 · +2.1%
- By 2040
- 48,936 · +5.5%
- By 2050
- 49,738 · +7.2%
- By 2075
- 50,435 · +8.8%
- By 2100
- 46,321 · -0.1%
Race, ethnicity, and origin ACS 2023
- Neighborhood character
- Predominantly White (74%)
- Race & ethnicity
- White 74% Hispanic / Latino 18% Two or more races 12% Asian 3% Black 1% Native American 1%
- Hispanic origin (detail)
- Mexican 10% Puerto Rican 2%
- Common ancestry
- Slovak 2% Romanian 2% Iranian 1%
- Foreign-born
- 11% · Canada
- Languages at home
- 85% English-only · Spanish 12% Other Asian/Pacific 2% Other Indo-European 1%
Political lean MEDSL · Jackson
- 2024 margin
- Solid R (+55.3) · D 21.5% · R 76.8% · Other 1.7%
- 2008→2024 swing
- -41.6pp toward R · 2008: -13.7pp · 2024: -55.3pp
- All cycles
- 2024: R+55.3 2020: R+53.3 2016: R+51.4 2012: R+27.4 2008: R+13.7
Not yet ingested
- Civics
- —
Market trends
- HPI YoY
- ▼ -146.47%
- Current HPI
- 211.9507
- Rent YoY
- —
- Metro
- Seymour, IN
- State GDP YoY
- ▲ 2.90%
- F500 in state
- 18
Industry mix (Fortune 500 HQ in IN)
| Industry | F500 HQs | Revenue |
|---|---|---|
| Industrial Machinery | 2 | $37B |
|
||
| Healthcare | 1 | $177B |
|
||
| Pharmaceuticals | 1 | $45B |
|
||
| Metals / Steel | 1 | $18B |
|
||
| Agriculture | 1 | $17B |
|
||
| Packaging | 1 | $12B |
|
||
Price history
-14.5% since first listed3 events — show timeline
- 2026-05-12 Price Changed $147,400 MIBOR as Distributed by MLS Grid
- 2026-03-22 Price Changed $162,400 MIBOR as Distributed by MLS Grid
- 2026-02-25 Listed $172,400 MIBOR as Distributed by MLS Grid
Property tax history
+10.4%/yrLatest (2024): $2,788 · +5.0% YoY. Source: county tax records.
Cash-flow waterfall
monthlySold comps — $/sqft
last 12 mo · ≤1 miLoading sold comps…