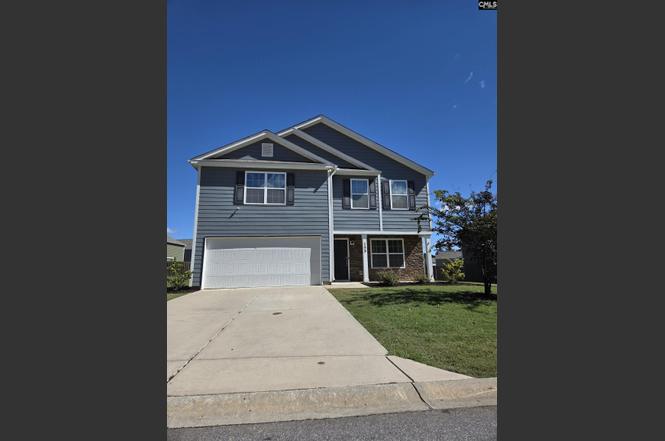
153 Rushton Dr · Lake Murray of Richland, SC
Flood risk No data
- FEMA flood zone
- —
- Chance of flooding over 30 yrs
- —
- Est. flood insurance / yr
- —
Fire risk No data
- Est. fire insurance / yr
- —
Heat risk No data
- Hot days now (above threshold)
- —
- Hot days in 30 yrs
- —
Wind risk No data
- Chance of severe wind over 30 yrs
- —
Air-quality risk No data
- Unhealthy air days now
- —
- Unhealthy air days in 30 yrs
- —
Risk factors via First Street. Map © Google.
Why this score? — see what drove the C- grade
The composite is a weighted blend of 9 inputs, each scored 0–100. Each bar is that input's sub-score; the figure is the points it added to the 100-point composite (weight × sub-score).
- Cash flow +18.4/30.0
- ARV discount +10.4/15.0
- DSCR +5.8/10.0
- Schools +4.5/10.0
- 1% rule +4.3/10.0
- Livability +3.4/5.0
- Rent growth +2.5/5.0
- Condition / age +2.5/5.0
- Appreciation +0.0/10.0
$309,500
🖨 Deal sheet 📄 Offer letter ✓ Due diligence
Listing remarks
Welcome to a beautiful place you’ll love to call home!Located in a wonderful community known for its excellent schools, this charming home offers both comfort and character. The upgraded owner’s suite feels like a retreat, featuring a cozy electric fireplace and elegant built-in cabinets. Enjoy peaceful living with nearby conveniences and a friendly neighborhood atmosphere — perfect for family and friends. Disclaimer: CMLS has not reviewed and, therefore, does not endorse vendors who may appear in listings. Disclaimer: CMLS has not reviewed and, therefore, does not endorse vendors who may appear in listings.
Key facts
- Built-in cabinets
- Owner's suite
- Electric fireplace
Tags
Property features AI
Finance
- HOA & community: Has homeowners association
Exterior
- Parking: Attached 2-car garage
- Utilities: Public water; Public sewer
- Home design: Attached garage; 2-car garage
- Construction: Slab foundation
- Exterior features: Vinyl exterior; Paved road access; Lot approximately 0.26 acre; Lot number 56
Interior
- Bedrooms: Master bedroom on the second level; Additional bedrooms on the second level
- Bathrooms: Two full bathrooms; One half bathroom
- Heating & cooling: Central heating; Central air conditioning
- Interior features: One fireplace; Dining room on the main level
Neighborhood map
What this means for you Summary
Snapshot
- This is a 4-bed/2.5-bath single-family listed at $310k.
Deal economics
- At list price, monthly cash flow is $287 ($3k/yr) — positive.
- The deal already cash-flows at list — no discount required.
- To meet the 1% rule (rent ≥ 1% of price), the offer needs to be $286k (7.5% below list).
- Recommended offer: $282k (9.0% below list) — sets the bar for market timing.
Location & tenants
- Location reads 67/100 on livability (#102 in SC) — a middle-class / working-renter tenant base. Strengths: crime A+, employment A+, housing A+; Watch: amenities F, commute F, cost of living F.
- Lexington 05 (suburban): math 47% / reading 55% proficiency, ranked #5 of 80 in SC (top 6%) — acceptable for families but not a draw, mixed tenant base, ~2y average lease.
- Zoned schools: Chapin Elementary (math 53% / reading 51%, grade C-, #145 of 597 statewide, top 26%, 790 students, 34% FRL); Chapin High (math 82% / reading 91%, grade A, #7 of 196 statewide, top 4%, 1,615 students, 100% FRL) — zoned schools average 67% FRL vs 27% district-wide (40 pts higher); higher-poverty schools than district average — tighter screening recommended.
- Zoned-school proficiency averages 69% at this address vs 51% district-wide (+18 pts) — the actual schools serving this property are materially stronger than the Lexington 05 average implies; a family-tenant draw the district grade alone would hide.
- Market conditions: 434 active listings in the ZIP; 3 comparable units currently listed for rent nearby; rentals leasing fast (median 11d on market — plan ~1-2 weeks tenant-placement turnaround); high-income renter base; 1,712 units permitted in Lexington County in 2024 (0 in 5+ unit buildings).
- This rent runs 30% of the median local income ($114k/yr) — at the standard rent-burdened threshold; future hikes will face affordability resistance.
Forward outlook
- Local home prices are declining (-3.0%/yr); year-one equity from $2k of loan paydown is wiped out by about $9k of value loss. Plan a longer hold.
- Lexington County population projected at +26% by 2050 — long-run rental-demand tailwind backs the buy-and-hold thesis.
Negotiation context
- It's been on market 119 days — a 9% lower offer ($282k) is reasonable based on typical stale-listing flexibility.
- 3 sale attempts since 4y ago; this cycle's ask has dropped $30k (9%) from the opening price — seller is motivated, your offer sets the floor, not the list.
Questions for the listing agent
- It's been on market 119 days. Have you received any prior offers? Is the seller open to a 9% concession, seller financing, or rate buy-down credit?
- What does the HOA fee cover, when was the last increase, and are there any pending special assessments or reserve-fund shortfalls?
- Why hasn't it sold? Are there any deal-killer items the seller is aware of (foundation, flood, title, zoning, code violations)?
- Is there a deadline driving the sale (1031 exchange, divorce, estate, relocation)? That informs how much negotiation room exists.
- Schools are D-rated, which usually means shorter tenancies and higher turnover. Who's the typical renter profile here, and what's been the actual vacancy rate?
- What's the average days-on-market for RENTAL listings here right now (not sales)? A rising rental-DOM trend means longer vacancies and softer asking-rent achievability than the comps imply.
- What's the recent tenant-quality profile in this submarket — average credit score on applications, eviction rate, late-payment / NSF rate, and stable-employment percentage? A property-management company in the area should have these aggregated.
- How much new for-sale + rental construction is in the pipeline within 1–3 miles? Heavy new supply typically softens prices + rents 12–24 months out; constrained supply supports both.
Investment metrics
- 1% rule
- 0.93% ✗
- Cap rate
- 7.40%
- Cash-on-cash
- 3.97%
- DSCR
- 1.18
- GRM
- 9.0
CMA / ARV
- ARV (on-the-fly)
- $330,780
- Comps found
- 1
Show comp detail 1 sale within ~0.75 mi
| Address | Dist | Beds/Ba | Sqft | Sold | Price | $/sf | Match |
|---|---|---|---|---|---|---|---|
| 217 Chapin Place Way | 0.70mi | 4/2.5 | 2,510 (+13%) | 24mo | $372,910 | $149 | 25 |
Match score weights: distance 35% · size 25% · config 20% · recency 20%. Top-matched comps best support the ARV.
Projected returns pro-forma
-3.0% appreciation · 3.0% rent growth · sell at horizon
- IRR
- -10.1%
- Equity multiple
- 0.63×
- Total profit
- $-31,947
- Equity at exit
- $46,147
- IRR
- -0.8%
- Equity multiple
- 0.95×
- Total profit
- $-4,535
- Equity at exit
- $26,760
Cash invested: $86,660 (down + closing). Projections, not guarantees.
Landlord ↔ Tenant lean methodology
- Overall (STATE)
- 90 Strongly Landlord-Friendly
- State South Carolina
- 90 Strongly Landlord-Friendly · R+6
- County
- — inherits STATE
- City
- — inherits STATE
ZIP-level market 29036
- Active inventory
- 434
- Price-to-rent
- 9.0×
Monthly cashflow live
- Estimated rent
- $2,863 medium interval (Pro) →
- Mortgage (P&I)
- −$1,623
- Tax from tax record
- −$158 /mo · $1,900/yr
- Insurance
- −$129
- HOA
- −$65
- Vacancy / Maint / Mgmt
- −$601
- Net cashflow
- $287
Break-even live
UW: 25.0% down · 7.5% · 30yr · 1.5% tax · 5.0% vac · 8.0% maint · 8.0% mgmt
Financing live
Cash to close
- Down payment
- $77,375
- Closing costs
- $9,285
- Reserves months
- —
- Total cash needed
- —
Loan-product check · same deal, 3 products live
Conventional
25% down · 7.5% · 30yr
- Down + closing
- —
- Monthly P&I
- —
- Monthly cashflow
- —
- DSCR
- —
- Eligible?
- —
Personal DTI + credit; lowest rate.
DSCR
20% down · 8.5% · 30yr
- Down + closing
- —
- Monthly P&I
- —
- Monthly cashflow
- —
- DSCR
- —
- Eligible?
- —
No personal income docs; deal must DSCR.
Hard money
10% down · 12.0% · 12mo
- Down + closing
- —
- Monthly P&I
- —
- Monthly cashflow
- —
- DSCR
- —
- Eligible?
- —
Short-term bridge; refi at stabilization.
Rent comps 3 comps
| Address | Beds | Baths | Sqft | Rent | $/sqft | DOM | Units | Dist |
|---|---|---|---|---|---|---|---|---|
| 628 Willowood Pkwy Chapin, SC | 4.0 | 2.0 | 2000 | $2,760 | $1.38 | 3d | 1 | 1.03mi |
| 222 Indian Creek Cir Chapin, SC | 3.0 | 2.0 | 1500 | $2,750 | $1.83 | 23d | 1 | 1.37mi |
| 40 Rustyred Ct Chapin, SC | 4.0 | 2.5 | 2400 | $2,450 | $1.02 | 11d | 1 | 1.47mi |
HOA detail
- Monthly dues
- $65 · $780/yr
- Likely covers
- electric
Listing history 25 events
-
2026-06-18days on market $309,500 Active 119 DOM
-
2026-06-17days on market $309,500 Active 118 DOM
-
2026-06-16days on market $309,500 Active 117 DOM
-
2026-06-15days on market $309,500 Active 116 DOM
-
2026-06-14days on market $309,500 Active 114 DOM
-
2026-06-13days on market $309,500 Active 113 DOM
-
2026-06-10days on market $309,500 Active 111 DOM
-
2026-06-09days on market $309,500 Active 110 DOM
-
2026-06-08days on market $309,500 Active 109 DOM
-
2026-06-07days on market $309,500 Active 108 DOM
-
2026-06-03days on market $309,500 Active 104 DOM
-
2026-06-03days on market $309,500 Active 103 DOM
-
2026-06-01days on market $309,500 Active 102 DOM
-
2026-06-01price $309,500 Active 101 DOM
-
2026-05-31days on market $323,500 Active 101 DOM
-
2026-04-11price $323,500
-
2026-02-19$339,000 Active
-
2025-10-21price $350,000
-
2025-10-15$360,000 Active
-
2022-03-10historical
-
2022-03-09price $310,390
-
2022-02-26price $305,390
-
2022-02-02price $302,390
-
2022-01-20price $300,390
-
2022-01-11$299,390 Active
ⓘ Source: listings_history table (triggers on properties + properties_extension) + one-shot
backfill from property_details.listing_events for pre-trigger history.
Tax reassessment forecast SC · Resets to sale price
- Current annual tax
- $1,900 · $158/mo
- Projected year-2 tax
- $1,900 · $158/mo
- Expected delta
- $0/yr ($0/mo · 0.0%)
ⓘ Screening estimate from a state-policy table — verify with the county assessor before closing.
Nearby sold comps map
Loading sold comps map…
Walkable amenities ~0.75 mi
Loading nearby amenities…
Taxation est. · year 1
- Rental income
- $34,361
- − Mortgage interest
- −$17,337
- − Property taxes
- −$1,900
- − Insurance
- −$1,548
- − Repairs & maintenance
- −$2,749
- − Management
- −$2,749
- − HOA
- −$780
- − Depreciation
- −$9,004
- Taxable loss
- −$1,705
- Est. tax savings @ 24.0%
- +$409
- After-tax cash flow
- $3,850/yr
For passive investors: Depreciation is non-cash, so a rental often shows a tax loss while cash-flowing — sheltering income. Rental losses are passive: they offset passive income freely, and up to $25,000/yr can offset ordinary (W-2) income if you actively participate and your MAGI is under $100k (phasing out to $0 by $150k); unused losses carry forward. On sale, claimed depreciation is recaptured at up to 25%, and gains may owe capital-gains tax (a 1031 exchange can defer both). Figures are a year-1 estimate at your 24.0% rate — not tax advice; consult a CPA.
Schools (NCES district)
- District
- Lexington 05
- NCES district ID
- 4502820
- Math proficiency
- 47% ▼ -7.00%
- Reading proficiency
- 55% ▼ -4.00%
- Median HH income
- $67,732
- Composite
- 45.28/100
- National rank
- #2656
- State rank
- #5 of 80 in SC
Livability — Lake Murray of Richland
- Score
- 67/100
- State rank
- #102
- US rank
- #10903
Category grades
Schools grade is shown separately in the Schools card above.
Census & demographics
- County
- Lexington County · 232,571 people
- City population
- 179
- Metro
- Columbia, SC
- Population (ZIP)
- 26,620
- Household income
- $113,986
- Rent vs Own
- Severe rent burden
- 212.0
Population outlook (Lexington County) Hauer SSP2
- Today (2025)
- 322,999 people
- By 2030
- 342,356 · +6.0%
- By 2040
- 377,715 · +16.9%
- By 2050
- 406,984 · +26.0%
- By 2075
- 465,447 · +44.1%
- By 2100
- 485,674 · +50.4%
Race, ethnicity, and origin ACS 2023
- Neighborhood character
- Predominantly White (86%)
- Race & ethnicity
- White 86% Asian 5% Two or more races 4% Black 3% Hispanic / Latino 3%
- Common ancestry
- Lithuanian 4% Slovak 4% Italian 2%
- Foreign-born
- 6% · Canada, South Korea, China
- Languages at home
- 95% English-only · Other Indo-European 2% Spanish 1% Korean 1%
Political lean MEDSL · Lexington
- 2024 margin
- Solid R (+33.5) · D 32.5% · R 66.0% · Other 1.4%
- 2008→2024 swing
- +4.6pp toward D · 2008: -38.0pp · 2024: -33.5pp
- All cycles
- 2024: R+33.5 2020: R+30.1 2016: R+36.7 2012: R+37.8 2008: R+38.0
Not yet ingested
- Civics
- —
Market trends
- HPI YoY
- ▼ -134.76%
- Current HPI
- 248.3807
- Rent YoY
- —
- Metro
- Columbia, SC
- State GDP YoY
- ▲ 4.51%
- F500 in state
- 2
Industry mix (Fortune 500 HQ in SC)
| Industry | F500 HQs | Revenue |
|---|---|---|
| Packaging | 1 | $7B |
|
||
Price history
+8.1% since first listed10 events — show timeline
- 2026-04-11 Price Changed $323,500 Consolidated MLS
- 2026-02-19 Listed $339,000 Consolidated MLS
- 2025-10-21 Price Changed $350,000 Consolidated MLS
- 2025-10-15 Listed $360,000 Consolidated MLS
- 2022-03-10 Delisted — Consolidated MLS
- 2022-03-09 Price Changed $310,390 Consolidated MLS
- 2022-02-26 Price Changed $305,390 Consolidated MLS
- 2022-02-02 Price Changed $302,390 Consolidated MLS
- 2022-01-20 Price Changed $300,390 Consolidated MLS
- 2022-01-11 Listed $299,390 Consolidated MLS
Property tax history
+197.6%/yrLatest (2024): $1,900 · -76.4% YoY. Source: county tax records.
Cash-flow waterfall
monthlySold comps — $/sqft
last 12 mo · ≤1 miLoading sold comps…