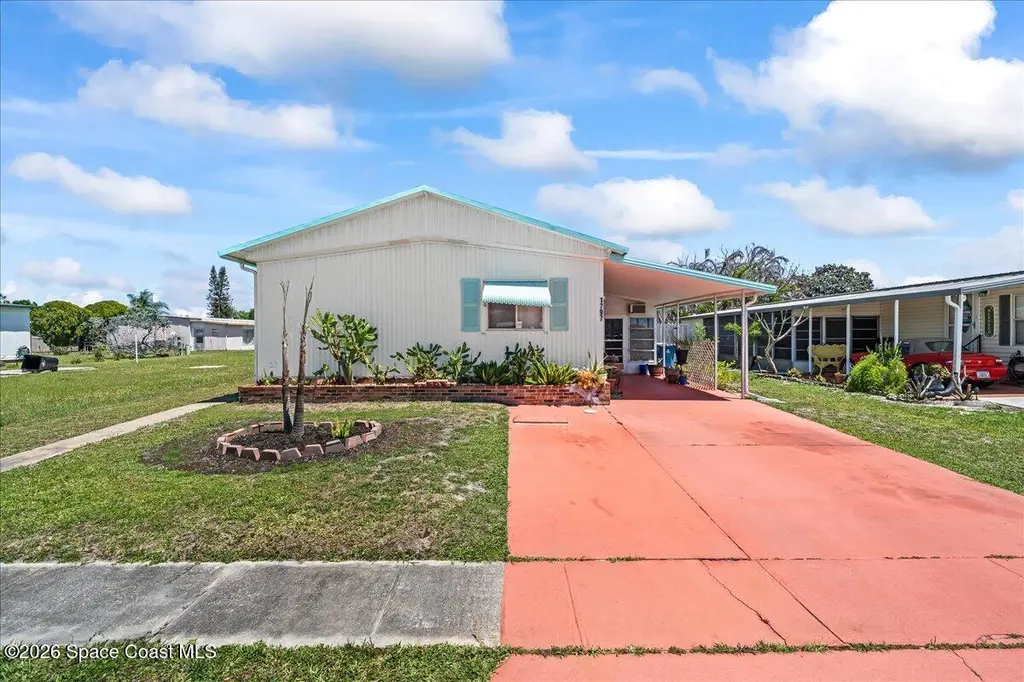
1797 Coco Plum St NE · Palm Bay, FL
Flood risk 1/10 · Minimal
- FEMA flood zone
- X (unshaded)
- Chance of flooding over 30 yrs
- 0.0%
- Est. flood insurance / yr
- $507 – $1,088
Fire risk 1/10 · Minimal
- Est. fire insurance / yr
- $947 – $1,759
Heat risk 10/10 · Severe
- Hot days now (above 105°F)
- 7 days/yr
- Hot days in 30 yrs
- 22 days/yr
Wind risk 10/10 · Severe
- Chance of severe wind over 30 yrs
- 99.0%
Air-quality risk 1/10 · Minimal
- Unhealthy air days now
- 0 days/yr
- Unhealthy air days in 30 yrs
- 0 days/yr
Risk factors via First Street. Map © Google.
Why this score? — see what drove the C grade
The composite is a weighted blend of 9 inputs, each scored 0–100. Each bar is that input's sub-score; the figure is the points it added to the 100-point composite (weight × sub-score).
- Cash flow +23.4/30.0
- DSCR +7.5/10.0
- ARV discount +7.5/15.0
- 1% rule +5.9/10.0
- Schools +4.7/10.0
- Livability +3.6/5.0
- Condition / age +2.5/5.0
- Rent growth +2.4/5.0
- Appreciation +2.2/10.0
$170,000
🖨 Deal sheet 📄 Offer letter ✓ Due diligence
Listing remarks
Rare, well-maintained 3-bedroom split floor plan offering a light and bright feel with beautiful LVP flooring throughout. All three bedrooms feature walk-in closets, giving you great storage space throughout the home. The spacious primary suite includes a double vanity, walk-in shower, and large garden tub. Inside, you'll also find a convenient laundry room with utility sink, and the washer and dryer stay. Step into the beautiful Florida room for an added bonus space to relax or entertain. Outside, there is also a utility room, storage shed, and a fully privacy-fenced backyard that's easy to maintain while still offering room to enjoy the Florida lifestyle. Ideally located near shopping, di
Key facts
- Utility room
- Laundry room
- Split floor plan
Tags
Property features AI
Finance
- HOA & community: Part of Palm Bay Colony association; Monthly association fee of $45; Association maintains grounds; Community amenities: clubhouse, fitness center, tennis courts, pickleball, shuffleboard; Senior community
Exterior
- Parking: Attached carport (1 space)
- Utilities: Public sewer; Water connected; Sewer connected; Cable available
- Home design: Manufactured home; Single-story; Faces west
- Construction: Frame construction; Metal roof; Built as a manufactured home
- Exterior features: Fenced yard with full privacy wood fencing; No private pool
Interior
- Kitchen: Dishwasher; Electric oven; Electric range; Refrigerator
- Bedrooms: 3 bedrooms (primary on main level)
- Bathrooms: 2 full bathrooms
- Heating & cooling: Central electric heating; Central air conditioning (electric)
- Interior features: Breakfast bar; Built-in features; Ceiling fans; Primary bathroom with tub and separate shower; Primary bedroom on main level; Split bedroom floorplan; Walk-in closet(s)
- Laundry & utility: In-unit laundry with washer, dryer and utility sink; Electric water heater
Neighborhood map
What this means for you Summary
Snapshot
- This is a 3-bed/2.0-bath manufactured listed at $170k.
Deal economics
- At list price, monthly cash flow is $315 ($4k/yr) — positive.
- The deal already cash-flows at list — no discount required.
- Meets the 1% rule at list price ($2k rent vs $170k).
- Recommended offer: $160k (6.0% below list) — sets the bar for market timing.
Location & tenants
- Location reads 72/100 on livability (#366 in FL) — a middle-class / working-renter tenant base. Strengths: cost of living A+, housing A+; Watch: employment D+, amenities F, health & safety D-.
- Brevard (suburban): math 53% / reading 57% proficiency, ranked #19 of 73 in FL (top 26%) — acceptable for families but not a draw, mixed tenant base, ~2y average lease.
- Zoned schools: Stone Magnet Middle School (math 33% / reading 35%, grade F, #426 of 571 statewide, top 75%, 670 students, 69% FRL); Palm Bay Magnet Senior High School (math 25% / reading 37%, grade F, #429 of 667 statewide, top 65%, 1,486 students, 63% FRL) — zoned schools average 66% FRL vs 43% district-wide (23 pts higher); higher-poverty schools than district average — tighter screening recommended.
- Zoned-school proficiency averages 32% at this address vs 55% district-wide (-22 pts) — the specific schools serving this property underperform the Brevard average; the district grade overstates school quality for this exact location.
- Market conditions: Rents soft (-0.5%/yr); 321 active listings in the ZIP; 31 comparable units currently listed for rent nearby; rentals at typical pace (median 21d on market — plan ~3-4 weeks tenant-placement turnaround); 4,602 units permitted in Brevard County in 2024 (702 in 5+ unit buildings).
- This rent runs 39% of the median local income ($56k/yr) — at the standard rent-burdened threshold; future hikes will face affordability resistance.
Forward outlook
- Local home prices are declining (-3.0%/yr); year-one equity from $1k of loan paydown is wiped out by about $5k of value loss. Plan a longer hold.
- Brevard County population projected at +15% by 2050 — modest demand growth; plan on rents tracking national, not racing it.
Negotiation context
- It's been on market 61 days — a 6% lower offer ($160k) is reasonable based on typical stale-listing flexibility.
Risks & watch-outs
- Climate carrying-cost: severe wind risk, 99% chance of damaging wind over 30y; extreme-heat days projected 7→22/yr by 2055 (HVAC capex compounding) — expect insurance premiums to compound above CPI over the hold.
Questions for the listing agent
- It's been on market 61 days. Have you received any prior offers? Is the seller open to a 6% concession, seller financing, or rate buy-down credit?
- Built in 1979 — when were the roof, HVAC, electrical panel, plumbing, and water heater last replaced?
- What does the HOA fee cover, when was the last increase, and are there any pending special assessments or reserve-fund shortfalls?
- Why hasn't it sold? Are there any deal-killer items the seller is aware of (foundation, flood, title, zoning, code violations)?
- Is there a deadline driving the sale (1031 exchange, divorce, estate, relocation)? That informs how much negotiation room exists.
- What's the average days-on-market for RENTAL listings here right now (not sales)? A rising rental-DOM trend means longer vacancies and softer asking-rent achievability than the comps imply.
- What's the recent tenant-quality profile in this submarket — average credit score on applications, eviction rate, late-payment / NSF rate, and stable-employment percentage? A property-management company in the area should have these aggregated.
- How much new for-sale + rental construction is in the pipeline within 1–3 miles? Heavy new supply typically softens prices + rents 12–24 months out; constrained supply supports both.
Investment metrics
- 1% rule
- 1.09% ✓
- Cap rate
- 8.52%
- Cash-on-cash
- 7.94%
- DSCR
- 1.35
- GRM
- 7.6
CMA / ARV
No comps found within radius.
Projected returns pro-forma
-3.0% appreciation · 0.0% rent growth · sell at horizon
- IRR
- -7.6%
- Equity multiple
- 0.73×
- Total profit
- $-12,900
- Equity at exit
- $25,348
- IRR
- -2.3%
- Equity multiple
- 0.87×
- Total profit
- $-6,329
- Equity at exit
- $14,698
Cash invested: $47,600 (down + closing). Projections, not guarantees.
Landlord ↔ Tenant lean methodology
- Overall (STATE)
- 87 Strongly Landlord-Friendly
- State Florida
- 87 Strongly Landlord-Friendly · R+3
- County
- — inherits STATE
- City
- — inherits STATE
ZIP-level market 32905
- Home prices YoY
- -1.8%
- Rents YoY
- -0.5%
- Active inventory
- 321
- Price-to-rent
- 7.6×
Monthly cashflow live
- Estimated rent
- $1,852 high interval (Pro) →
- Mortgage (P&I)
- −$891
- Tax from tax record
- −$141 /mo · $1,692/yr
- Insurance
- −$71
- HOA
- −$45
- Vacancy / Maint / Mgmt
- −$389
- Net cashflow
- $315
Break-even live
UW: 25.0% down · 7.5% · 30yr · 1.5% tax · 5.0% vac · 8.0% maint · 8.0% mgmt
Financing live
Cash to close
- Down payment
- $42,500
- Closing costs
- $5,100
- Reserves months
- —
- Total cash needed
- —
Loan-product check · same deal, 3 products live
Conventional
25% down · 7.5% · 30yr
- Down + closing
- —
- Monthly P&I
- —
- Monthly cashflow
- —
- DSCR
- —
- Eligible?
- —
Personal DTI + credit; lowest rate.
DSCR
20% down · 8.5% · 30yr
- Down + closing
- —
- Monthly P&I
- —
- Monthly cashflow
- —
- DSCR
- —
- Eligible?
- —
No personal income docs; deal must DSCR.
Hard money
10% down · 12.0% · 12mo
- Down + closing
- —
- Monthly P&I
- —
- Monthly cashflow
- —
- DSCR
- —
- Eligible?
- —
Short-term bridge; refi at stabilization.
Rent comps 31 comps
| Address | Beds | Baths | Sqft | Rent | $/sqft | DOM | Units | Dist |
|---|---|---|---|---|---|---|---|---|
| 1894 Coco Plum St NE Palm Bay, FL | 2.0 | 2.0 | 1188 | $1,200 | $1.01 | 19d | 1 | 0.18mi |
| 4317 Jetty Ln NE Palm Bay, FL | 3.0 | 2.0 | 1699 | $2,200 | $1.29 | 21d | 1 | 0.19mi |
| 1924 Seagrape St NE Palm Bay, FL | 2.0 | 2.0 | 1206 | $1,575 | $1.31 | 14d | 1 | 0.23mi |
| 3506 Mount Carmel Ln Melbourne, FL | 3.0 | 2.0 | 1815 | $2,800 | $1.54 | 23d | 1 | 0.32mi |
| 3676 Mount Carmel Ln Melbourne, FL | 4.0 | 2.0 | 1772 | $2,000 | $1.13 | 14d | 1 | 0.32mi |
| 2399 Coconut Palm Dr NE Palm Bay, FL | 2.0 | 2.0 | 968 | $1,795 | $1.85 | 23d | 1 | 0.35mi |
| 2361 Commerce Park Dr NE Palm Bay, FL | 1.0–3.0 | 1.0–2.0 | 1106 | $2,255 | $2.04 | 13d | 47 | 0.46mi |
| 1700 Woodlake Dr NE Palm Bay, FL | 1.0–2.0 | 1.0–2.0 | 875 | $1,500 | $1.71 | 23d | 12 | 0.55mi |
| 2331 Commerce Park Dr NE Palm Bay, FL | 1.0–3.0 | 1.0–2.0 | 1094 | $2,024 | $1.85 | 13d | 33 | 0.57mi |
| 2155 Robert J Conlan Blvd NE Palm Bay, FL | 1.0–3.0 | 1.0–2.0 | 1093 | $2,022 | $1.85 | 13d | 20 | 0.61mi |
| 3711 Vista Oaks Cir NE Palm Bay, FL | 2.0 | 1.5 | 1236 | $1,500 | $1.21 | 21d | 1 | 0.64mi |
| 520 Benton Dr Melbourne, FL | 3.0 | 2.0 | 1281 | $1,850 | $1.44 | 23d | 1 | 0.65mi |
| 1630 Bottlebrush Dr Palm Bay, FL | 2.0 | 1.0 | 600 | $1,495 | $2.49 | 23d | 1 | 0.70mi |
| 2154 Henry St NE Palm Bay, FL | 4.0 | 1.5 | 1020 | $1,850 | $1.81 | 23d | 1 | 0.70mi |
| 342 Crown Blvd Melbourne, FL | 3.0 | 2.0 | 1224 | $1,900 | $1.55 | 23d | 1 | 0.85mi |
| 4001 Pinewood Dr NE Palm Bay, FL | 2.0 | 2.0 | 1036 | $1,269 | $1.22 | 23d | 5 | 0.88mi |
| 3016 Pinewood Dr NE Palm Bay, FL | 1.0–2.0 | 1.0 | 800 | $1,103 | $1.38 | 23d | 1 | 0.96mi |
| 1880 Mogra Cir NE Palm Bay, FL | 2.0–3.0 | 2.0 | 1090 | $1,899 | $1.74 | 14d | 6 | 0.97mi |
| 2168 Tarrytown Ln NE Palm Bay, FL | 3.0 | 2.0 | 1281 | $1,775 | $1.39 | 14d | 1 | 1.01mi |
| 1300 Arlington Ln NE #125 Palm Bay, FL | 2.0 | 2.5 | 1140 | $1,500 | $1.32 | 19d | 1 | 1.03mi |
| 2106 Tarrytown Ln NE Palm Bay, FL | 3.0 | 2.0 | 1281 | $1,900 | $1.48 | 14d | 1 | 1.04mi |
| 2643B Kingswood Dr NE Palm Bay, FL | 3.0 | 1.0 | 1000 | $1,650 | $1.65 | 19d | 1 | 1.06mi |
| 2394 Shenandoah Rd NE Palm Bay, FL | 3.0 | 2.0 | 1632 | $2,000 | $1.23 | 23d | 1 | 1.07mi |
| 2308 Shenandoah Rd Unit B Palm Bay, FL | 3.0 | 1.5 | 1612 | $1,975 | $1.23 | 14d | 1 | 1.11mi |
| 2308 Shenandoah Rd Unit A Palm Bay, FL | 3.0 | 1.0 | 1612 | $1,600 | $0.99 | 23d | 1 | 1.11mi |
| 4315 S Babcock St Melbourne, FL | 1.0–3.0 | 1.0–2.0 | 996 | $2,026 | $2.03 | 13d | 15 | 1.19mi |
| 3104 Swift St Melbourne, FL | 3.0 | 1.0 | 1379 | $1,750 | $1.27 | 23d | 1 | 1.32mi |
| 1051 Clearmont St NE Unit 202 Palm Bay, FL | 2.0 | 2.0 | 993 | $1,480 | $1.49 | 19d | 1 | 1.43mi |
| 3101 Wiley Ave Melbourne, FL | 3.0 | 2.0 | 1185 | $1,499 | $1.26 | 23d | 1 | 1.48mi |
| 343 Talbot St Melbourne, FL | 3.0 | 2.0 | 1355 | $1,699 | $1.25 | 23d | 1 | 1.50mi |
| 1000 Palm Place Dr NE Palm Bay, FL | 1.0–2.0 | 1.0–2.0 | 884 | $2,185 | $2.47 | 21d | 8 | 1.50mi |
HOA detail
- Monthly dues
- $45 · $540/yr
Listing history 20 events
-
2026-06-18days on market $170,000 Active 61 DOM
-
2026-06-17days on market $170,000 Active 60 DOM
-
2026-06-16days on market $170,000 Active 59 DOM
-
2026-06-15days on market $170,000 Active 58 DOM
-
2026-06-14days on market $170,000 Active 56 DOM
-
2026-06-10days on market $170,000 Active 53 DOM
-
2026-06-08days on market $170,000 Active 51 DOM
-
2026-06-07days on market $170,000 Active 50 DOM
-
2026-06-05days on market $170,000 Active 47 DOM
-
2026-06-03days on market $170,000 Active 46 DOM
-
2026-06-02days on market $170,000 Active 45 DOM
-
2026-06-01days on market $170,000 Active 44 DOM
-
2026-05-31days on market $170,000 Active 43 DOM
-
2026-05-31days on market $170,000 Active 42 DOM
-
2026-04-18$170,000 Active
-
2022-06-02soldstatus $180,000
-
2017-04-25soldstatus $46,000
-
1985-02-01soldstatus $46,500
-
1983-06-01soldstatus $42,000
-
1979-02-28soldstatus $38,700
ⓘ Source: listings_history table (triggers on properties + properties_extension) + one-shot
backfill from property_details.listing_events for pre-trigger history.
Tax reassessment forecast FL · Resets to sale price
- Current annual tax
- $1,692 · $141/mo
- Projected year-2 tax
- $1,692 · $141/mo
- Expected delta
- $0/yr ($0/mo · 0.0%)
ⓘ Screening estimate from a state-policy table — verify with the county assessor before closing.
Climate risk First Street
- Flood 1/10 Low FEMA zone X (unshaded) · 0% chance over 30 yrs
- Wildfire 1/10 Low
- Heat 10/10 Extreme 7 d/yr ≥105°F today · 22 d/yr by 30 yrs out
- Wind 10/10 Extreme 99% chance of damaging wind over 30 yrs
- Air quality 1/10 Low 0 unhealthy d/yr today · 0 by 30 yrs out
Nearby sold comps map
Loading sold comps map…
Walkable amenities ~0.75 mi
Loading nearby amenities…
Taxation est. · year 1
- Rental income
- $22,229
- − Mortgage interest
- −$9,523
- − Property taxes
- −$1,692
- − Insurance
- −$850
- − Repairs & maintenance
- −$1,778
- − Management
- −$1,778
- − HOA
- −$540
- − Depreciation
- −$4,945
- Taxable income
- $1,122
- Est. tax owed @ 24.0%
- −$269
- After-tax cash flow
- $3,511/yr
For passive investors: Depreciation is non-cash, so a rental often shows a tax loss while cash-flowing — sheltering income. Rental losses are passive: they offset passive income freely, and up to $25,000/yr can offset ordinary (W-2) income if you actively participate and your MAGI is under $100k (phasing out to $0 by $150k); unused losses carry forward. On sale, claimed depreciation is recaptured at up to 25%, and gains may owe capital-gains tax (a 1031 exchange can defer both). Figures are a year-1 estimate at your 24.0% rate — not tax advice; consult a CPA.
Schools (NCES district)
- District
- Brevard
- NCES district ID
- 1200150
- Math proficiency
- 53% ▼ -9.00%
- Reading proficiency
- 57% ▼ -4.00%
- Median HH income
- $49,426
- Composite
- 46.86/100
- National rank
- #2370
- State rank
- #19 of 73 in FL
Livability — Palm Bay
- Score
- 72/100
- State rank
- #366
- US rank
- #6458
Category grades
Schools grade is shown separately in the Schools card above.
Census & demographics
- Census place
- Palm Bay, FL
- County
- Brevard County · 602,871 people
- City population
- 132,211
- Metro
- Palm Bay-Melbourne-Titusville, FL
- Population (ZIP)
- 24,792
- Household income
- $56,411
- Rent vs Own
- Severe rent burden
- 1962.0
Population outlook (Brevard County) Hauer SSP2
- Today (2025)
- 623,254 people
- By 2030
- 648,420 · +4.0%
- By 2040
- 690,009 · +10.7%
- By 2050
- 715,669 · +14.8%
- By 2075
- 775,744 · +24.5%
- By 2100
- 776,687 · +24.6%
Race, ethnicity, and origin ACS 2023
- Neighborhood character
- Diverse neighborhood (Simpson 0.57)
- Race & ethnicity
- White 61% Hispanic / Latino 16% Black 16% Two or more races 11% Asian 2%
- Hispanic origin (detail)
- Mexican 1% Puerto Rican 4% Cuban 4%
- Common ancestry
- Romanian 2% Hispanic 2% Slovak 2%
- Foreign-born
- 13% · Canada, Jamaica
- Languages at home
- 83% English-only · Spanish 12% French/Haitian/Cajun 2% Other Indo-European 2%
Political lean MEDSL · Brevard
- 2024 margin
- Strong R (+20.8) · D 39.1% · R 59.9% · Other 1.0%
- 2008→2024 swing
- -10.4pp toward R · 2008: -10.4pp · 2024: -20.8pp
- All cycles
- 2024: R+20.8 2020: R+16.4 2016: R+19.8 2012: R+12.7 2008: R+10.4
Not yet ingested
- Civics
- —
Market trends
- HPI YoY
- ▼ -5.59%
- Current HPI
- 309.8748
- Rent YoY
- ▼ -0.52%
- Metro
- Palm Bay-Melbourne-Titusville, FL
- State GDP YoY
- ▲ 3.28%
- F500 in state
- 36
Industry mix (Fortune 500 HQ in FL)
| Industry | F500 HQs | Revenue |
|---|---|---|
| Industrial Technology | 2 | $29B |
|
||
| Insurance | 2 | $17B |
|
||
| Retail | 1 | $60B |
|
||
| Technology Distribution | 1 | $58B |
|
||
| Homebuilding | 1 | $35B |
|
||
| Technology Manufacturing | 1 | $35B |
|
||
Price history
+339.3% since first listed6 events — show timeline
- 2026-04-18 Listed $170,000 SCMLS
- 2022-06-02 Sold (Public Records) $180,000 Public Records
- 2017-04-25 Sold (Public Records) $46,000 Public Records
- 1985-02-01 Sold (Public Records) $46,500 Public Records
- 1983-06-01 Sold (Public Records) $42,000 Public Records
- 1979-02-28 Sold (Public Records) $38,700 Public Records
Property tax history
+6.7%/yrLatest (2025): $1,692 · -12.0% YoY. Source: county tax records.
Cash-flow waterfall
monthlySold comps — $/sqft
last 12 mo · ≤1 miLoading sold comps…