7100 La Tijera Blvd · Los Angeles, CA
Flood risk 4/10 · Minor
- FEMA flood zone
- X (unshaded)
- Chance of flooding over 30 yrs
- 0.13%
- Est. flood insurance / yr
- $507 – $1,088
Fire risk 1/10 · Minimal
- Est. fire insurance / yr
- $659 – $1,223
Heat risk 5/10 · Moderate
- Hot days now (above 85°F)
- 7 days/yr
- Hot days in 30 yrs
- 20 days/yr
Wind risk 1/10 · Minimal
- Chance of severe wind over 30 yrs
- —
Air-quality risk 4/10 · Minor
- Unhealthy air days now
- 6 days/yr
- Unhealthy air days in 30 yrs
- 7 days/yr
Risk factors via First Street. Map © Google.
Why this score? — see what drove the C- grade
The composite is a weighted blend of 9 inputs, each scored 0–100. Each bar is that input's sub-score; the figure is the points it added to the 100-point composite (weight × sub-score).
- Cash flow +19.0/30.0
- ARV discount +7.5/15.0
- 1% rule +6.3/10.0
- DSCR +6.0/10.0
- Schools +3.6/10.0
- Livability +3.4/5.0
- Rent growth +2.9/5.0
- Condition / age +2.5/5.0
- Appreciation +0.0/10.0
$435,000
🖨 Deal sheet 📄 Offer letter ✓ Due diligence
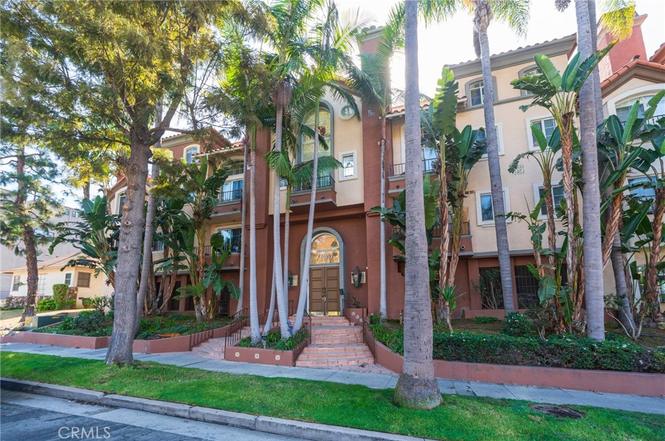
Listing remarks
Spacious one-bedroom, one-bathroom condominium in a Mediterranean-style Westchester complex. This private and quiet building offers secured entry and desirable amenities including a spa and fitness center. The unit features hardwood flooring throughout, a gas fireplace with a new granite hearth, in-unit stackable washer/dryer, and central air conditioning and heating. The updated kitchen is equipped with granite countertops and stainless steel appliances including a refrigerator, oven, microwave, dishwasher, and disposal. Additional features include an ADT security system and two parking spaces (one secured parking space and one carport space). Ideally located just 1/10 mile from the 405 Fr
Key facts
- Hardwood flooring
- Fitness center
- Spa
Tags
Property features AI
Finance
- HOA & community: Part of Toscana Villas Condo HOA; Monthly association fee of $407; Community amenities include gym and spa; Urban community
Exterior
- Parking: 2-car garage (subterranean, controlled entrance); 1 carport space; Total 3 parking spaces
- Security: Card/Code access; Gated community; Carbon monoxide and smoke detectors; Smoke detector(s)
- Utilities: Public sewer; District/public water
- Home design: Condominium (attached); Multi-family structure; One story; Spanish tile roof; Located directly on La Tijera Blvd; 20 units in community; 2+ common walls
- Construction: Spanish tile roof; Built year sourced from public records
- Exterior features: Patio; No pool listed
Interior
- Kitchen: Granite counters; Garbage disposal; Microwave; Refrigerator; Gas range and gas oven; Dishwasher; Formal dining room
- Bedrooms: Main floor bedroom (1)
- Flooring: Carpet; Wood
- Bathrooms: 1 full bathroom with shower-in-tub
- Heating & cooling: Central air conditioning; Central furnace; Fireplace (living room)
- Interior features: Partially furnished; Ceiling fan; Recessed lighting; Open floor plan; Granite counters; Double pane windows; Card/Code access; Carbon monoxide and smoke detectors; Gated community; Community spa
- Laundry & utility: Stackable washer and dryer included
Neighborhood map
What this means for you Summary
Snapshot
- This is a 40-bed/40.0-bath townhouse listed at $435k.
Deal economics
- At list price, monthly cash flow is $456 ($5k/yr) — positive.
- The deal already cash-flows at list — no discount required.
- Meets the 1% rule at list price ($5k rent vs $435k).
- Cap rate 7.5% vs local median 2.1% in Los Angeles — top-decile yield for the area; either an underpriced asset or a hidden risk that comps aren't pricing in. Stress-test before assuming the spread holds.
Location & tenants
- Location reads 68/100 on livability (#273 in CA) — a middle-class / working-renter tenant base. Strengths: amenities A+, commute A+, employment B; Watch: health & safety C-, schools D+, crime F.
- Los Angeles Unified (urban): math 29% / reading 54% proficiency, ranked #223 of 517 in CA (top 43%) — families likely to look elsewhere, expect single-tenant / working-renter base with shorter leases; 67% free/reduced lunch — lower-income household profile, screen leases tightly.
- Market conditions: Rents rising (+1.5%/yr); 106 active listings in the ZIP; high-income renter base; 19,697 units permitted in Los Angeles County in 2024 (9,426 in 5+ unit buildings).
- This rent runs 44% of the median local income ($135k/yr) — at the standard rent-burdened threshold; future hikes will face affordability resistance.
Forward outlook
- Local home prices are declining (-3.0%/yr); year-one equity from $3k of loan paydown is wiped out by about $13k of value loss. Plan a longer hold.
- Los Angeles County population projected at +9% by 2050 — modest demand growth; plan on rents tracking national, not racing it.
Negotiation context
- Only 1 days on market — expect competitive offers; lowballing is unlikely to land.
- 4 sale attempts since 2y ago with the ask held roughly flat each time — persistent listings suggest the price (not the market) is what's stuck; bring a comps-based counter.
Risks & watch-outs
- Climate carrying-cost: extreme-heat days projected 7→20/yr by 2055 (HVAC capex compounding) — expect insurance premiums to compound above CPI over the hold.
Questions for the listing agent
- What does the HOA fee cover, when was the last increase, and are there any pending special assessments or reserve-fund shortfalls?
- Is there a deadline driving the sale (1031 exchange, divorce, estate, relocation)? That informs how much negotiation room exists.
- Schools are D-rated, which usually means shorter tenancies and higher turnover. Who's the typical renter profile here, and what's been the actual vacancy rate?
- Crime grade is F in this area — have there been break-ins, vandalism, or insurance claims at this property in the last 3 years? What carrier currently insures it and at what premium?
- What's the average days-on-market for RENTAL listings here right now (not sales)? A rising rental-DOM trend means longer vacancies and softer asking-rent achievability than the comps imply.
- What's the recent tenant-quality profile in this submarket — average credit score on applications, eviction rate, late-payment / NSF rate, and stable-employment percentage? A property-management company in the area should have these aggregated.
- How much new for-sale + rental construction is in the pipeline within 1–3 miles? Heavy new supply typically softens prices + rents 12–24 months out; constrained supply supports both.
Investment metrics
- 1% rule
- 1.13% ✓
- Cap rate
- 7.55%
- Cash-on-cash
- 4.49%
- DSCR
- 1.20
- GRM
- 7.4
CMA / ARV
No comps found within radius.
Projected returns pro-forma
-3.0% appreciation · 1.5% rent growth · sell at horizon
- IRR
- -11.1%
- Equity multiple
- 0.60×
- Total profit
- $-48,429
- Equity at exit
- $64,860
- IRR
- -4.4%
- Equity multiple
- 0.73×
- Total profit
- $-32,484
- Equity at exit
- $37,611
Cash invested: $121,800 (down + closing). Projections, not guarantees.
Landlord ↔ Tenant lean methodology
- Overall (CITY)
- 0 Strongly Tenant-Friendly
- State California
- 18 Strongly Tenant-Friendly · D+13
- County
- — inherits STATE
- City Los Angeles
- 0 Strongly Tenant-Friendly · D+22
ZIP-level market 90045
- Rents YoY
- 1.5%
- Active inventory
- 106
- Price-to-rent
- 7.4×
Monthly cashflow live
- Estimated rent
- $4,897 medium interval (Pro) →
- Mortgage (P&I)
- −$2,281
- Tax est. 1.5%
- −$544 /mo · $6,525/yr
- Insurance
- −$181
- HOA
- −$407
- Vacancy / Maint / Mgmt
- −$1,028
- Net cashflow
- $456
Break-even live
UW: 25.0% down · 7.5% · 30yr · 1.5% tax · 5.0% vac · 8.0% maint · 8.0% mgmt
Financing live
Cash to close
- Down payment
- $108,750
- Closing costs
- $13,050
- Reserves months
- —
- Total cash needed
- —
Loan-product check · same deal, 3 products live
Conventional
25% down · 7.5% · 30yr
- Down + closing
- —
- Monthly P&I
- —
- Monthly cashflow
- —
- DSCR
- —
- Eligible?
- —
Personal DTI + credit; lowest rate.
DSCR
20% down · 8.5% · 30yr
- Down + closing
- —
- Monthly P&I
- —
- Monthly cashflow
- —
- DSCR
- —
- Eligible?
- —
No personal income docs; deal must DSCR.
Hard money
10% down · 12.0% · 12mo
- Down + closing
- —
- Monthly P&I
- —
- Monthly cashflow
- —
- DSCR
- —
- Eligible?
- —
Short-term bridge; refi at stabilization.
HOA detail
- Monthly dues
- $407 · $4,884/yr
- Likely covers
- gasgymsecurity
Listing history 2 events
-
2026-06-18remarks 699-char remark
-
2026-06-18$435,000 Active 1 DOM
ⓘ Source: listings_history table (triggers on properties + properties_extension) + one-shot
backfill from property_details.listing_events for pre-trigger history.
Climate risk First Street
- Flood 4/10 Moderate FEMA zone X (unshaded) · 13% chance over 30 yrs
- Wildfire 1/10 Low
- Heat 5/10 Major 7 d/yr ≥85°F today · 20 d/yr by 30 yrs out
- Wind 1/10 Low
- Air quality 4/10 Moderate 6 unhealthy d/yr today · 7 by 30 yrs out
Nearby sold comps map
Loading sold comps map…
Walkable amenities ~0.75 mi
Loading nearby amenities…
Taxation est. · year 1
- Rental income
- $58,767
- − Mortgage interest
- −$24,367
- − Property taxes
- −$6,525
- − Insurance
- −$2,175
- − Repairs & maintenance
- −$4,701
- − Management
- −$4,701
- − HOA
- −$4,884
- − Depreciation
- −$12,655
- Taxable loss
- −$1,241
- Est. tax savings @ 24.0%
- +$298
- After-tax cash flow
- $5,765/yr
For passive investors: Depreciation is non-cash, so a rental often shows a tax loss while cash-flowing — sheltering income. Rental losses are passive: they offset passive income freely, and up to $25,000/yr can offset ordinary (W-2) income if you actively participate and your MAGI is under $100k (phasing out to $0 by $150k); unused losses carry forward. On sale, claimed depreciation is recaptured at up to 25%, and gains may owe capital-gains tax (a 1031 exchange can defer both). Figures are a year-1 estimate at your 24.0% rate — not tax advice; consult a CPA.
Schools (NCES district)
- District
- Los Angeles Unified
- NCES district ID
- 0622710
- Math proficiency
- 29% ▼ -4.00%
- Reading proficiency
- 54% ▲ 10.00%
- Median HH income
- $50,403
- Composite
- 35.67/100
- National rank
- #4875
- State rank
- #223 of 517 in CA
Livability — Los Angeles
- Score
- 68/100
- State rank
- #273
- US rank
- #9237
Category grades
Schools grade is shown separately in the Schools card above.
Census & demographics
- Census place
- Los Angeles, CA
- County
- Los Angeles County · 9,444,647 people
- City population
- 3,838,149
- Metro
- Los Angeles-Long Beach-Anaheim, CA
- Population (ZIP)
- 41,786
- Household income
- $135,032
- Rent vs Own
- Severe rent burden
- 2723.0
Population outlook (Los Angeles County) Hauer SSP2
- Today (2025)
- 10,940,515 people
- By 2030
- 11,256,481 · +2.9%
- By 2040
- 11,729,929 · +7.2%
- By 2050
- 11,948,407 · +9.2%
- By 2075
- 11,818,114 · +8.0%
- By 2100
- 10,842,928 · -0.9%
Race, ethnicity, and origin ACS 2023
- Neighborhood character
- Diverse neighborhood (Simpson 0.69)
- Race & ethnicity
- White 49% Hispanic / Latino 19% Two or more races 17% Asian 16% Black 8%
- Hispanic origin (detail)
- Mexican 11%
- Common ancestry
- Italian 3% Romanian 3% Lithuanian 3%
- Foreign-born
- 17% · Canada, China, Jamaica
- Languages at home
- 70% English-only · Spanish 13% Chinese 4% Other Indo-European 4%
Political lean MEDSL · Los Angeles
- 2024 margin
- Solid D (+32.9) · D 64.8% · R 31.9% · Other 3.3%
- 2008→2024 swing
- -7.4pp toward R · 2008: 40.4pp · 2024: 32.9pp
- All cycles
- 2024: D+32.9 2020: D+44.2 2016: D+48.0 2012: D+40.0 2008: D+40.4
Not yet ingested
- Civics
- —
Market trends
- HPI YoY
- ▼ -1213.53%
- Current HPI
- 421.2037
- Rent YoY
- ▲ 1.50%
- Metro
- Los Angeles-Long Beach-Anaheim, CA
- State GDP YoY
- ▲ 3.21%
- F500 in state
- 116
Industry mix (Fortune 500 HQ in CA)
| Industry | F500 HQs | Revenue |
|---|---|---|
| Technology | 27 | $1,492B |
|
||
| Financial Services | 3 | $174B |
|
||
| Retail | 3 | $44B |
|
||
| Insurance | 3 | $26B |
|
||
| Media / Entertainment | 2 | $115B |
|
||
| Pharmaceuticals / Biotech | 2 | $62B |
|
||
Price history
-12.8% since first listed6 events — show timeline
- 2026-06-17 Listed $435,000 CRMLS
- 2026-03-06 Listed for Rent $2,900 APPFOLIO
- 2025-07-28 Rental Removed $1,990 PROPERTYWARE
- 2025-07-23 Listed for Rent $1,990 PROPERTYWARE
- 2024-10-18 Listing Removed — CRMLS
- 2024-05-17 Listed $499,000 CRMLS
Property tax history
+30.3%/yrLatest (2025): $93,647 · +1.5% YoY. Source: county tax records.
Cash-flow waterfall
monthlySold comps — $/sqft
last 12 mo · ≤1 miLoading sold comps…