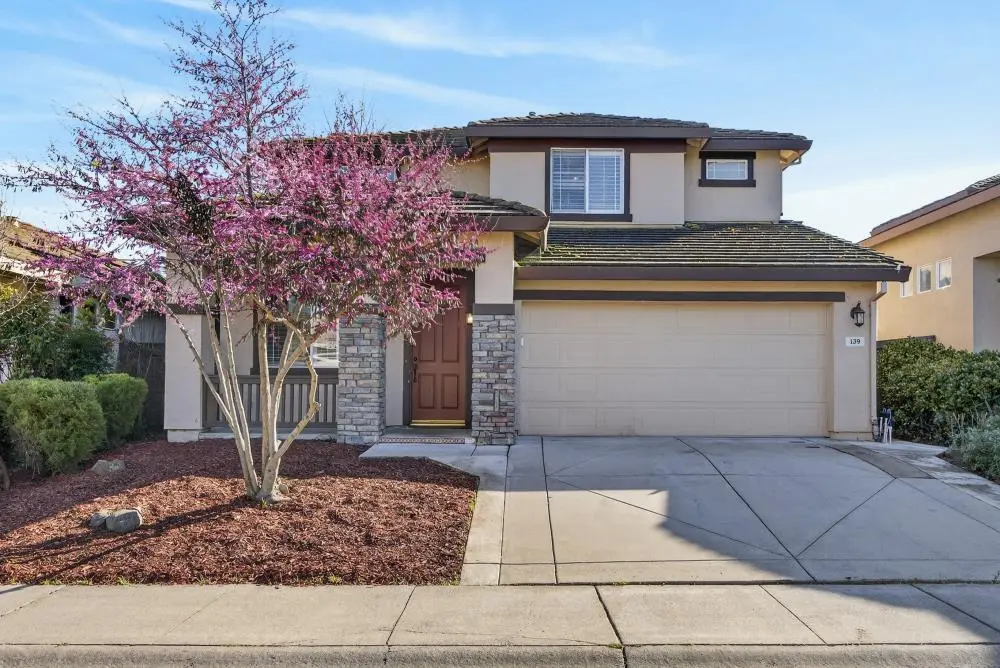
139 Ainger Cir · Sacramento, CA
Flood risk 1/10 · Minimal
- FEMA flood zone
- A99
- Chance of flooding over 30 yrs
- 0.0%
- Est. flood insurance / yr
- $1,009 – $1,996
Fire risk 6/10 · Moderate
- Est. fire insurance / yr
- $659 – $1,223
Heat risk 7/10 · Major
- Hot days now (above 102°F)
- 7 days/yr
- Hot days in 30 yrs
- 14 days/yr
Wind risk 1/10 · Minimal
- Chance of severe wind over 30 yrs
- —
Air-quality risk 10/10 · Severe
- Unhealthy air days now
- 29 days/yr
- Unhealthy air days in 30 yrs
- 33 days/yr
Risk factors via First Street. Map © Google.
Why this score? — see what drove the D grade
The composite is a weighted blend of 9 inputs, each scored 0–100. Each bar is that input's sub-score; the figure is the points it added to the 100-point composite (weight × sub-score).
- ARV discount +12.6/15.0
- Appreciation +9.6/10.0
- Cash flow +4.5/30.0
- Schools +4.1/10.0
- Livability +3.6/5.0
- Rent growth +2.9/5.0
- Condition / age +2.5/5.0
- 1% rule +0.6/10.0
- DSCR +0.0/10.0
$600,000
🖨 Deal sheet 📄 Offer letter ✓ Due diligence
Listing remarks
Welcome to Natomas Park! This 5 bedroom home features 2 bedrooms and a full bathroom downstairs- a very flexible floorplan for multigenerational living. Soaring ceilings, abundant natural light and crown molding give the home an airy, elevated feel. The open kitchen layout is perfect for entertaining. Upstairs, the primary suite is a peaceful space with a spa-like ensuite and an exceptionally large walk-in closet. Right out your front door, you are just steps from the greenbelt, with miles of interconnected walking and biking trails. Half a mile away, The Club at Natomas Park offers multiple pools, spas, a full fitness center, playground, lounge and a kid zone. Shopping, dining, and easy fr
Key facts
- Full fitness center
- Spa-like ensuite
- Large walk-in closet
Tags
Neighborhood map
What this means for you Summary
Snapshot
- This is a 5-bed/3.0-bath single-family listed at $600k.
Deal economics
- At list price, monthly cash flow is $-2k ($-20k/yr) — negative.
- To cash-flow at today's rent, offer at most $305k (49.2% below list).
- To meet the 1% rule (rent ≥ 1% of price), the offer needs to be $337k (43.8% below list).
- Recommended offer: $305k (49.2% below list) — sets the bar for cash-flow.
Location & tenants
- Location reads 71/100 on livability (#218 in CA) — a middle-class / working-renter tenant base. Strengths: amenities A+, commute A+, housing A; Watch: schools D+, crime F, cost of living F.
- Natomas Unified (urban): math 33% / reading 60% proficiency, ranked #155 of 517 in CA (top 30%) — families likely to look elsewhere, expect single-tenant / working-renter base with shorter leases.
- Market conditions: Rents rising (+1.4%/yr); 402 active listings in the ZIP; 10 comparable units currently listed for rent nearby; rentals leasing fast (median 2d on market — plan ~1-2 weeks tenant-placement turnaround); high-income renter base; 6,825 units permitted in Sacramento County in 2024 (1,752 in 5+ unit buildings).
- This rent runs 35% of the median local income ($114k/yr) — at the standard rent-burdened threshold; future hikes will face affordability resistance.
Forward outlook
- In year one you build about $59k of equity ($4k loan paydown + $55k appreciation (9.2% local appreciation)).
- Sacramento County population projected at +17% by 2050 — long-run rental-demand tailwind backs the buy-and-hold thesis.
- By year 2, paydown + projected appreciation supports a ~$95k cash-out refi (75% LTV) — recoverable capital for the next deal without selling this one.
Negotiation context
- It's been on market 90 days — a 6% lower offer ($564k) is reasonable based on typical stale-listing flexibility.
Risks & watch-outs
- Watch-outs: flood insurance adds $125/mo.
- Climate carrying-cost: in FEMA flood zone A99 (mandatory federal flood insurance); major wildfire risk; extreme-heat days projected 7→14/yr by 2055 (HVAC capex compounding) — expect insurance premiums to compound above CPI over the hold.
Questions for the listing agent
- What do current leases actually rent for vs. the listed asking? Can we see a recent rent roll and the last 12 months of T-12 income?
- It's been on market 90 days. Have you received any prior offers? Is the seller open to a 49% concession, seller financing, or rate buy-down credit?
- What's the actual annual flood-insurance premium (NFIP or private), and is the property in a SFHA with mandatory coverage?
- What does the HOA fee cover, when was the last increase, and are there any pending special assessments or reserve-fund shortfalls?
- Why hasn't it sold? Are there any deal-killer items the seller is aware of (foundation, flood, title, zoning, code violations)?
- Is there a deadline driving the sale (1031 exchange, divorce, estate, relocation)? That informs how much negotiation room exists.
- Schools are D-rated, which usually means shorter tenancies and higher turnover. Who's the typical renter profile here, and what's been the actual vacancy rate?
- Crime grade is F in this area — have there been break-ins, vandalism, or insurance claims at this property in the last 3 years? What carrier currently insures it and at what premium?
- The area grade is low — what's the realistic commute time and amenity access for the typical tenant pool here? Any planned neighborhood developments (good or bad) we should know about?
- What's the average days-on-market for RENTAL listings here right now (not sales)? A rising rental-DOM trend means longer vacancies and softer asking-rent achievability than the comps imply.
- What's the recent tenant-quality profile in this submarket — average credit score on applications, eviction rate, late-payment / NSF rate, and stable-employment percentage? A property-management company in the area should have these aggregated.
- How much new for-sale + rental construction is in the pipeline within 1–3 miles? Heavy new supply typically softens prices + rents 12–24 months out; constrained supply supports both.
Investment metrics
- 1% rule
- 0.56% ✗
- Cap rate
- 3.20%
- Cash-on-cash
- -11.04%
- DSCR
- 0.51
- GRM
- 14.8
CMA / ARV
- ARV (median comp)
- $677,288
- List price
- $600,000
- Delta
- -11.41%
- Verdict
- UNDERPRICED
- Comps
- 20 within 1.0 mi
Show comp detail 12 sales within ~0.75 mi
| Address | Dist | Beds/Ba | Sqft | Sold | Price | $/sf | Match |
|---|---|---|---|---|---|---|---|
| 1959 Delafield Way | 0.27mi | 4/3.0 (-1) | 2,333 (-2%) | 0mo | $717,000 | $307 | 79 |
| 2136 Blackridge Ave | 0.13mi | 4/3.0 (-1) | 2,624 (+10%) | 4mo | $675,000 | $257 | 69 |
| 2154 New Hampshire Way | 0.30mi | 5/3.0 | 2,137 (-10%) | 0mo | $630,000 | $295 | 68 |
| 1789 S Itasca Ave | 0.67mi | 4/3.0 (-1) | 2,401 (+1%) | 4mo | $700,000 | $292 | 59 |
| 2136 Catherwood Way | 0.72mi | 4/3.0 (-1) | 2,362 (-1%) | 2mo | $620,000 | $262 | 58 |
| 5324 Dasco Way | 0.66mi | 4/3.0 (-1) | 2,347 (-2%) | 5mo | $615,000 | $262 | 58 |
| 5343 Dasco Way | 0.65mi | 4/2.5 (-1) | 2,325 (-2%) | 4mo | $605,000 | $260 | 55 |
| 100 Aviator Cir | 0.56mi | 4/3.0 (-1) | 2,632 (+10%) | 2mo | $645,000 | $245 | 50 |
| 31 Arches Cir | 0.52mi | 4/3.0 (-1) | 2,632 (+10%) | 4mo | $630,000 | $239 | 50 |
| 5333 Buckwood Way | 0.56mi | 4/2.5 (-1) | 2,149 (-10%) | 3mo | $629,990 | $293 | 48 |
| 1800 Clayton Way | 0.63mi | 5/2.5 | 2,069 (-13%) | 2mo | $545,000 | $263 | 45 |
| 2553 Cantara Ct | 0.74mi | 4/2.5 (-1) | 2,672 (+12%) | 4mo | $629,000 | $235 | 35 |
Match score weights: distance 35% · size 25% · config 20% · recency 20%. Top-matched comps best support the ARV.
Projected returns pro-forma
9.18% appreciation · 1.43% rent growth · sell at horizon
- IRR
- 13.7%
- Equity multiple
- 2.08×
- Total profit
- $182,088
- Equity at exit
- $505,210
- IRR
- 13.5%
- Equity multiple
- 4.59×
- Total profit
- $603,040
- Equity at exit
- $1,053,988
Cash invested: $168,000 (down + closing). Projections, not guarantees.
Landlord ↔ Tenant lean methodology
- Overall (STATE)
- 18 Strongly Tenant-Friendly
- State California
- 18 Strongly Tenant-Friendly · D+13
- County
- — inherits STATE
- City
- — inherits STATE
ZIP-level market 95835
- Home prices YoY
- 3.5%
- Rents YoY
- 1.4%
- Active inventory
- 402
- Price-to-rent
- 14.8×
Monthly cashflow live
- Estimated rent
- $3,372 high interval (Pro) →
- Mortgage (P&I)
- −$3,146
- Tax from tax record
- −$722 /mo · $8,665/yr
- Insurance
- −$250
- Flood insurance flood zone
- −$125 /mo · $1,502/yr
- HOA
- −$91
- Vacancy / Maint / Mgmt
- −$708
- Net cashflow
- $-1,671
Break-even live
UW: 25.0% down · 7.5% · 30yr · 1.5% tax · 5.0% vac · 8.0% maint · 8.0% mgmt
Financing live
Cash to close
- Down payment
- $150,000
- Closing costs
- $18,000
- Reserves months
- —
- Total cash needed
- —
Loan-product check · same deal, 3 products live
Conventional
25% down · 7.5% · 30yr
- Down + closing
- —
- Monthly P&I
- —
- Monthly cashflow
- —
- DSCR
- —
- Eligible?
- —
Personal DTI + credit; lowest rate.
DSCR
20% down · 8.5% · 30yr
- Down + closing
- —
- Monthly P&I
- —
- Monthly cashflow
- —
- DSCR
- —
- Eligible?
- —
No personal income docs; deal must DSCR.
Hard money
10% down · 12.0% · 12mo
- Down + closing
- —
- Monthly P&I
- —
- Monthly cashflow
- —
- DSCR
- —
- Eligible?
- —
Short-term bridge; refi at stabilization.
Rent comps 10 comps
| Address | Beds | Baths | Sqft | Rent | $/sqft | DOM | Units | Dist |
|---|---|---|---|---|---|---|---|---|
| 5317 Buckwood Way Sacramento, CA | 4.0 | 3.0 | 2030 | $3,050 | $1.50 | 2d | 1 | 0.51mi |
| 2157 Promise Way Sacramento, CA | 4.0 | 3.0 | 2493 | $2,995 | $1.20 | 2d | 1 | 0.61mi |
| 142 Mike Gartrell Cir Sacramento, CA | 4.0 | 3.0 | 2231 | $2,975 | $1.33 | 2d | 1 | 0.74mi |
| 4519 White Sage St Sacramento, CA | 4.0 | 3.0 | 2365 | $3,050 | $1.29 | 11d | 1 | 0.88mi |
| 5564 Celebration St Sacramento, CA | 4.0 | 3.0 | 2252 | $3,195 | $1.42 | 11d | 1 | 0.93mi |
| 170 Battlecreek Cir Sacramento, CA | 5.0 | 3.0 | 2500 | $3,095 | $1.24 | 2d | 1 | 1.00mi |
| 1700 Charm Way Sacramento, CA | 4.0 | 3.0 | 2250 | $2,595 | $1.15 | 2d | 1 | 1.04mi |
| 5040 Kankakee Dr Sacramento, CA | 4.0 | 2.0 | 2454 | $2,895 | $1.18 | 3d | 1 | 1.14mi |
| 100 Picasso Cir Sacramento, CA | 4.0 | 3.0 | 2413 | $3,950 | $1.64 | 3d | 1 | 1.39mi |
| 4470 Saone Walk Sacramento, CA | 3.0–4.0 | 2.5–3.5 | 1846 | $2,950 | $1.60 | 2d | 1 | 1.50mi |
HOA detail
- Monthly dues
- $91 · $1,092/yr
- Likely covers
- poolgym
Listing history 12 events
-
2026-06-10status $600,000 Pending 90 DOM
-
2026-06-09days on market $600,000 Active 90 DOM
-
2026-06-08days on market $600,000 Active 89 DOM
-
2026-06-07days on market $600,000 Active 88 DOM
-
2026-06-05days on market $600,000 Active 85 DOM
-
2026-06-03days on market $600,000 Active 84 DOM
-
2026-06-02days on market $600,000 Active 83 DOM
-
2026-06-01days on market $600,000 Active 82 DOM
-
2026-05-31days on market $600,000 Active 81 DOM
-
2022-09-13soldstatus $632,000
-
2015-06-22soldstatus $410,000
-
2000-07-06soldstatus $2,204,000
ⓘ Source: listings_history table (triggers on properties + properties_extension) + one-shot
backfill from property_details.listing_events for pre-trigger history.
Tax reassessment forecast CA · Resets to sale price
- Current annual tax
- $8,665 · $722/mo
- Projected year-2 tax
- $8,665 · $722/mo
- Expected delta
- $0/yr ($0/mo · 0.0%)
ⓘ Screening estimate from a state-policy table — verify with the county assessor before closing.
Climate risk First Street
- Flood 1/10 Low FEMA zone A99 · 0% chance over 30 yrs
- Wildfire 6/10 Major
- Heat 7/10 Severe 7 d/yr ≥102°F today · 14 d/yr by 30 yrs out
- Wind 1/10 Low
- Air quality 10/10 Extreme 29 unhealthy d/yr today · 33 by 30 yrs out
Nearby sold comps map
Loading sold comps map…
Walkable amenities ~0.75 mi
Loading nearby amenities…
Taxation est. · year 1
- Rental income
- $40,467
- − Mortgage interest
- −$33,609
- − Property taxes
- −$8,665
- − Insurance
- −$4,502
- − Repairs & maintenance
- −$3,237
- − Management
- −$3,237
- − HOA
- −$1,092
- − Depreciation
- −$17,455
- Taxable loss
- −$31,332
- Est. tax savings @ 24.0%
- +$7,520
- After-tax cash flow
- $-12,529/yr
For passive investors: Depreciation is non-cash, so a rental often shows a tax loss while cash-flowing — sheltering income. Rental losses are passive: they offset passive income freely, and up to $25,000/yr can offset ordinary (W-2) income if you actively participate and your MAGI is under $100k (phasing out to $0 by $150k); unused losses carry forward. On sale, claimed depreciation is recaptured at up to 25%, and gains may owe capital-gains tax (a 1031 exchange can defer both). Figures are a year-1 estimate at your 24.0% rate — not tax advice; consult a CPA.
Schools (NCES district)
- District
- Natomas Unified
- NCES district ID
- 0600036
- Math proficiency
- 33% ▼ -1.00%
- Reading proficiency
- 60% ▲ 13.00%
- Median HH income
- $67,969
- Composite
- 41.49/100
- National rank
- #3457
- State rank
- #155 of 517 in CA
Livability — Sacramento
- Score
- 71/100
- State rank
- #218
- US rank
- #6957
Category grades
Schools grade is shown separately in the Schools card above.
Census & demographics
- Census place
- Sacramento, CA
- County
- Sacramento County · 1,539,646 people
- City population
- 761,410
- Metro
- Sacramento-Roseville-Folsom, CA
- Population (ZIP)
- 42,004
- Household income
- $114,468
- Rent vs Own
- Severe rent burden
- 1234.0
Population outlook (Sacramento County) Hauer SSP2
- Today (2025)
- 1,660,763 people
- By 2030
- 1,732,990 · +4.3%
- By 2040
- 1,855,755 · +11.7%
- By 2050
- 1,941,335 · +16.9%
- By 2075
- 2,046,162 · +23.2%
- By 2100
- 1,961,444 · +18.1%
Race, ethnicity, and origin ACS 2023
- Neighborhood character
- Highly diverse neighborhood (Simpson 0.78)
- Race & ethnicity
- Asian 30% White 29% Hispanic / Latino 19% Two or more races 15% Black 13%
- Hispanic origin (detail)
- Mexican 15%
- Common ancestry
- Scotch-Irish 2% Italian 1% Romanian 1%
- Foreign-born
- 25% · China, Canada, Vietnam
- Languages at home
- 66% English-only · Other Indo-European 10% Spanish 8% Other Asian/Pacific 4%
Political lean MEDSL · Sacramento
- 2024 margin
- D (+19.7) · D 58.1% · R 38.4% · Other 3.5%
- 2008→2024 swing
- +0.7pp no change · 2008: 19.0pp · 2024: 19.7pp
- All cycles
- 2024: D+19.7 2020: D+25.3 2016: D+23.7 2012: D+16.3 2008: D+19.0
Not yet ingested
- Civics
- —
Market trends
- HPI YoY
- ▲ 9.18%
- Current HPI
- 271.4823
- Rent YoY
- ▲ 1.43%
- Metro
- Sacramento-Roseville-Folsom, CA
- State GDP YoY
- ▲ 3.21%
- F500 in state
- 116
Industry mix (Fortune 500 HQ in CA)
| Industry | F500 HQs | Revenue |
|---|---|---|
| Technology | 27 | $1,492B |
|
||
| Financial Services | 3 | $174B |
|
||
| Retail | 3 | $44B |
|
||
| Insurance | 3 | $26B |
|
||
| Media / Entertainment | 2 | $115B |
|
||
| Pharmaceuticals / Biotech | 2 | $62B |
|
||
Price history
-71.3% since first listed3 events — show timeline
- 2022-09-13 Sold (Public Records) $632,000 Public Records
- 2015-06-22 Sold (Public Records) $410,000 Public Records
- 2000-07-06 Sold (Public Records) $2,204,000 Public Records
Property tax history
+4.0%/yrLatest (2025): $8,665 · -3.8% YoY. Source: county tax records.
Cash-flow waterfall
monthlySold comps — $/sqft
last 12 mo · ≤1 miLoading sold comps…