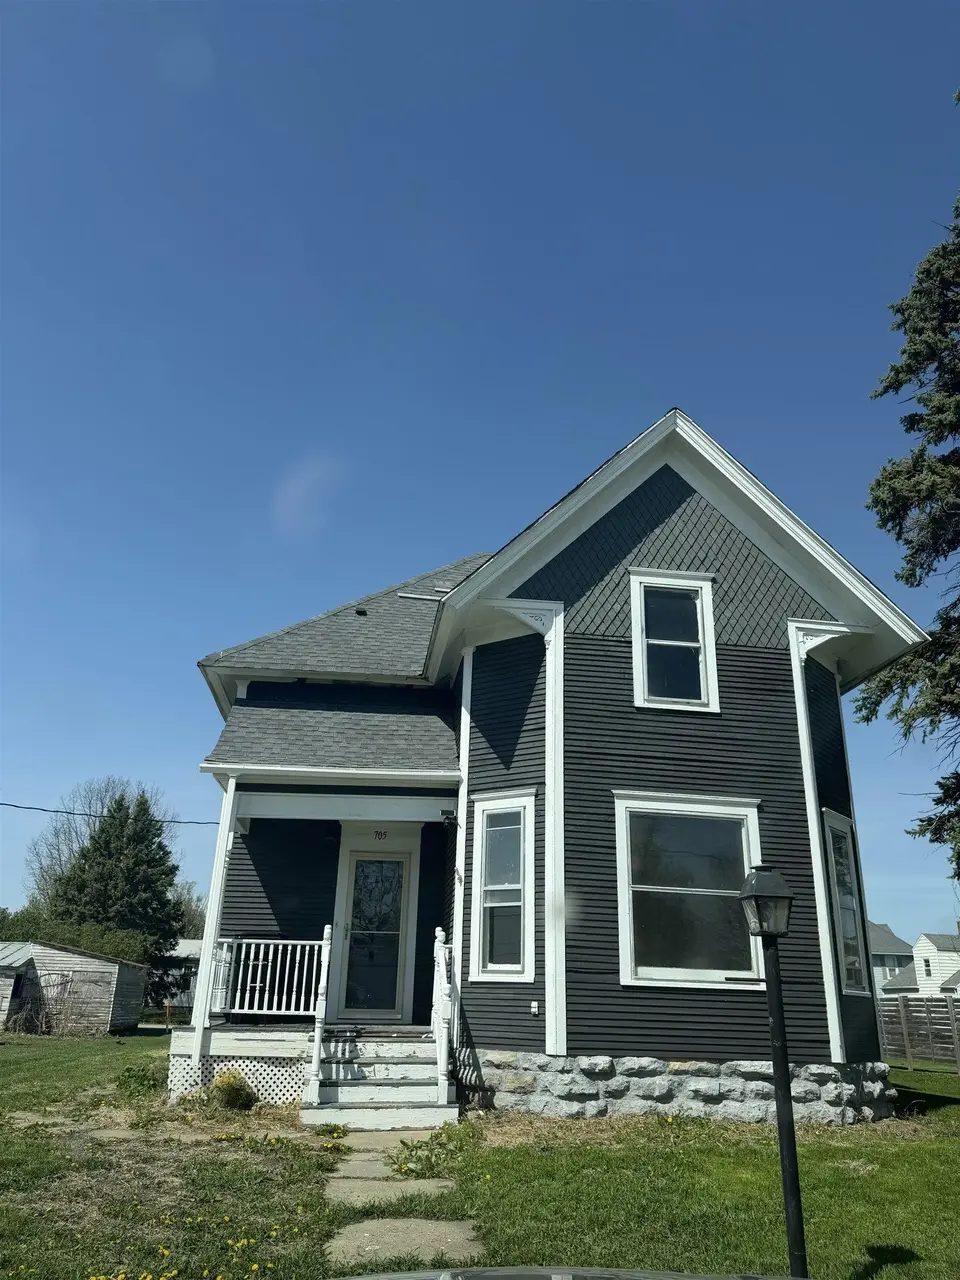
705 Crisman St · Dysart, IA
Flood risk 1/10 · Minimal
- FEMA flood zone
- X (unshaded)
- Chance of flooding over 30 yrs
- 0.0%
- Est. flood insurance / yr
- $473 – $860
Fire risk 1/10 · Minimal
- Est. fire insurance / yr
- $902 – $1,676
Heat risk 3/10 · Minor
- Hot days now (above 103°F)
- 7 days/yr
- Hot days in 30 yrs
- 15 days/yr
Wind risk 2/10 · Minimal
- Chance of severe wind over 30 yrs
- —
Air-quality risk 1/10 · Minimal
- Unhealthy air days now
- 0 days/yr
- Unhealthy air days in 30 yrs
- 0 days/yr
Risk factors via First Street. Map © Google.
Why this score? — see what drove the B grade
The composite is a weighted blend of 9 inputs, each scored 0–100. Each bar is that input's sub-score; the figure is the points it added to the 100-point composite (weight × sub-score).
- Cash flow +26.4/30.0
- DSCR +9.0/10.0
- ARV discount +7.5/15.0
- Appreciation +7.2/10.0
- 1% rule +6.9/10.0
- Schools +6.5/10.0
- Livability +3.9/5.0
- Rent growth +2.5/5.0
- Condition / age +2.5/5.0
$79,000
🖨 Deal sheet (PDF) 📄 Offer letter ✓ Due diligence
Listing remarks
GREAT LOCATION RIGHT ACROSS FROM THE PARK!! LOTS OF CHARACTER AND SOME TLC TO FINISH TO YOUR LIKING. There is an open stairway, original wood floors, pocket doors, living room, dining room, possible main floor bedroom with half bath or use as an office or toy room. Updated kitchen with appliances included, main floor laundry also. Upstairs offers 3 bedrooms and full bath, newer carpet upstairs also. Full basement that is unfinished with inside entrance. Call today for your private showing!!!! Cement slab also in back yard ready for a garage.
Key facts
- Pocket doors
- Open stairway
- Main floor laundry
Tags
Property features AI
Exterior
- Parking: No parking
- Utilities: Public water; Public sewer
- Home design: Single family residence; Residential property; R-1 zoning; Level lot
- Construction: Wood siding; Asphalt roof
- Exterior features: Covered deck
Interior
- Kitchen: Built-in range; Range; Dishwasher; Refrigerator
- Bathrooms: 1 full bathroom; 1 half bathroom
- Heating & cooling: Baseboard heating; Electric heating; Steam heating; Ceiling fan(s) for cooling
- Interior features: Eat-in kitchen; Unfinished basement with interior entry
- Laundry & utility: Main level laundry room
Neighborhood map
What this means for you Summary
Snapshot
- This is a 3-bed/1.5-bath single-family listed at $79k.
Deal economics
- At list price, monthly cash flow is $205 ($2k/yr) — positive.
- The deal already cash-flows at list — no discount required.
- Meets the 1% rule at list price ($942 rent vs $79k).
- Recommended offer: $77k (3.0% below list) — sets the bar for market timing.
Location & tenants
- Location reads 77/100 on livability (#158 in IA, #2,881 nationally) — a middle-class / working-renter tenant base. Strengths: crime A+, cost of living A+, housing A+; Watch: employment C-, amenities F, commute F.
- Union Community School District (rural): math 77% / reading 75% proficiency, ranked #53 of 289 in IA (top 18%) — strong family-tenant draw, lease renewals of 3-5y typical; only 20% free/reduced lunch — higher-income household profile.
- Zoned schools: La Porte City Elementary School (math 92% / reading 82%, grade A+, #16 of 616 statewide, top 3%, 273 students, 23% FRL); Union High School (math 69% / reading 75%, grade B+, #117 of 336 statewide, top 39%, 316 students, 28% FRL).
- Market conditions: 27 active listings in the ZIP; 17 units permitted in Tama County in 2024 (0 in 5+ unit buildings).
Forward outlook
- In year one you build about $4k of equity ($546 loan paydown + $3k appreciation (4.4% local appreciation)).
- Tama County population projected at -15% by 2050 — secular population decline; favor cash flow + early exit over multi-decade hold.
- At projected returns (4.4% appreciation + 3.0% rent growth), your $22k cash investment doubles in ~4 years — after that, you're playing with house money.
- By year 8, paydown + projected appreciation supports a ~$30k cash-out refi (75% LTV) — recoverable capital for the next deal without selling this one.
Negotiation context
- It's been on market 57 days — a 3% lower offer ($77k) is reasonable based on typical stale-listing flexibility.
- Current owner paid $55k; 44% above their basis — modest negotiation headroom, anchor on the comps not their cost.
Risks & watch-outs
- Watch-outs: built in 1900 — expect roof / HVAC / electrical / plumbing capex.
Questions for the listing agent
- It's been on market 57 days. Have you received any prior offers? Is the seller open to a 3% concession, seller financing, or rate buy-down credit?
- Built in 1900 — when were the roof, HVAC, electrical panel, plumbing, and water heater last replaced?
- Is there a deadline driving the sale (1031 exchange, divorce, estate, relocation)? That informs how much negotiation room exists.
- Schools are A-rated — typically a magnet for longer-tenancy family renters. What's the average tenant stay here, and is there a school-zone premium baked into asking?
- What's the average days-on-market for RENTAL listings here right now (not sales)? A rising rental-DOM trend means longer vacancies and softer asking-rent achievability than the comps imply.
- What's the recent tenant-quality profile in this submarket — average credit score on applications, eviction rate, late-payment / NSF rate, and stable-employment percentage? A property-management company in the area should have these aggregated.
- How much new for-sale + rental construction is in the pipeline within 1–3 miles? Heavy new supply typically softens prices + rents 12–24 months out; constrained supply supports both.
Investment metrics
- 1% rule
- 1.19% ✓
- Cap rate
- 9.41%
- Cash-on-cash
- 11.14%
- DSCR
- 1.50
- GRM
- 7.0
CMA / ARV
No comps found within radius.
Projected returns pro-forma
4.4% appreciation · 3.0% rent growth · sell at horizon
- IRR
- 21.2%
- Equity multiple
- 2.29×
- Total profit
- $28,644
- Equity at exit
- $41,940
- IRR
- 21.2%
- Equity multiple
- 4.47×
- Total profit
- $76,658
- Equity at exit
- $70,147
Cash invested: $22,120 (down + closing). Projections, not guarantees.
Landlord ↔ Tenant lean methodology
- Overall (STATE)
- 83 Strongly Landlord-Friendly
- State Iowa
- 83 Strongly Landlord-Friendly · R+6
- County
- — inherits STATE
- City
- — inherits STATE
ZIP-level market 52224
- Home prices YoY
- 2.6%
- Active inventory
- 27
- Price-to-rent
- 7.0×
Monthly cashflow live
- Estimated rent
- $942 medium interval (Pro) →
- Mortgage (P&I)
- −$414
- Tax from tax record
- −$91 /mo · $1,094/yr
- Insurance
- −$33
- HOA
- −$0
- Vacancy / Maint / Mgmt
- −$198
- Net cashflow
- $205
Break-even live
Sensitivity live
| Price | -10% $250 | -5% $228 | +0% $205 | +5% $183 | +10% $161 |
|---|---|---|---|---|---|
| Rent | -10% $131 | -5% $168 | +0% $205 | +5% $243 | +10% $280 |
| Rate | -1.0pp $245 | -0.5pp $226 | base $205 | +0.5pp $185 | +1.0pp $164 |
UW: 25.0% down · 7.5% · 30yr · 1.5% tax · 5.0% vac · 8.0% maint · 8.0% mgmt
Financing live
Cash to close
- Down payment
- $19,750
- Closing costs
- $2,370
- Reserves months
- —
- Total cash needed
- —
Loan-product check · same deal, 3 products live
Conventional
25% down · 7.5% · 30yr
- Down + closing
- —
- Monthly P&I
- —
- Monthly cashflow
- —
- DSCR
- —
- Eligible?
- —
Personal DTI + credit; lowest rate.
DSCR
20% down · 8.5% · 30yr
- Down + closing
- —
- Monthly P&I
- —
- Monthly cashflow
- —
- DSCR
- —
- Eligible?
- —
No personal income docs; deal must DSCR.
Hard money
10% down · 12.0% · 12mo
- Down + closing
- —
- Monthly P&I
- —
- Monthly cashflow
- —
- DSCR
- —
- Eligible?
- —
Short-term bridge; refi at stabilization.
Listing history 18 events
-
2026-06-19days on market $79,000 Active 57 DOM
-
2026-06-18days on market $79,000 Active 56 DOM
-
2026-06-17days on market $79,000 Active 55 DOM
-
2026-06-16days on market $79,000 Active 54 DOM
-
2026-06-15days on market $79,000 Active 53 DOM
-
2026-06-14days on market $79,000 Active 51 DOM
-
2026-06-13pricedays on market $79,000 Active 50 DOM
-
2026-06-10days on market $99,000 Active 48 DOM
-
2026-06-09days on market $99,000 Active 47 DOM
-
2026-06-08days on market $99,000 Active 46 DOM
-
2026-06-07days on market $99,000 Active 45 DOM
-
2026-06-02days on market $99,000 Active 40 DOM
-
2026-06-01days on market $99,000 Active 39 DOM
-
2026-05-31days on market $99,000 Active 38 DOM
-
2026-05-30days on market $99,000 Active 37 DOM
-
2026-04-23$99,000 Active 549-char remark
-
2026-02-25price $125,000
-
2025-08-26soldstatus $55,000
ⓘ Source: listings_history table (triggers on properties + properties_extension) + one-shot
backfill from property_details.listing_events for pre-trigger history.
Tax reassessment forecast IA · Partial reset (capped growth)
- Current annual tax
- $1,094 · $91/mo
- Projected year-2 tax
- $1,167 · $97/mo
- Expected delta
- +$73/yr (+$6/mo · 6.7%)
ⓘ Screening estimate from a state-policy table — verify with the county assessor before closing.
Climate risk First Street
- Flood 1/10 Low FEMA zone X (unshaded) · 0% chance over 30 yrs
- Wildfire 1/10 Low
- Heat 3/10 Moderate 7 d/yr ≥103°F today · 15 d/yr by 30 yrs out
- Wind 2/10 Low
- Air quality 1/10 Low 0 unhealthy d/yr today · 0 by 30 yrs out
Nearby sold comps map
Loading sold comps map…
Walkable amenities ~0.75 mi
Loading nearby amenities…
Taxation est. · year 1
- Rental income
- $11,298
- − Mortgage interest
- −$4,425
- − Property taxes
- −$1,094
- − Insurance
- −$395
- − Repairs & maintenance
- −$904
- − Management
- −$904
- − Depreciation
- −$2,298
- Taxable income
- $1,278
- Est. tax owed @ 24.0%
- −$307
- After-tax cash flow
- $2,158/yr
For passive investors: Depreciation is non-cash, so a rental often shows a tax loss while cash-flowing — sheltering income. Rental losses are passive: they offset passive income freely, and up to $25,000/yr can offset ordinary (W-2) income if you actively participate and your MAGI is under $100k (phasing out to $0 by $150k); unused losses carry forward. On sale, claimed depreciation is recaptured at up to 25%, and gains may owe capital-gains tax (a 1031 exchange can defer both). Figures are a year-1 estimate at your 24.0% rate — not tax advice; consult a CPA.
Schools (NCES district)
- District
- Union Community School District
- NCES district ID
- 1900022
- Math proficiency
- 77% ▼ -3.00%
- Reading proficiency
- 75% ▲ 2.00%
- Median HH income
- $58,114
- Composite
- 65.13/100
- National rank
- #496
- State rank
- #53 of 289 in IA
Livability — Dysart
- Score
- 77/100
- State rank
- #158
- US rank
- #2881
Category grades
Schools grade is shown separately in the Schools card above.
Census & demographics
- Census place
- Dysart, IA
- Population (ZIP)
- 1,954
Population outlook (Tama County) Hauer SSP2
- Today (2025)
- 16,690 people
- By 2030
- 16,217 · -2.8%
- By 2040
- 15,207 · -8.9%
- By 2050
- 14,186 · -15.0%
- By 2075
- 12,228 · -26.7%
- By 2100
- 10,386 · -37.8%
Race, ethnicity, and origin ACS 2023
- Neighborhood character
- Predominantly White (94%)
- Race & ethnicity
- White 94% Asian 3% Two or more races 2% Black 1%
- Common ancestry
- Iranian 2% Romanian 2% Italian 2%
- Foreign-born
- 3% · China
Political lean MEDSL · Tama
- 2024 margin
- Strong R (+26.9) · D 35.7% · R 62.6% · Other 1.7%
- 2008→2024 swing
- -39.1pp toward R · 2008: 12.2pp · 2024: -26.9pp
- All cycles
- 2024: R+26.9 2020: R+19.1 2016: R+20.6 2012: D+7.4 2008: D+12.2
Not yet ingested
- Civics
- —
Market trends
- HPI YoY
- ▲ 4.40%
- Current HPI
- 174.1922
- Rent YoY
- —
- Metro
- —
- State GDP YoY
- ▲ 2.48%
- F500 in state
- 4
Industry mix (Fortune 500 HQ in IA)
| Industry | F500 HQs | Revenue |
|---|---|---|
| Financial Services | 1 | $16B |
|
||
| Retail / Convenience | 1 | $15B |
|
||
Price history
+43.6% since first listed4 events — show timeline
- 2026-06-10 Price Changed $79,000 NEIRBR as distributed by MLS GRID
- 2026-04-23 Listed $99,000 NEIRBR as distributed by MLS GRID
- 2026-02-25 Price Changed $125,000 NEIRBR as distributed by MLS GRID
- 2025-08-26 Sold (Public Records) $55,000 Public Records
Property tax history
+1.2%/yrLatest (2025): $1,094 · +29.0% YoY. Source: county tax records.
Cash-flow waterfall
monthlySold comps — $/sqft
last 12 mo · ≤1 miLoading sold comps…