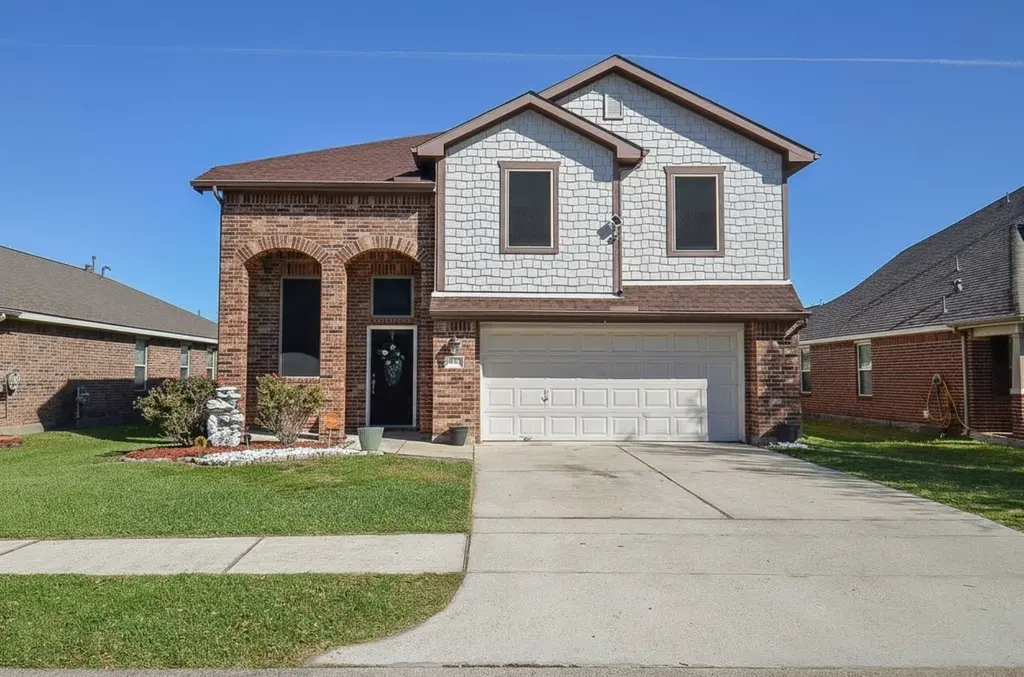
5411 Rio Dr · Baytown, TX
Flood risk 1/10 · Minimal
- FEMA flood zone
- X (unshaded)
- Chance of flooding over 30 yrs
- 0.0%
- Est. flood insurance / yr
- $507 – $1,088
Fire risk 4/10 · Minor
- Est. fire insurance / yr
- $1,222 – $2,270
Heat risk 9/10 · Severe
- Hot days now (above 110°F)
- 7 days/yr
- Hot days in 30 yrs
- 26 days/yr
Wind risk 9/10 · Severe
- Chance of severe wind over 30 yrs
- 99.0%
Air-quality risk 2/10 · Minimal
- Unhealthy air days now
- 1 days/yr
- Unhealthy air days in 30 yrs
- 2 days/yr
Risk factors via First Street. Map © Google.
Why this score? — see what drove the D- grade
The composite is a weighted blend of 9 inputs, each scored 0–100. Each bar is that input's sub-score; the figure is the points it added to the 100-point composite (weight × sub-score).
- ARV discount +11.2/15.0
- Cash flow +9.5/30.0
- 1% rule +4.3/10.0
- Livability +3.5/5.0
- Schools +3.2/10.0
- Rent growth +2.9/5.0
- DSCR +2.7/10.0
- Condition / age +2.5/5.0
- Appreciation +0.0/10.0
$254,900
🖨 Deal sheet 📄 Offer letter ✓ Due diligence
Listing remarks MLS
This Home, located in the quiet Highlands Ranch subdivision of Baytown, is a spacious and well-designed two-story traditional residence that offers a generous layout ideal for both daily living and hosting guests, seamlessly balancing comfort with modern functionality. The two-story foyer creates an immediate sense of openness and light. The large family room serves as the heart of the home and the open-concept kitchen makes it a functional space for any home chef. The second floor primary suite includes a large walk-in closet and a private en-suite bathroom. A unique highlight of this property is the main level additional bonus room, versatile enough to serve as a media room, home office, or game room. The fully fenced backyard features two storage sheds and an above ground pool. E F Green Junior School is within walking distance and it's a short drive to Goose Creek Memorial High School. Shopping and recreation are conveniently close. Come See, Come Buy!
Key facts
- 5,641 sq ft lot
- 2 garage spots
- Pool
Neighborhood map
What this means for you Summary
Snapshot
- This is a 4-bed/2.5-bath single-family listed at $255k.
Deal economics
- At list price, monthly cash flow is $-176 ($-2k/yr) — negative.
- To cash-flow at today's rent, offer at most $224k (12.2% below list).
- To meet the 1% rule (rent ≥ 1% of price), the offer needs to be $236k (7.5% below list).
- Recommended offer: $224k (12.2% below list) — sets the bar for cash-flow.
- Cap rate 5.5% vs local median 4.2% in Baytown — meaningfully above typical; check what's discounted (condition, days-on-market, listing class) to confirm the premium yield is real.
Location & tenants
- Location reads 69/100 on livability (#412 in TX) — a middle-class / working-renter tenant base. Strengths: cost of living A+, housing A+; Watch: schools D+, employment D+, crime F.
- Goose Creek CISD (urban): math 37% / reading 36% proficiency, ranked #473 of 826 in TX (top 57%) — families likely to look elsewhere, expect single-tenant / working-renter base with shorter leases; 61% free/reduced lunch — lower-income household profile, screen leases tightly.
- Market conditions: Rents rising (+1.5%/yr); 612 active listings in the ZIP; 9 comparable units currently listed for rent nearby; rentals at typical pace (median 17d on market — plan ~3-4 weeks tenant-placement turnaround); 29,883 units permitted in Harris County in 2024 (8,621 in 5+ unit buildings).
- This rent runs 38% of the median local income ($74k/yr) — at the standard rent-burdened threshold; future hikes will face affordability resistance.
Forward outlook
- Local home prices are declining (-3.0%/yr); year-one equity from $2k of loan paydown is wiped out by about $8k of value loss. Plan a longer hold.
- Harris County population projected at +47% by 2050 — long-run rental-demand tailwind backs the buy-and-hold thesis.
Negotiation context
- It's been on market 84 days — a 6% lower offer ($240k) is reasonable based on typical stale-listing flexibility.
- 3 sale attempts since 17y ago with the ask held roughly flat each time — persistent listings suggest the price (not the market) is what's stuck; bring a comps-based counter.
Risks & watch-outs
- Watch-outs: property tax is 2.7% of price.
- Climate carrying-cost: severe wind risk, 99% chance of damaging wind over 30y; extreme-heat days projected 7→26/yr by 2055 (HVAC capex compounding) — expect insurance premiums to compound above CPI over the hold.
Questions for the listing agent
- What do current leases actually rent for vs. the listed asking? Can we see a recent rent roll and the last 12 months of T-12 income?
- It's been on market 84 days. Have you received any prior offers? Is the seller open to a 12% concession, seller financing, or rate buy-down credit?
- Property tax is high relative to price — has the assessment been appealed recently, and will the sale trigger a re-assessment?
- What does the HOA fee cover, when was the last increase, and are there any pending special assessments or reserve-fund shortfalls?
- Why hasn't it sold? Are there any deal-killer items the seller is aware of (foundation, flood, title, zoning, code violations)?
- Is there a deadline driving the sale (1031 exchange, divorce, estate, relocation)? That informs how much negotiation room exists.
- Schools are D-rated, which usually means shorter tenancies and higher turnover. Who's the typical renter profile here, and what's been the actual vacancy rate?
- Crime grade is F in this area — have there been break-ins, vandalism, or insurance claims at this property in the last 3 years? What carrier currently insures it and at what premium?
- The area grade is low — what's the realistic commute time and amenity access for the typical tenant pool here? Any planned neighborhood developments (good or bad) we should know about?
- What's the average days-on-market for RENTAL listings here right now (not sales)? A rising rental-DOM trend means longer vacancies and softer asking-rent achievability than the comps imply.
- What's the recent tenant-quality profile in this submarket — average credit score on applications, eviction rate, late-payment / NSF rate, and stable-employment percentage? A property-management company in the area should have these aggregated.
- How much new for-sale + rental construction is in the pipeline within 1–3 miles? Heavy new supply typically softens prices + rents 12–24 months out; constrained supply supports both.
Investment metrics
- 1% rule
- 0.93% ✗
- Cap rate
- 5.46%
- Cash-on-cash
- -2.96%
- DSCR
- 0.87
- GRM
- 9.0
CMA / ARV
- ARV (median comp)
- $278,052
- List price
- $254,900
- Delta
- -8.33%
- Verdict
- FAIR
- Comps
- 20 within 1.0 mi
Show comp detail 12 sales within ~0.75 mi
| Address | Dist | Beds/Ba | Sqft | Sold | Price | $/sf | Match |
|---|---|---|---|---|---|---|---|
| 5358 Pompano Loop | 0.35mi | 4/3.5 | 2,795 (+3%) | 2mo | $411,990 | $147 | 73 |
| 5422 Rio Dr | 0.04mi | 4/2.5 | 2,349 (-14%) | 3mo | $255,000 | $109 | 73 |
| 5423 Kingfish Dr | 0.49mi | 4/3.0 | 2,731 (+0%) | 2mo | $395,990 | $145 | 73 |
| 5506 Sailfish Dr | 0.35mi | 4/3.0 | 2,548 (-6%) | 1mo | $397,990 | $156 | 71 |
| 5407 Kingfish Dr | 0.47mi | 4/3.5 | 2,666 (-2%) | 2mo | $397,990 | $149 | 69 |
| 9222 Southern Stingray Dr | 0.49mi | 4/3.5 | 2,666 (-2%) | 3mo | $402,990 | $151 | 68 |
| 5411 Kingfish Dr | 0.48mi | 4/3.5 | 2,795 (+3%) | 2mo | $408,990 | $146 | 68 |
| 8814 Ruddy Duck Ct | 0.55mi | 4/2.5 | 2,516 (-7%) | 2mo | $305,000 | $121 | 60 |
| 5415 Kingfish Dr | 0.48mi | 3/2.0 (-1) | 2,517 (-7%) | 2mo | $382,990 | $152 | 56 |
| 5515 Kingfish Dr | 0.49mi | 3/2.5 (-1) | 2,386 (-12%) | 2mo | $382,990 | $161 | 50 |
| 8014 Safflower Dr | 0.64mi | 4/2.5 | 2,375 (-13%) | 2mo | $250,000 | $105 | 48 |
| 9022 Bay Lodge Ln | 0.72mi | 4/2.5 | 2,337 (-14%) | 0mo | $304,760 | $130 | 43 |
Match score weights: distance 35% · size 25% · config 20% · recency 20%. Top-matched comps best support the ARV.
Projected returns pro-forma
-3.0% appreciation · 1.48% rent growth · sell at horizon
- IRR
- -23.1%
- Equity multiple
- 0.22×
- Total profit
- $-55,877
- Equity at exit
- $38,006
- IRR
- -22.9%
- Equity multiple
- -0.07×
- Total profit
- $-76,415
- Equity at exit
- $22,039
Cash invested: $71,372 (down + closing). Projections, not guarantees.
Landlord ↔ Tenant lean methodology
- Overall (STATE)
- 87 Strongly Landlord-Friendly
- State Texas
- 87 Strongly Landlord-Friendly · R+5
- County
- — inherits STATE
- City
- — inherits STATE
ZIP-level market 77521
- Rents YoY
- 1.5%
- Active inventory
- 612
- Price-to-rent
- 9.0×
Monthly cashflow live
- Estimated rent
- $2,359 high interval (Pro) →
- Mortgage (P&I)
- −$1,337
- Tax from tax record
- −$570 /mo · $6,837/yr
- Insurance
- −$106
- HOA
- −$27
- Vacancy / Maint / Mgmt
- −$495
- Net cashflow
- $-176
Break-even live
UW: 25.0% down · 7.5% · 30yr · 1.5% tax · 5.0% vac · 8.0% maint · 8.0% mgmt
Financing live
Cash to close
- Down payment
- $63,725
- Closing costs
- $7,647
- Reserves months
- —
- Total cash needed
- —
Loan-product check · same deal, 3 products live
Conventional
25% down · 7.5% · 30yr
- Down + closing
- —
- Monthly P&I
- —
- Monthly cashflow
- —
- DSCR
- —
- Eligible?
- —
Personal DTI + credit; lowest rate.
DSCR
20% down · 8.5% · 30yr
- Down + closing
- —
- Monthly P&I
- —
- Monthly cashflow
- —
- DSCR
- —
- Eligible?
- —
No personal income docs; deal must DSCR.
Hard money
10% down · 12.0% · 12mo
- Down + closing
- —
- Monthly P&I
- —
- Monthly cashflow
- —
- DSCR
- —
- Eligible?
- —
Short-term bridge; refi at stabilization.
Rent comps 9 comps
| Address | Beds | Baths | Sqft | Rent | $/sqft | DOM | Units | Dist |
|---|---|---|---|---|---|---|---|---|
| 5426 Cinnamon Lake Dr Baytown, TX | 4.0 | 2.5 | 2240 | $2,200 | $0.98 | 43d | 1 | 0.63mi |
| 4606 Wild Flora Way Baytown, TX | 4.0 | 2.0 | 2279 | $2,366 | $1.04 | 12d | 1 | 0.65mi |
| 8110 Berkely Ct Baytown, TX | 4.0 | 2.0 | 1828 | $1,946 | $1.06 | 5d | 1 | 0.67mi |
| 6102 Bayou Birch Ln Baytown, TX | 4.0 | 2.5 | 2709 | $2,750 | $1.02 | 24d | 1 | 0.75mi |
| 8002 Sesame St Baytown, TX | 3.0 | 2.0 | 1819 | $2,100 | $1.15 | 17d | 1 | 0.75mi |
| 4510 Red Yucca Dr Baytown, TX | 5.0 | 3.0 | 2779 | $2,650 | $0.95 | 1d | 1 | 0.75mi |
| 8026 Rosemary Dr Baytown, TX | 4.0 | 2.5 | 2390 | $2,150 | $0.90 | 43d | 1 | 0.81mi |
| 9502 Brookside Point Dr Baytown, TX | 4.0 | 3.0 | 2119 | $2,800 | $1.32 | 43d | 1 | 1.09mi |
| 4306 Apple Ln Baytown, TX | 4.0 | 3.5 | 2713 | $2,446 | $0.90 | 5d | 1 | 1.18mi |
HOA detail
- Monthly dues
- $27 · $324/yr
- Likely covers
- pool
Listing history 21 events
-
2026-06-18days on market $254,900 Active 84 DOM
-
2026-06-17days on market $254,900 Active 83 DOM
-
2026-06-16days on market $254,900 Active 82 DOM
-
2026-06-15days on market $254,900 Active 81 DOM
-
2026-06-13days on market $254,900 Active 79 DOM
-
2026-06-09days on market $254,900 Active 75 DOM
-
2026-06-07pricedays on market $254,900 Active 73 DOM
-
2026-06-04days on market $264,900 Active 70 DOM
-
2026-06-03days on market $264,900 Active 69 DOM
-
2026-06-02days on market $264,900 Active 68 DOM
-
2026-06-01days on market $264,900 Active 67 DOM
-
2026-05-31days on market $264,900 Active 66 DOM
-
2026-03-26$264,900 Active 970-char remark
Show marketing remark (970 chars)
This Home, located in the quiet Highlands Ranch subdivision of Baytown, is a spacious and well-designed two-story traditional residence that offers a generous layout ideal for both daily living and hosting guests, seamlessly balancing comfort with modern functionality. The two-story foyer creates an immediate sense of openness and light. The large family room serves as the heart of the home and the open-concept kitchen makes it a functional space for any home chef. The second floor primary suite includes a large walk-in closet and a private en-suite bathroom. A unique highlight of this property is the main level additional bonus room, versatile enough to serve as a media room, home office, or game room. The fully fenced backyard features two storage sheds and an above ground pool. E F Green Junior School is within walking distance and it's a short drive to Goose Creek Memorial High School. Shopping and recreation are conveniently close. Come See, Come Buy!
-
2018-10-04soldstatus
-
2018-10-03soldstatus Sold 530-char remark
Show marketing remark (530 chars)
Beautiful Chesmar Homes Dempsey Plan. 4/2.5/2. 2-story foyer, Large family room overlooks covered patio. Open kitchen w/ breakfast area, formal dining, utility room up. Master up & bathroom w/ large walk-in closet. 42-in. Cabinets, solid surface Gibraltar c-tops, plush friese carpet. Energy Star Certified Diamond Green Environments for Living Home! Ready Now!! Home has been well loved. Additional bonus room added that can be used as a man cave, game room or TV room. Two Sheds stay. One is fully decked with electricity.
-
2018-09-08status Pending 530-char remark
Show marketing remark (530 chars)
Beautiful Chesmar Homes Dempsey Plan. 4/2.5/2. 2-story foyer, Large family room overlooks covered patio. Open kitchen w/ breakfast area, formal dining, utility room up. Master up & bathroom w/ large walk-in closet. 42-in. Cabinets, solid surface Gibraltar c-tops, plush friese carpet. Energy Star Certified Diamond Green Environments for Living Home! Ready Now!! Home has been well loved. Additional bonus room added that can be used as a man cave, game room or TV room. Two Sheds stay. One is fully decked with electricity.
-
2018-09-03status Option Pending 530-char remark
Show marketing remark (530 chars)
Beautiful Chesmar Homes Dempsey Plan. 4/2.5/2. 2-story foyer, Large family room overlooks covered patio. Open kitchen w/ breakfast area, formal dining, utility room up. Master up & bathroom w/ large walk-in closet. 42-in. Cabinets, solid surface Gibraltar c-tops, plush friese carpet. Energy Star Certified Diamond Green Environments for Living Home! Ready Now!! Home has been well loved. Additional bonus room added that can be used as a man cave, game room or TV room. Two Sheds stay. One is fully decked with electricity.
-
2018-08-17$205,000 Active 530-char remark
Show marketing remark (530 chars)
Beautiful Chesmar Homes Dempsey Plan. 4/2.5/2. 2-story foyer, Large family room overlooks covered patio. Open kitchen w/ breakfast area, formal dining, utility room up. Master up & bathroom w/ large walk-in closet. 42-in. Cabinets, solid surface Gibraltar c-tops, plush friese carpet. Energy Star Certified Diamond Green Environments for Living Home! Ready Now!! Home has been well loved. Additional bonus room added that can be used as a man cave, game room or TV room. Two Sheds stay. One is fully decked with electricity.
-
2009-04-30soldstatus
-
2009-04-27historical
-
2009-04-07$169,040
ⓘ Source: listings_history table (triggers on properties + properties_extension) + one-shot
backfill from property_details.listing_events for pre-trigger history.
Tax reassessment forecast TX · Resets to sale price
- Current annual tax
- $6,837 · $570/mo
- Projected year-2 tax
- $6,837 · $570/mo
- Expected delta
- $0/yr ($0/mo · 0.0%)
ⓘ Screening estimate from a state-policy table — verify with the county assessor before closing.
Climate risk First Street
- Flood 1/10 Low FEMA zone X (unshaded) · 0% chance over 30 yrs
- Wildfire 4/10 Moderate
- Heat 9/10 Extreme 7 d/yr ≥110°F today · 26 d/yr by 30 yrs out
- Wind 9/10 Extreme 99% chance of damaging wind over 30 yrs
- Air quality 2/10 Low 1 unhealthy d/yr today · 2 by 30 yrs out
Nearby sold comps map
Loading sold comps map…
Walkable amenities ~0.75 mi
Loading nearby amenities…
Taxation est. · year 1
- Rental income
- $28,306
- − Mortgage interest
- −$14,278
- − Property taxes
- −$6,837
- − Insurance
- −$1,274
- − Repairs & maintenance
- −$2,264
- − Management
- −$2,264
- − HOA
- −$324
- − Depreciation
- −$7,415
- Taxable loss
- −$6,353
- Est. tax savings @ 24.0%
- +$1,525
- After-tax cash flow
- $-590/yr
For passive investors: Depreciation is non-cash, so a rental often shows a tax loss while cash-flowing — sheltering income. Rental losses are passive: they offset passive income freely, and up to $25,000/yr can offset ordinary (W-2) income if you actively participate and your MAGI is under $100k (phasing out to $0 by $150k); unused losses carry forward. On sale, claimed depreciation is recaptured at up to 25%, and gains may owe capital-gains tax (a 1031 exchange can defer both). Figures are a year-1 estimate at your 24.0% rate — not tax advice; consult a CPA.
Schools (NCES district)
- District
- Goose Creek CISD
- NCES district ID
- 4821150
- Math proficiency
- 37% ▼ -11.00%
- Reading proficiency
- 36% ▼ -4.00%
- Median HH income
- $52,468
- Composite
- 31.84/100
- National rank
- #5877
- State rank
- #473 of 826 in TX
Livability — Baytown
- Score
- 69/100
- State rank
- #412
- US rank
- #8494
Category grades
Schools grade is shown separately in the Schools card above.
Census & demographics
- County
- Harris County · 4,702,590 people
- City population
- 135,579
- Metro
- Houston-The Woodlands-Sugar Land, TX
- Population (ZIP)
- 69,038
- Household income
- $73,629
- Rent vs Own
- Severe rent burden
- 2121.0
Population outlook (Harris County) Hauer SSP2
- Today (2025)
- 5,571,493 people
- By 2030
- 6,089,821 · +9.3%
- By 2040
- 7,142,806 · +28.2%
- By 2050
- 8,185,864 · +46.9%
- By 2075
- 10,574,329 · +89.8%
- By 2100
- 12,109,958 · +117.4%
Race, ethnicity, and origin ACS 2023
- Neighborhood character
- Diverse neighborhood (Simpson 0.64)
- Race & ethnicity
- Hispanic / Latino 50% White 28% Two or more races 18% Black 17% Asian 3%
- Hispanic origin (detail)
- Mexican 42% Puerto Rican 2%
- Common ancestry
- Lithuanian 2% Slovak 1%
- Foreign-born
- 20% · Canada, Vietnam
- Languages at home
- 59% English-only · Spanish 36% French/Haitian/Cajun 1% Other Asian/Pacific 1%
Political lean MEDSL · Harris
- 2024 margin
- Lean D (+5.5) · D 52.0% · R 46.4% · Other 1.6%
- 2008→2024 swing
- +3.9pp toward D · 2008: 1.6pp · 2024: 5.5pp
- All cycles
- 2024: D+5.5 2020: D+13.3 2016: D+12.4 2012: D+0.1 2008: D+1.6
Not yet ingested
- Civics
- —
Market trends
- HPI YoY
- ▼ -154.80%
- Current HPI
- 246.1892
- Rent YoY
- ▲ 1.48%
- Metro
- Houston-The Woodlands-Sugar Land, TX
- State GDP YoY
- ▲ 3.95%
- F500 in state
- 110
Industry mix (Fortune 500 HQ in TX)
| Industry | F500 HQs | Revenue |
|---|---|---|
| Energy | 16 | $1,198B |
|
||
| Technology | 5 | $198B |
|
||
| Engineering / Construction | 4 | $72B |
|
||
| Energy Services | 3 | $60B |
|
||
| Utilities | 3 | $41B |
|
||
| Healthcare | 2 | $330B |
|
||
Price history
+56.7% since first listed9 events — show timeline
- 2026-03-26 Listed $264,900 HARMLS
- 2018-10-04 Sold (Public Records) — Public Records
- 2018-10-03 Sold (MLS) — HARMLS
- 2018-09-08 Pending — HARMLS
- 2018-09-03 Pending — HARMLS
- 2018-08-17 Listed $205,000 HARMLS
- 2009-04-30 Sold (MLS) — HARMLS
- 2009-04-27 Listing Removed — HARMLS
- 2009-04-07 Listed $169,040 HARMLS
Property tax history
+14.8%/yrLatest (2025): $6,837 · +4.8% YoY. Source: county tax records.
Cash-flow waterfall
monthlySold comps — $/sqft
last 12 mo · ≤1 miLoading sold comps…