37156 Alabama Dr · Ocean View, DE
Flood risk 1/10 · Minimal
- FEMA flood zone
- X (unshaded)
- Chance of flooding over 30 yrs
- 0.0%
- Est. flood insurance / yr
- $473 – $860
Fire risk 1/10 · Minimal
- Est. fire insurance / yr
- $476 – $884
Heat risk 8/10 · Major
- Hot days now (above 100°F)
- 7 days/yr
- Hot days in 30 yrs
- 18 days/yr
Wind risk 8/10 · Major
- Chance of severe wind over 30 yrs
- 80.0%
Air-quality risk 2/10 · Minimal
- Unhealthy air days now
- 0 days/yr
- Unhealthy air days in 30 yrs
- 1 days/yr
Risk factors via First Street. Map © Google.
Why this score? — see what drove the C- grade
The composite is a weighted blend of 9 inputs, each scored 0–100. Each bar is that input's sub-score; the figure is the points it added to the 100-point composite (weight × sub-score).
- Cash flow +15.1/30.0
- Appreciation +10.0/10.0
- ARV discount +7.5/15.0
- DSCR +4.6/10.0
- Livability +3.5/5.0
- 1% rule +3.0/10.0
- Schools +2.9/10.0
- Rent growth +2.5/5.0
- Condition / age +2.5/5.0
$250,000
🖨 Deal sheet 📄 Offer letter ✓ Due diligence
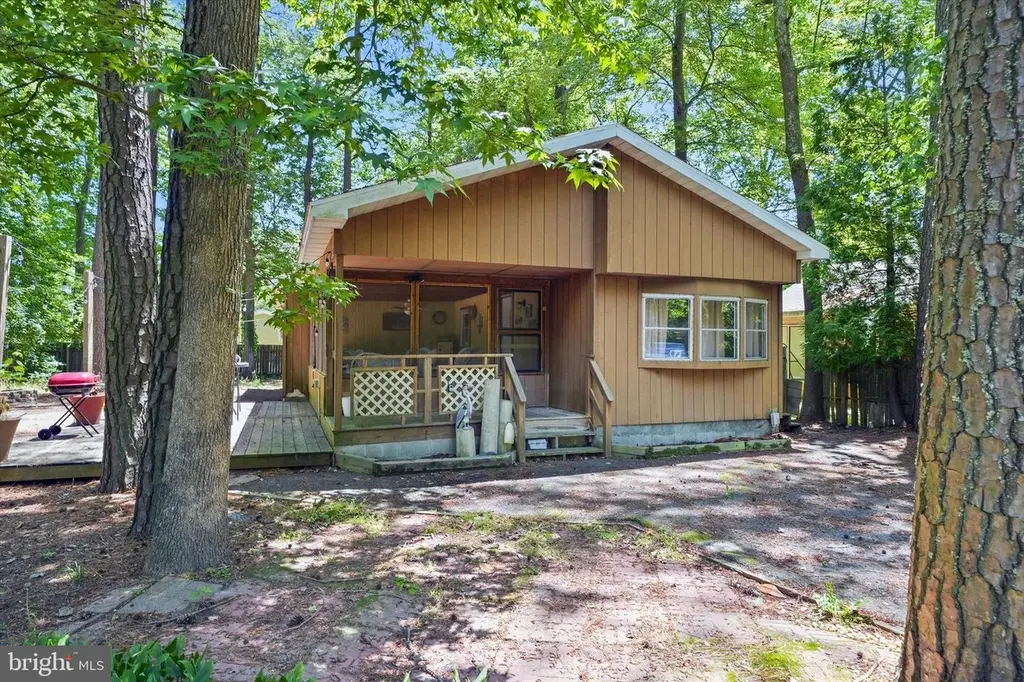
Listing remarks MLS
Your summer home awaits you! Renovated 3 BD, 2 BA class C. New paint, dishwasher, carpet and screens in porch. Home features laminate floors, central AC, oil heat, storage shed, deck and enclosed porch, paved drive & central sewer.
Key facts
- Peaceful wooded lot
- New roof
- Newer hvac system
Tags
Property features AI
Finance
- HOA & community: HOA fee $150 annually
Exterior
- Parking: Off-street parking
- Utilities: Public water; Public sewer; Electric service
- Home design: Manufactured home; Above-grade finished area reported as 672 (assessor)
- Construction: T-1-11 exterior siding
- Exterior features: Not in a federal flood zone; Lot dimensions approximately 75 x 135; Ground rent paid annually
Interior
- Bedrooms: Three bedrooms on the main level
- Bathrooms: Two full bathrooms (both on the main level)
- Heating & cooling: Heat pump with electric backup; Central air conditioning; Electric hot water
- Interior features: Living area reported by assessor; No basement
Neighborhood map
What this means for you Summary
Snapshot
- This is a 3-bed/2.0-bath manufactured listed at $250k.
Deal economics
- At list price, monthly cash flow is $81 ($968/yr) — positive.
- The deal already cash-flows at list — no discount required.
- To meet the 1% rule (rent ≥ 1% of price), the offer needs to be $200k (20.0% below list).
- Recommended offer: $200k (20.0% below list) — sets the bar for 1% rule.
- Cap rate 6.7% vs local median 1.9% in Ocean View — top-decile yield for the area; either an underpriced asset or a hidden risk that comps aren't pricing in. Stress-test before assuming the spread holds.
Location & tenants
- Location reads 69/100 on livability (#27 in DE) — a middle-class / working-renter tenant base. Strengths: crime A+, employment A+, schools A; Watch: amenities F, commute F, cost of living F.
- Indian River School District (rural): math 25% / reading 41% proficiency, ranked #14 of 26 in DE (top 54%) — families likely to look elsewhere, expect single-tenant / working-renter base with shorter leases.
- Market conditions: 281 active listings in the ZIP; 1 comparable units currently listed for rent nearby; 4,354 units permitted in Sussex County in 2024 (344 in 5+ unit buildings).
Forward outlook
- In year one you build about $27k of equity ($2k loan paydown + $25k appreciation (10.0% local appreciation)).
- Sussex County population projected at +25% by 2050 — long-run rental-demand tailwind backs the buy-and-hold thesis.
- At projected returns (10.0% appreciation + 3.0% rent growth), your $70k cash investment doubles in ~3 years — after that, you're playing with house money.
- By year 2, paydown + projected appreciation supports a ~$43k cash-out refi (75% LTV) — recoverable capital for the next deal without selling this one.
Negotiation context
- Only 10 days on market — expect competitive offers; lowballing is unlikely to land.
- 2 sale attempts since 13y ago with the ask held roughly flat each time — persistent listings suggest the price (not the market) is what's stuck; bring a comps-based counter.
- Current owner paid $103k; list at $250k implies a 143% gain — meaningful room to come down on a strong offer.
Risks & watch-outs
- Climate carrying-cost: severe wind risk, 80% chance of damaging wind over 30y; extreme-heat days projected 7→18/yr by 2055 (HVAC capex compounding) — expect insurance premiums to compound above CPI over the hold.
Questions for the listing agent
- What does the HOA fee cover, when was the last increase, and are there any pending special assessments or reserve-fund shortfalls?
- Is there a deadline driving the sale (1031 exchange, divorce, estate, relocation)? That informs how much negotiation room exists.
- Schools are A-rated — typically a magnet for longer-tenancy family renters. What's the average tenant stay here, and is there a school-zone premium baked into asking?
- What's the average days-on-market for RENTAL listings here right now (not sales)? A rising rental-DOM trend means longer vacancies and softer asking-rent achievability than the comps imply.
- What's the recent tenant-quality profile in this submarket — average credit score on applications, eviction rate, late-payment / NSF rate, and stable-employment percentage? A property-management company in the area should have these aggregated.
- How much new for-sale + rental construction is in the pipeline within 1–3 miles? Heavy new supply typically softens prices + rents 12–24 months out; constrained supply supports both.
Investment metrics
- 1% rule
- 0.80% ✗
- Cap rate
- 6.68%
- Cash-on-cash
- 1.38%
- DSCR
- 1.06
- GRM
- 10.4
CMA / ARV
No comps found within radius.
Projected returns pro-forma
10.0% appreciation · 3.0% rent growth · sell at horizon
- IRR
- 25.3%
- Equity multiple
- 3.02×
- Total profit
- $141,184
- Equity at exit
- $225,220
- IRR
- 22.2%
- Equity multiple
- 6.88×
- Total profit
- $411,503
- Equity at exit
- $485,695
Cash invested: $70,000 (down + closing). Projections, not guarantees.
Landlord ↔ Tenant lean methodology
- Overall (STATE)
- 70 Landlord-Friendly
- State Delaware
- 70 Landlord-Friendly · D+7
- County
- — inherits STATE
- City
- — inherits STATE
ZIP-level market 19945
- Home prices YoY
- 16.9%
- Active inventory
- 281
- Price-to-rent
- 10.4×
Monthly cashflow live
- Estimated rent
- $2,000 medium interval (Pro) →
- Mortgage (P&I)
- −$1,311
- Tax from tax record
- −$71 /mo · $854/yr
- Insurance
- −$104
- HOA
- −$13
- Vacancy / Maint / Mgmt
- −$420
- Net cashflow
- $81
Break-even live
UW: 25.0% down · 7.5% · 30yr · 1.5% tax · 5.0% vac · 8.0% maint · 8.0% mgmt
Financing live
Cash to close
- Down payment
- $62,500
- Closing costs
- $7,500
- Reserves months
- —
- Total cash needed
- —
Loan-product check · same deal, 3 products live
Conventional
25% down · 7.5% · 30yr
- Down + closing
- —
- Monthly P&I
- —
- Monthly cashflow
- —
- DSCR
- —
- Eligible?
- —
Personal DTI + credit; lowest rate.
DSCR
20% down · 8.5% · 30yr
- Down + closing
- —
- Monthly P&I
- —
- Monthly cashflow
- —
- DSCR
- —
- Eligible?
- —
No personal income docs; deal must DSCR.
Hard money
10% down · 12.0% · 12mo
- Down + closing
- —
- Monthly P&I
- —
- Monthly cashflow
- —
- DSCR
- —
- Eligible?
- —
Short-term bridge; refi at stabilization.
Rent comps 1 comps
| Address | Beds | Baths | Sqft | Rent | $/sqft | DOM | Units | Dist |
|---|---|---|---|---|---|---|---|---|
| 30022 Center Point Rd Millville, DE | 3.0 | 2.5 | 704 | $2,000 | $2.84 | 21d | 1 | 1.25mi |
HOA detail
- Monthly dues
- $13 · $156/yr
- Likely covers
- sewer
Listing history 8 events
-
2026-06-10status $250,000 Pending 10 DOM
-
2026-06-09days on market $250,000 Active 10 DOM
-
2026-06-08days on market $250,000 Active 9 DOM
-
2026-06-07days on market $250,000 Active 8 DOM
-
2026-06-02days on market $250,000 Active 3 DOM
-
2026-06-01days on market $250,000 Active 2 DOM
-
2026-05-30remarks 699-char remark
-
2026-05-30$250,000 Active 1 DOM
ⓘ Source: listings_history table (triggers on properties + properties_extension) + one-shot
backfill from property_details.listing_events for pre-trigger history.
Tax reassessment forecast DE · Partial reset (capped growth)
- Current annual tax
- $854 · $71/mo
- Projected year-2 tax
- $1,152 · $96/mo
- Expected delta
- +$298/yr (+$25/mo · 34.9%)
ⓘ Screening estimate from a state-policy table — verify with the county assessor before closing.
Climate risk First Street
- Flood 1/10 Low FEMA zone X (unshaded) · 0% chance over 30 yrs
- Wildfire 1/10 Low
- Heat 8/10 Severe 7 d/yr ≥100°F today · 18 d/yr by 30 yrs out
- Wind 8/10 Severe 80% chance of damaging wind over 30 yrs
- Air quality 2/10 Low 0 unhealthy d/yr today · 1 by 30 yrs out
Nearby sold comps map
Loading sold comps map…
Walkable amenities ~0.75 mi
Loading nearby amenities…
Taxation est. · year 1
- Rental income
- $24,000
- − Mortgage interest
- −$14,004
- − Property taxes
- −$854
- − Insurance
- −$1,250
- − Repairs & maintenance
- −$1,920
- − Management
- −$1,920
- − HOA
- −$156
- − Depreciation
- −$7,273
- Taxable loss
- −$3,376
- Est. tax savings @ 24.0%
- +$810
- After-tax cash flow
- $1,778/yr
For passive investors: Depreciation is non-cash, so a rental often shows a tax loss while cash-flowing — sheltering income. Rental losses are passive: they offset passive income freely, and up to $25,000/yr can offset ordinary (W-2) income if you actively participate and your MAGI is under $100k (phasing out to $0 by $150k); unused losses carry forward. On sale, claimed depreciation is recaptured at up to 25%, and gains may owe capital-gains tax (a 1031 exchange can defer both). Figures are a year-1 estimate at your 24.0% rate — not tax advice; consult a CPA.
Schools (NCES district)
- District
- Indian River School District
- NCES district ID
- 1000680
- Math proficiency
- 25% ▼ -27.00%
- Reading proficiency
- 41% ▼ -17.00%
- Median HH income
- $53,838
- Composite
- 28.99/100
- National rank
- #6620
- State rank
- #14 of 26 in DE
Livability — Ocean View
- Score
- 69/100
- State rank
- #27
- US rank
- #8560
Category grades
Schools grade is shown separately in the Schools card above.
Census & demographics
- Population (ZIP)
- 8,917
Population outlook (Sussex County) Hauer SSP2
- Today (2025)
- 248,853 people
- By 2030
- 264,464 · +6.3%
- By 2040
- 290,980 · +16.9%
- By 2050
- 311,259 · +25.1%
- By 2075
- 352,488 · +41.6%
- By 2100
- 367,406 · +47.6%
Race, ethnicity, and origin ACS 2023
- Neighborhood character
- Predominantly White (77%)
- Race & ethnicity
- White 77% Black 12% Hispanic / Latino 8% Two or more races 7%
- Hispanic origin (detail)
- Mexican 4%
- Common ancestry
- Romanian 3% Slovak 3% Lithuanian 1%
- Foreign-born
- 5% · Canada
- Languages at home
- 91% English-only · Spanish 8%
Political lean MEDSL · Sussex
- 2024 margin
- R (+11.0) · D 43.9% · R 54.9% · Other 1.2%
- 2008→2024 swing
- -2.4pp toward R · 2008: -8.6pp · 2024: -11.0pp
- All cycles
- 2024: R+11.0 2020: R+11.2 2016: R+22.0 2012: R+13.0 2008: R+8.6
Not yet ingested
- Civics
- —
Market trends
- HPI YoY
- ▲ 46.51%
- Current HPI
- 322.2407
- Rent YoY
- —
- Metro
- —
- State GDP YoY
- —
- F500 in state
- 0
Price history
+127.3% since first listed4 events — show timeline
- 2026-05-30 Listed $250,000 BRIGHT MLS
- 2013-07-16 Sold (MLS) $103,000 BRIGHT MLS
- 2013-07-15 Listing Removed — BRIGHT MLS
- 2013-02-01 Listed $110,000 BRIGHT MLS
Property tax history
-0.7%/yrLatest (2025): $854 · -5.5% YoY. Source: county tax records.
Cash-flow waterfall
monthlySold comps — $/sqft
last 12 mo · ≤1 miLoading sold comps…