 Duplex
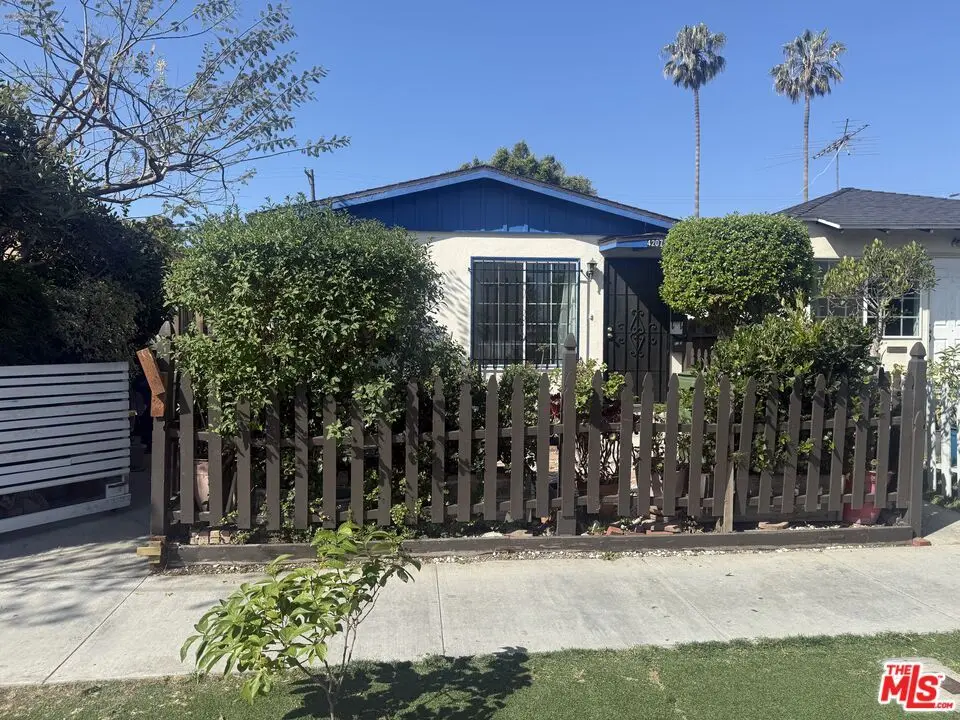
4207 S Centinela Ave · Los Angeles, CA
Flood risk 1/10 · Minimal
- FEMA flood zone
- X (unshaded)
- Chance of flooding over 30 yrs
- 0.0%
- Est. flood insurance / yr
- $507 – $1,088
Fire risk 1/10 · Minimal
- Est. fire insurance / yr
- $659 – $1,223
Heat risk 5/10 · Moderate
- Hot days now (above 85°F)
- 7 days/yr
- Hot days in 30 yrs
- 19 days/yr
Wind risk 1/10 · Minimal
- Chance of severe wind over 30 yrs
- —
Air-quality risk 4/10 · Minor
- Unhealthy air days now
- 6 days/yr
- Unhealthy air days in 30 yrs
- 7 days/yr
Risk factors via First Street. Map © Google.
Why this score? — see what drove the B- grade
The composite is a weighted blend of 9 inputs, each scored 0–100. Each bar is that input's sub-score; the figure is the points it added to the 100-point composite (weight × sub-score).
- Cash flow +25.6/30.0
- ARV discount +15.0/15.0
- DSCR +8.5/10.0
- 1% rule +5.8/10.0
- Schools +3.6/10.0
- Livability +3.4/5.0
- Rent growth +2.5/5.0
- Condition / age +2.5/5.0
- Appreciation +0.0/10.0
$699,000
🖨 Deal sheet 📄 Offer letter ✓ Due diligence
Multi-family units
County records classify this as Multi-Family (2-4 Unit). Listing-text estimate: 2 units. confirmed
Listing remarks
Well-located duplex in a desirable Westside setting, offering a flexible setup for both owner-users and investors. The property consists of two units totaling approximately 1,140 sq. ft. on a 2,500 sq. ft. LAR3-zoned lot. The front unit is a 1-bedroom, 1-bathroom residence that presents an immediate opportunity for an owner to occupy or for an investor to bring the unit to market rent upon acquisition. The rear unit is a 2-bedroom, 1-bathroom residence that is currently generating income, creating a balanced setup. The front unit includes a private outdoor area, offering usable space for outdoor seating, gardening, or allowing for exploration of additional uses. The rear unit is positioned
Key facts
- Alley access
- Private outdoor area
- Two car garage
Tags
Property features AI
Finance
- Other: One building on the lot
- Financial info: Gross and net operating income listed as $43,200; Unit rents: $2,200 for the 1‑bed unit; $1,400 for the 2‑bed unit; Gross rent multiplier 16.18; Vacancy rate reported as 50%; Listing terms: Probate
- HOA & community: Two units in complex
Exterior
- Parking: Attached garage; 2 total parking spaces
- Home design: Residential income property; Single-story
- Exterior features: No additional structures on the lot; Zoned LAR3
Interior
- Bedrooms: One unit with 1 bedroom; One unit with 2 bedrooms
- Bathrooms: Each unit has 1 bathroom
- Heating & cooling: Other heating; Other cooling; Other equipment
- Interior features: Duplex property (two separate rental units); One-level layout
Neighborhood map
What this means for you Summary
Snapshot
- This is a 2 × 3-bed/1.0-bath units multifamily listed at $699k.
Deal economics
- At list price, monthly cash flow is $2k ($20k/yr) — positive. Per door: $831/mo.
- The deal already cash-flows at list — no discount required.
- Meets the 1% rule at list price ($8k rent vs $699k).
- Recommended offer: $678k (3.0% below list) — sets the bar for market timing.
- Cap rate 9.1% vs local median 2.1% in Los Angeles — top-decile yield for the area; either an underpriced asset or a hidden risk that comps aren't pricing in. Stress-test before assuming the spread holds.
Location & tenants
- Location reads 68/100 on livability (#273 in CA) — a middle-class / working-renter tenant base. Strengths: amenities A+, commute A+, employment B; Watch: health & safety C-, schools D+, crime F.
- Los Angeles Unified (urban): math 29% / reading 54% proficiency, ranked #223 of 517 in CA (top 43%) — families likely to look elsewhere, expect single-tenant / working-renter base with shorter leases; 67% free/reduced lunch — lower-income household profile, screen leases tightly.
- Market conditions: Rents soft (-0.1%/yr); 159 active listings in the ZIP; 40 comparable units currently listed for rent nearby; rentals at typical pace (median 22d on market — plan ~3-4 weeks tenant-placement turnaround); high-income renter base; 19,697 units permitted in Los Angeles County in 2024 (9,426 in 5+ unit buildings).
- At $7,540/mo this rent would consume 79% of the median local household income ($114k/yr) (locally 3174% of renters already pay >50% of income on rent) — very limited rent-growth headroom before tenants either downsize or default.
Forward outlook
- Local home prices are declining (-3.0%/yr); year-one equity from $5k of loan paydown is wiped out by about $21k of value loss. Plan a longer hold.
- Los Angeles County population projected at +9% by 2050 — modest demand growth; plan on rents tracking national, not racing it.
Negotiation context
- It's been on market 40 days — a 3% lower offer ($678k) is reasonable based on typical stale-listing flexibility.
- Current owner paid $196k; list at $699k implies a 257% gain — meaningful room to come down on a strong offer.
Risks & watch-outs
- Watch-outs: built in 1952 — expect roof / HVAC / electrical / plumbing capex.
- Climate carrying-cost: extreme-heat days projected 7→19/yr by 2055 (HVAC capex compounding) — expect insurance premiums to compound above CPI over the hold.
Questions for the listing agent
- It's been on market 40 days. Have you received any prior offers? Is the seller open to a 3% concession, seller financing, or rate buy-down credit?
- Can we see the unit-by-unit rent roll, current vacancy, and any below-market leases? What's the average tenancy length?
- What capital expenditures (roof, boiler, parking lot, exteriors) have been made in the last 5 years, and what's planned in the next 2?
- Built in 1952 — when were the roof, HVAC, electrical panel, plumbing, and water heater last replaced?
- Is there a deadline driving the sale (1031 exchange, divorce, estate, relocation)? That informs how much negotiation room exists.
- Schools are D-rated, which usually means shorter tenancies and higher turnover. Who's the typical renter profile here, and what's been the actual vacancy rate?
- Crime grade is F in this area — have there been break-ins, vandalism, or insurance claims at this property in the last 3 years? What carrier currently insures it and at what premium?
- What's the average days-on-market for RENTAL listings here right now (not sales)? A rising rental-DOM trend means longer vacancies and softer asking-rent achievability than the comps imply.
- What's the recent tenant-quality profile in this submarket — average credit score on applications, eviction rate, late-payment / NSF rate, and stable-employment percentage? A property-management company in the area should have these aggregated.
- How much new apartment / multifamily construction is in the pipeline within 1–3 miles? Heavy new supply (>2% of stock underway) typically softens rents 12–24 months out; light construction supports rent growth.
Investment metrics
- 1% rule
- 1.08% ✓
- Cap rate
- 9.15%
- Cash-on-cash
- 10.19%
- DSCR
- 1.45
- GRM
- 7.7
CMA / ARV
- ARV (median comp)
- $943,140
- List price
- $699,000
- Delta
- -25.89%
- Verdict
- UNDERPRICED
- Comps
- 3 within 1.0 mi
Show comp detail 1 sale within ~0.75 mi
| Address | Dist | Beds/Ba | Sqft | Sold | Price | $/sf | Match |
|---|---|---|---|---|---|---|---|
| 4455 S Centinela Ave | 0.29mi | 2/2.0 (-1) | 1,140 (0%) | 21mo | $975,000 | $855 | 64 |
Match score weights: distance 35% · size 25% · config 20% · recency 20%. Top-matched comps best support the ARV.
Projected returns pro-forma
-3.0% appreciation · 0.0% rent growth · sell at horizon
- IRR
- -4.2%
- Equity multiple
- 0.85×
- Total profit
- $-29,743
- Equity at exit
- $104,223
- IRR
- 2.0%
- Equity multiple
- 1.12×
- Total profit
- $24,111
- Equity at exit
- $60,437
Cash invested: $195,720 (down + closing). Projections, not guarantees.
Landlord ↔ Tenant lean methodology
- Overall (CITY)
- 0 Strongly Tenant-Friendly
- State California
- 18 Strongly Tenant-Friendly · D+13
- County
- — inherits STATE
- City Los Angeles
- 0 Strongly Tenant-Friendly · D+22
ZIP-level market 90066
- Rents YoY
- -0.1%
- Active inventory
- 159
- Price-to-rent
- 15.5×
Monthly cashflow live
- Estimated rent
- $7,540 high interval (Pro) →
- Mortgage (P&I)
- −$3,666
- Tax from tax record
- −$338 /mo · $4,056/yr
- Insurance
- −$291
- HOA
- −$0
- Vacancy / Maint / Mgmt
- −$1,583
- Net cashflow
- $1,662
Break-even live
2-unit breakdown (identical units grouped — click to expand)
| Units | Beds | Baths | Est. rent |
|---|---|---|---|
| 2× units | 3 | 1 | $7,540 |
| #1 | 3 | 1 | $3,770 |
| #2 | 3 | 1 | $3,770 |
| Total (2 units) | $7,540 | ||
UW: 25.0% down · 7.5% · 30yr · 1.5% tax · 5.0% vac · 8.0% maint · 8.0% mgmt
Financing live
Cash to close
- Down payment
- $174,750
- Closing costs
- $20,970
- Reserves months
- —
- Total cash needed
- —
Loan-product check · same deal, 3 products live
Conventional
25% down · 7.5% · 30yr
- Down + closing
- —
- Monthly P&I
- —
- Monthly cashflow
- —
- DSCR
- —
- Eligible?
- —
Personal DTI + credit; lowest rate.
DSCR
20% down · 8.5% · 30yr
- Down + closing
- —
- Monthly P&I
- —
- Monthly cashflow
- —
- DSCR
- —
- Eligible?
- —
No personal income docs; deal must DSCR.
Hard money
10% down · 12.0% · 12mo
- Down + closing
- —
- Monthly P&I
- —
- Monthly cashflow
- —
- DSCR
- —
- Eligible?
- —
Short-term bridge; refi at stabilization.
Rent comps 40 comps
| Address | Beds | Baths | Sqft | Rent | $/sqft | DOM | Units | Dist |
|---|---|---|---|---|---|---|---|---|
| 4247 S Centinela Ave Unit 4249 Los Angeles, CA | 2.0 | 1.0 | 890 | $3,350 | $3.76 | 2d | 1 | 0.07mi |
| 4424 S Centinela Ave Unit 103 Los Angeles, CA | 2.0 | 2.0 | 1000 | $2,700 | $2.70 | 43d | 1 | 0.20mi |
| 4232 Lindblade Dr Unit 1 Los Angeles, CA | 2.0 | 1.0 | 700 | $2,495 | $3.56 | 2d | 1 | 0.23mi |
| 4160 Mildred Ave Los Angeles, CA | 2.0 | 1.0 | 1100 | $5,000 | $4.55 | 43d | 1 | 0.28mi |
| 4225 Inglewood Blvd Los Angeles, CA | 2.0 | 2.0 | 1250 | $2,938 | $2.35 | 10d | 1 | 0.31mi |
| 11955 Washington Blvd Los Angeles, CA | 2.0 | 2.0 | 1296 | $4,212 | $3.25 | 20d | 2 | 0.33mi |
| 11924 W Washington Blvd Los Angeles, CA | 3.0 | 1.0–2.0 | 1127 | $6,603 | $5.86 | 1d | 6 | 0.36mi |
| 4147 Marcasel Ave Los Angeles, CA | 4.0 | 3.0 | 1325 | $12,000 | $9.06 | 24d | 1 | 0.38mi |
| 4320 Inglewood Blvd Unit 201 Los Angeles, CA | 2.0 | 2.0 | 1000 | $3,700 | $3.70 | 43d | 1 | 0.41mi |
| 11901 W Washington Blvd Los Angeles, CA | 2.0 | 1.0 | 817 | $2,500 | $3.06 | 43d | 1 | 0.44mi |
| 4111 Wade St Unit D Los Angeles, CA | 2.0 | 1.5 | 980 | $3,200 | $3.27 | 43d | 1 | 0.45mi |
| 12231 Culver Blvd Los Angeles, CA | 3.0 | 2.0 | 1140 | $5,475 | $4.80 | 24d | 1 | 0.45mi |
| 11900 Courtleigh Dr Los Angeles, CA | 3.0 | 2.0 | 1222 | $4,384 | $3.59 | 1d | 2 | 0.48mi |
| 4114 Moore St Los Angeles, CA | 2.0 | 1.0 | 1072 | $6,250 | $5.83 | 43d | 1 | 0.50mi |
| 11955 Culver Blvd Unit 505 Los Angeles, CA | 2.0 | 1.5 | 1032 | $3,800 | $3.68 | 43d | 1 | 0.52mi |
| 12515 Barbara Ave Los Angeles, CA | 2.0 | 2.0 | 970 | $4,800 | $4.95 | 19d | 1 | 0.53mi |
| 11818 Courtleigh Dr #102 Los Angeles, CA | 2.0 | 2.0 | 1021 | $3,100 | $3.04 | 24d | 1 | 0.54mi |
| 11919 Culver Blvd Los Angeles, CA | 2.0 | 2.0 | 1000 | $2,975 | $2.98 | 18d | 1 | 0.54mi |
| 12236 Pacific Ave Unit 2 Los Angeles, CA | 2.0 | 2.0 | 950 | $2,699 | $2.84 | 5d | 1 | 0.55mi |
| 4515 McConnell Ave #3 Los Angeles, CA | 3.0 | 2.5 | 1050 | $4,195 | $4.00 | 2d | 1 | 0.55mi |
| 11834 Avon Way Apt 101 Los Angeles, CA | 2.0 | 2.0 | 912 | $2,795 | $3.06 | 7d | 1 | 0.56mi |
| 11834 Avon Way Unit 203 Los Angeles, CA | 2.0 | 2.0 | 802 | $3,095 | $3.86 | 43d | 1 | 0.56mi |
| 12707 Caswell Ave Apt 102 Los Angeles, CA | 2.0 | 2.0 | 1000 | $2,895 | $2.90 | 1d | 1 | 0.57mi |
| 11737 Courtleigh Dr Unit 108 Los Angeles, CA | 2.0 | 2.0 | 950 | $3,483 | $3.67 | 24d | 1 | 0.57mi |
| 11737 Courtleigh Dr Los Angeles, CA | 2.0 | 2.0 | 983 | $3,483 | $3.54 | 24d | 1 | 0.57mi |
| 12506 Pacific Ave Los Angeles, CA | 2.0 | 2.0 | 922 | $3,795 | $4.12 | 43d | 1 | 0.58mi |
| 12601 Matteson Ave #7 Los Angeles, CA | 3.0 | 2.5 | 1470 | $5,500 | $3.74 | 1d | 1 | 0.59mi |
| 4081 McLaughlin Ave Los Angeles, CA | 2.0 | 1.0 | 1000 | $2,595 | $2.60 | 2d | 1 | 0.59mi |
| 4081 McLaughlin Ave Los Angeles, CA | 2.0 | 1.0 | 1000 | $2,595 | $2.60 | 22d | 1 | 0.59mi |
| 4111 McLaughlin Ave Los Angeles, CA | 2.0 | 1.0 | 1000 | $2,595 | $2.60 | 7d | 1 | 0.60mi |
| 11733 Avon Way #101 Los Angeles, CA | 2.0 | 2.0 | 860 | $3,350 | $3.90 | 17d | 1 | 0.60mi |
| 11733 Avon Way #101 Los Angeles, CA | 2.0 | 2.0 | 860 | $3,350 | $3.90 | 18d | 1 | 0.60mi |
| 4065 McLaughlin Ave Unit 8 Los Angeles, CA | 2.0 | 1.0 | 950 | $2,250 | $2.37 | 24d | 1 | 0.60mi |
| 4065 McLaughlin Ave Unit 8 Los Angeles, CA | 2.0 | 1.0 | 950 | $2,250 | $2.37 | 43d | 1 | 0.60mi |
| 12821 Washington Blvd Los Angeles, CA | 2.0 | 2.0 | 1060 | $4,595 | $4.33 | 5d | 1 | 0.60mi |
| 3988 Moore St Unit 5 Los Angeles, CA | 2.0 | 1.5 | 1100 | $2,800 | $2.55 | 43d | 1 | 0.60mi |
| 3911 Wade St Los Angeles, CA | 2.0 | 2.0 | 980 | $2,995 | $3.06 | 43d | 1 | 0.60mi |
| 11846 Culver Blvd Los Angeles, CA | 2.0 | 1.5 | 1050 | $3,000 | $2.86 | 43d | 1 | 0.61mi |
| 12767 Mitchell Ave Los Angeles, CA | 3.0–5.0 | 2.0–5.0 | 757 | $1,570 | $2.07 | 4d | 28 | 0.61mi |
| 3974 Moore St Apt 202 Los Angeles, CA | 2.0 | 2.0 | 800 | $3,204 | $4.00 | 17d | 1 | 0.61mi |
Listing history 15 events
-
2026-06-15status $699,000 Pending 40 DOM
-
2026-06-13days on market $699,000 Active 40 DOM
-
2026-06-09days on market $699,000 Active 36 DOM
-
2026-06-08days on market $699,000 Active 35 DOM
-
2026-06-07days on market $699,000 Active 34 DOM
-
2026-06-04days on market $699,000 Active 31 DOM
-
2026-06-03days on market $699,000 Active 30 DOM
-
2026-06-02days on market $699,000 Active 29 DOM
-
2026-06-01days on market $699,000 Active 28 DOM
-
2026-05-31days on market $699,000 Active 27 DOM
-
2026-05-04$699,000 Active 1343-char remark
-
2000-12-18soldstatus $196,000
-
1992-07-30soldstatus $163,000
-
1988-03-08soldstatus $210,000
-
1986-08-08soldstatus $133,000
ⓘ Source: listings_history table (triggers on properties + properties_extension) + one-shot
backfill from property_details.listing_events for pre-trigger history.
Tax reassessment forecast CA · Resets to sale price
- Current annual tax
- $4,056 · $338/mo
- Projected year-2 tax
- $5,312 · $443/mo
- Expected delta
- +$1,257/yr (+$105/mo · 31.0%)
ⓘ Screening estimate from a state-policy table — verify with the county assessor before closing.
Climate risk First Street
- Flood 1/10 Low FEMA zone X (unshaded) · 0% chance over 30 yrs
- Wildfire 1/10 Low
- Heat 5/10 Major 7 d/yr ≥85°F today · 19 d/yr by 30 yrs out
- Wind 1/10 Low
- Air quality 4/10 Moderate 6 unhealthy d/yr today · 7 by 30 yrs out
Nearby sold comps map
Loading sold comps map…
Walkable amenities ~0.75 mi
Loading nearby amenities…
Taxation est. · year 1
- Rental income
- $90,480
- − Mortgage interest
- −$39,155
- − Property taxes
- −$4,056
- − Insurance
- −$3,495
- − Repairs & maintenance
- −$7,238
- − Management
- −$7,238
- − Depreciation
- −$20,335
- Taxable income
- $8,963
- Est. tax owed @ 24.0%
- −$2,151
- After-tax cash flow
- $17,790/yr
For passive investors: Depreciation is non-cash, so a rental often shows a tax loss while cash-flowing — sheltering income. Rental losses are passive: they offset passive income freely, and up to $25,000/yr can offset ordinary (W-2) income if you actively participate and your MAGI is under $100k (phasing out to $0 by $150k); unused losses carry forward. On sale, claimed depreciation is recaptured at up to 25%, and gains may owe capital-gains tax (a 1031 exchange can defer both). Figures are a year-1 estimate at your 24.0% rate — not tax advice; consult a CPA.
Schools (NCES district)
- District
- Los Angeles Unified
- NCES district ID
- 0622710
- Math proficiency
- 29% ▼ -4.00%
- Reading proficiency
- 54% ▲ 10.00%
- Median HH income
- $50,403
- Composite
- 35.67/100
- National rank
- #4875
- State rank
- #223 of 517 in CA
Livability — Los Angeles
- Score
- 68/100
- State rank
- #273
- US rank
- #9237
Category grades
Schools grade is shown separately in the Schools card above.
Census & demographics
- Census place
- Los Angeles, CA
- County
- Los Angeles County · 9,444,647 people
- City population
- 3,838,149
- Metro
- Los Angeles-Long Beach-Anaheim, CA
- Population (ZIP)
- 56,740
- Household income
- $114,141
- Rent vs Own
- Severe rent burden
- 3174.0
Population outlook (Los Angeles County) Hauer SSP2
- Today (2025)
- 10,940,515 people
- By 2030
- 11,256,481 · +2.9%
- By 2040
- 11,729,929 · +7.2%
- By 2050
- 11,948,407 · +9.2%
- By 2075
- 11,818,114 · +8.0%
- By 2100
- 10,842,928 · -0.9%
Race, ethnicity, and origin ACS 2023
- Neighborhood character
- Diverse neighborhood (Simpson 0.68)
- Race & ethnicity
- White 48% Hispanic / Latino 25% Asian 16% Two or more races 13% Black 5%
- Hispanic origin (detail)
- Mexican 18%
- Common ancestry
- Italian 3% Romanian 3% Scotch-Irish 2%
- Foreign-born
- 25% · Canada, China, South Korea
- Languages at home
- 63% English-only · Spanish 19% Other Indo-European 4% Chinese 4%
Political lean MEDSL · Los Angeles
- 2024 margin
- Solid D (+32.9) · D 64.8% · R 31.9% · Other 3.3%
- 2008→2024 swing
- -7.4pp toward R · 2008: 40.4pp · 2024: 32.9pp
- All cycles
- 2024: D+32.9 2020: D+44.2 2016: D+48.0 2012: D+40.0 2008: D+40.4
Not yet ingested
- Civics
- —
Market trends
- HPI YoY
- ▼ -1200.36%
- Current HPI
- 466.5309
- Rent YoY
- ▼ -0.08%
- Metro
- Los Angeles-Long Beach-Anaheim, CA
- State GDP YoY
- ▲ 3.21%
- F500 in state
- 116
Industry mix (Fortune 500 HQ in CA)
| Industry | F500 HQs | Revenue |
|---|---|---|
| Technology | 27 | $1,492B |
|
||
| Financial Services | 3 | $174B |
|
||
| Retail | 3 | $44B |
|
||
| Insurance | 3 | $26B |
|
||
| Media / Entertainment | 2 | $115B |
|
||
| Pharmaceuticals / Biotech | 2 | $62B |
|
||
Price history
+425.6% since first listed6 events — show timeline
- 2026-06-14 Pending — TheMLS
- 2026-05-04 Listed $699,000 TheMLS
- 2000-12-18 Sold (Public Records) $196,000 Public Records
- 1992-07-30 Sold (Public Records) $163,000 Public Records
- 1988-03-08 Sold (Public Records) $210,000 Public Records
- 1986-08-08 Sold (Public Records) $133,000 Public Records
Property tax history
+1.7%/yrLatest (2025): $4,056 · +1.0% YoY. Source: county tax records.
Cash-flow waterfall
monthlySold comps — $/sqft
last 12 mo · ≤1 miLoading sold comps…