160 NW Whitney Gln · Lake City, FL
Flood risk 6/10 · Moderate
- FEMA flood zone
- A
- Chance of flooding over 30 yrs
- 0.69%
- Est. flood insurance / yr
- $1,009 – $1,996
Fire risk 6/10 · Moderate
- Est. fire insurance / yr
- $947 – $1,759
Heat risk 8/10 · Major
- Hot days now (above 107°F)
- 6 days/yr
- Hot days in 30 yrs
- 17 days/yr
Wind risk 9/10 · Severe
- Chance of severe wind over 30 yrs
- 99.0%
Air-quality risk 5/10 · Moderate
- Unhealthy air days now
- 9 days/yr
- Unhealthy air days in 30 yrs
- 10 days/yr
Risk factors via First Street. Map © Google.
Why this score? — see what drove the C+ grade
The composite is a weighted blend of 9 inputs, each scored 0–100. Each bar is that input's sub-score; the figure is the points it added to the 100-point composite (weight × sub-score).
- Cash flow +16.8/30.0
- ARV discount +15.0/15.0
- Appreciation +10.0/10.0
- DSCR +5.2/10.0
- 1% rule +4.6/10.0
- Schools +4.5/10.0
- Livability +3.7/5.0
- Rent growth +2.5/5.0
- Condition / age +2.5/5.0
$160,000
🖨 Deal sheet 📄 Offer letter ✓ Due diligence
Listing remarks MLS
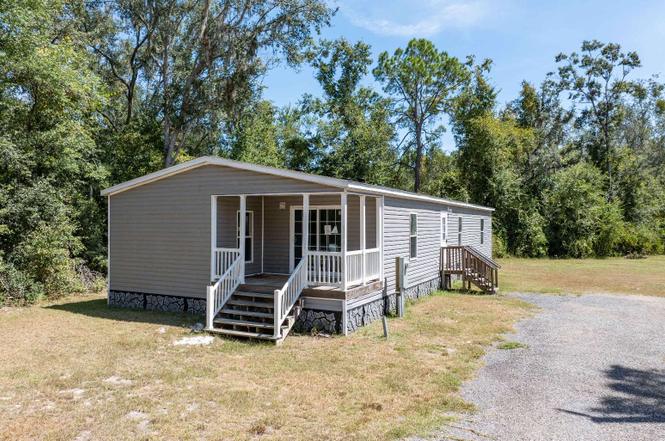
One or more photo(s) has been virtually staged. Back on the Market! NEW 3Bed 2Bath Royal by Live Oak Homes on Paved . 87 of an acre (MOL). Open spacious floor plan and Island Kitchen. Some upgrade features and few miles from Interstate 75.
Key facts
- Open floor plan
- Paved road frontage
- Front porch
Tags
Property features AI
Exterior
- Parking: Attached or detached garage with 3 spaces
- Utilities: Private well water
- Home design: Manufactured home; Residential property
- Construction: Frame construction
- Exterior features: Shingle roof; Lot approximately 0.87 acres; Lot dimensions: 61 x 306 x 190 x 319; Zoning: RSF/M
Interior
- Flooring: Vinyl
- Bathrooms: 2 full bathrooms
- Heating & cooling: Central heating (electric); Central air conditioning
- Interior features: Insulated windows; Vinyl flooring
Neighborhood map
What this means for you Summary
Snapshot
- This is a 3-bed/2.0-bath manufactured listed at $160k.
Deal economics
- At list price, monthly cash flow is $-23 ($-272/yr) — negative.
- To cash-flow at today's rent, offer at most $156k (2.5% below list).
- To meet the 1% rule (rent ≥ 1% of price), the offer needs to be $154k (3.7% below list).
- Recommended offer: $141k (12.0% below list) — sets the bar for market timing.
- Cap rate 7.1% vs local median 3.7% in Lake City — top-decile yield for the area; either an underpriced asset or a hidden risk that comps aren't pricing in. Stress-test before assuming the spread holds.
Location & tenants
- Location reads 73/100 on livability (#304 in FL) — a middle-class / working-renter tenant base. Strengths: cost of living A+, housing A+, health & safety A+; Watch: amenities C-, commute F, employment F.
- Columbia (town): math 53% / reading 54% proficiency, ranked #25 of 73 in FL (top 34%) — acceptable for families but not a draw, mixed tenant base, ~2y average lease.
- Market conditions: 145 active listings in the ZIP; 178 units permitted in Columbia County in 2024 (0 in 5+ unit buildings).
- This rent runs 30% of the median local income ($61k/yr) — at the standard rent-burdened threshold; future hikes will face affordability resistance.
Forward outlook
- In year one you build about $17k of equity ($1k loan paydown + $16k appreciation (10.0% local appreciation)).
- Columbia County population projected to shrink 7% by 2050 — rents likely to lag national; underwrite the cash flow, not the appreciation.
- At projected returns (10.0% appreciation + 3.0% rent growth), your $45k cash investment doubles in ~3 years — after that, you're playing with house money.
- By year 3, paydown + projected appreciation supports a ~$43k cash-out refi (75% LTV) — recoverable capital for the next deal without selling this one.
Negotiation context
- It's been on market 268 days — a 12% lower offer ($141k) is reasonable based on typical stale-listing flexibility.
- 3 sale attempts since 5y ago; this cycle's ask has dropped $59k (27%) from the opening price — seller is motivated, your offer sets the floor, not the list.
Risks & watch-outs
- Watch-outs: flood insurance adds $125/mo.
- Climate carrying-cost: in FEMA flood zone A (mandatory federal flood insurance); severe wind risk, 99% chance of damaging wind over 30y; major wildfire risk; extreme-heat days projected 6→17/yr by 2055 (HVAC capex compounding) — expect insurance premiums to compound above CPI over the hold.
Questions for the listing agent
- What do current leases actually rent for vs. the listed asking? Can we see a recent rent roll and the last 12 months of T-12 income?
- It's been on market 268 days. Have you received any prior offers? Is the seller open to a 12% concession, seller financing, or rate buy-down credit?
- What's the actual annual flood-insurance premium (NFIP or private), and is the property in a SFHA with mandatory coverage?
- Why hasn't it sold? Are there any deal-killer items the seller is aware of (foundation, flood, title, zoning, code violations)?
- Is there a deadline driving the sale (1031 exchange, divorce, estate, relocation)? That informs how much negotiation room exists.
- Schools are B-rated — typically a magnet for longer-tenancy family renters. What's the average tenant stay here, and is there a school-zone premium baked into asking?
- What's the average days-on-market for RENTAL listings here right now (not sales)? A rising rental-DOM trend means longer vacancies and softer asking-rent achievability than the comps imply.
- What's the recent tenant-quality profile in this submarket — average credit score on applications, eviction rate, late-payment / NSF rate, and stable-employment percentage? A property-management company in the area should have these aggregated.
- How much new for-sale + rental construction is in the pipeline within 1–3 miles? Heavy new supply typically softens prices + rents 12–24 months out; constrained supply supports both.
Investment metrics
- 1% rule
- 0.96% ✗
- Cap rate
- 7.06%
- Cash-on-cash
- 2.75%
- DSCR
- 1.12
- GRM
- 8.7
CMA / ARV
- ARV (on-the-fly)
- $215,496
- Comps found
- 2
Show comp detail 2 sales within ~0.75 mi
| Address | Dist | Beds/Ba | Sqft | Sold | Price | $/sf | Match |
|---|---|---|---|---|---|---|---|
| 167 N Dudley Loop | 0.67mi | 3/2.0 | 1,620 (-8%) | 2mo | $200,000 | $123 | 55 |
| 180 NW Lazy Acre Ct | 0.71mi | 3/2.0 | 1,782 (+2%) | 15mo | $122,000 | $68 | 52 |
Match score weights: distance 35% · size 25% · config 20% · recency 20%. Top-matched comps best support the ARV.
Projected returns pro-forma
10.0% appreciation · 3.0% rent growth · sell at horizon
- IRR
- 23.9%
- Equity multiple
- 2.92×
- Total profit
- $85,801
- Equity at exit
- $144,141
- IRR
- 21.2%
- Equity multiple
- 6.67×
- Total profit
- $254,017
- Equity at exit
- $310,845
Cash invested: $44,800 (down + closing). Projections, not guarantees.
Landlord ↔ Tenant lean methodology
- Overall (STATE)
- 87 Strongly Landlord-Friendly
- State Florida
- 87 Strongly Landlord-Friendly · R+3
- County
- — inherits STATE
- City
- — inherits STATE
ZIP-level market 32055
- Home prices YoY
- 24.1%
- Active inventory
- 145
- Price-to-rent
- 8.7×
Monthly cashflow live
- Estimated rent
- $1,541 medium interval (Pro) →
- Mortgage (P&I)
- −$839
- Tax from tax record
- −$209 /mo · $2,506/yr
- Insurance
- −$67
- Flood insurance flood zone
- −$125 /mo · $1,502/yr
- HOA
- −$0
- Vacancy / Maint / Mgmt
- −$324
- Net cashflow
- $-23
Break-even live
UW: 25.0% down · 7.5% · 30yr · 1.5% tax · 5.0% vac · 8.0% maint · 8.0% mgmt
Financing live
Cash to close
- Down payment
- $40,000
- Closing costs
- $4,800
- Reserves months
- —
- Total cash needed
- —
Loan-product check · same deal, 3 products live
Conventional
25% down · 7.5% · 30yr
- Down + closing
- —
- Monthly P&I
- —
- Monthly cashflow
- —
- DSCR
- —
- Eligible?
- —
Personal DTI + credit; lowest rate.
DSCR
20% down · 8.5% · 30yr
- Down + closing
- —
- Monthly P&I
- —
- Monthly cashflow
- —
- DSCR
- —
- Eligible?
- —
No personal income docs; deal must DSCR.
Hard money
10% down · 12.0% · 12mo
- Down + closing
- —
- Monthly P&I
- —
- Monthly cashflow
- —
- DSCR
- —
- Eligible?
- —
Short-term bridge; refi at stabilization.
Listing history 26 events
-
2026-06-19days on market $160,000 Active 268 DOM
-
2026-06-18days on market $160,000 Active 267 DOM
-
2026-06-17days on market $160,000 Active 266 DOM
-
2026-06-16days on market $160,000 Active 265 DOM
-
2026-06-15days on market $160,000 Active 264 DOM
-
2026-06-14days on market $160,000 Active 262 DOM
-
2026-06-12days on market $160,000 Active 261 DOM
-
2026-06-09days on market $160,000 Active 258 DOM
-
2026-06-08days on market $160,000 Active 257 DOM
-
2026-06-07days on market $160,000 Active 256 DOM
-
2026-06-05days on market $160,000 Active 253 DOM
-
2026-06-03days on market $160,000 Active 252 DOM
-
2026-06-02days on market $160,000 Active 251 DOM
-
2026-06-01days on market $160,000 Active 250 DOM
-
2026-05-31days on market $160,000 Active 249 DOM
-
2026-05-30days on market $160,000 Active 248 DOM
-
2026-04-16status Active
-
2026-04-16price $160,000
-
2026-01-08price $200,000
-
2025-09-10$219,000 Active
-
2022-10-03soldstatus $195,000
-
2022-09-27soldstatus $195,000 Closed 239-char remark
Show marketing remark (239 chars)
One or more photo(s) has been virtually staged. Back on the Market! NEW 3Bed 2Bath Royal by Live Oak Homes on Paved . 87 of an acre (MOL). Open spacious floor plan and Island Kitchen. Some upgrade features and few miles from Interstate 75.
-
2022-08-12historical 239-char remark
Show marketing remark (239 chars)
One or more photo(s) has been virtually staged. Back on the Market! NEW 3Bed 2Bath Royal by Live Oak Homes on Paved . 87 of an acre (MOL). Open spacious floor plan and Island Kitchen. Some upgrade features and few miles from Interstate 75.
-
2021-09-14$189,900 239-char remark
Show marketing remark (239 chars)
One or more photo(s) has been virtually staged. Back on the Market! NEW 3Bed 2Bath Royal by Live Oak Homes on Paved . 87 of an acre (MOL). Open spacious floor plan and Island Kitchen. Some upgrade features and few miles from Interstate 75.
-
2018-07-25soldstatus $162,000
-
2005-11-01soldstatus $27,500
ⓘ Source: listings_history table (triggers on properties + properties_extension) + one-shot
backfill from property_details.listing_events for pre-trigger history.
Tax reassessment forecast FL · Resets to sale price
- Current annual tax
- $2,506 · $209/mo
- Projected year-2 tax
- $2,506 · $209/mo
- Expected delta
- $0/yr ($0/mo · 0.0%)
ⓘ Screening estimate from a state-policy table — verify with the county assessor before closing.
Climate risk First Street
- Flood 6/10 Major FEMA zone A · 69% chance over 30 yrs
- Wildfire 6/10 Major
- Heat 8/10 Severe 6 d/yr ≥107°F today · 17 d/yr by 30 yrs out
- Wind 9/10 Extreme 99% chance of damaging wind over 30 yrs
- Air quality 5/10 Major 9 unhealthy d/yr today · 10 by 30 yrs out
Nearby sold comps map
Loading sold comps map…
Walkable amenities ~0.75 mi
Loading nearby amenities…
Taxation est. · year 1
- Rental income
- $18,487
- − Mortgage interest
- −$8,962
- − Property taxes
- −$2,506
- − Insurance
- −$2,302
- − Repairs & maintenance
- −$1,479
- − Management
- −$1,479
- − Depreciation
- −$4,655
- Taxable loss
- −$2,896
- Est. tax savings @ 24.0%
- +$695
- After-tax cash flow
- $423/yr
For passive investors: Depreciation is non-cash, so a rental often shows a tax loss while cash-flowing — sheltering income. Rental losses are passive: they offset passive income freely, and up to $25,000/yr can offset ordinary (W-2) income if you actively participate and your MAGI is under $100k (phasing out to $0 by $150k); unused losses carry forward. On sale, claimed depreciation is recaptured at up to 25%, and gains may owe capital-gains tax (a 1031 exchange can defer both). Figures are a year-1 estimate at your 24.0% rate — not tax advice; consult a CPA.
Schools (NCES district)
- District
- Columbia
- NCES district ID
- 1200360
- Math proficiency
- 53% ▼ -10.00%
- Reading proficiency
- 54% ▼ -3.00%
- Median HH income
- $40,053
- Composite
- 44.74/100
- National rank
- #2750
- State rank
- #25 of 73 in FL
Livability — Lake City
- Score
- 73/100
- State rank
- #304
- US rank
- #5154
Category grades
Schools grade is shown separately in the Schools card above.
Census & demographics
- County
- Columbia County · 40,507 people
- City population
- 40,507
- Metro
- Lake City, FL
- Population (ZIP)
- 17,559
- Household income
- $61,111
- Rent vs Own
- Severe rent burden
- 391.0
Population outlook (Columbia County) Hauer SSP2
- Today (2025)
- 68,129 people
- By 2030
- 67,501 · -0.9%
- By 2040
- 65,465 · -3.9%
- By 2050
- 63,058 · -7.4%
- By 2075
- 56,291 · -17.4%
- By 2100
- 45,243 · -33.6%
Race, ethnicity, and origin ACS 2023
- Neighborhood character
- Majority White (61%)
- Race & ethnicity
- White 61% Black 29% Two or more races 5% Hispanic / Latino 4%
- Common ancestry
- Romanian 2% Iranian 2% Lithuanian 1%
- Foreign-born
- 3% · Canada
- Languages at home
- 96% English-only · Spanish 2%
Political lean MEDSL · Columbia
- 2024 margin
- Solid R (+50.2) · D 24.6% · R 74.7%
- 2008→2024 swing
- -16.4pp toward R · 2008: -33.8pp · 2024: -50.2pp
- All cycles
- 2024: R+50.2 2020: R+45.2 2016: R+44.5 2012: R+36.7 2008: R+33.8
Not yet ingested
- Civics
- —
Market trends
- HPI YoY
- ▲ 67.79%
- Current HPI
- 348.8923
- Rent YoY
- —
- Metro
- Lake City, FL
- State GDP YoY
- ▲ 3.28%
- F500 in state
- 36
Industry mix (Fortune 500 HQ in FL)
| Industry | F500 HQs | Revenue |
|---|---|---|
| Industrial Technology | 2 | $29B |
|
||
| Insurance | 2 | $17B |
|
||
| Retail | 1 | $60B |
|
||
| Technology Distribution | 1 | $58B |
|
||
| Homebuilding | 1 | $35B |
|
||
| Technology Manufacturing | 1 | $35B |
|
||
Price history
+481.8% since first listed10 events — show timeline
- 2026-04-16 Relisted — NFMLS
- 2026-04-16 Price Changed $160,000 NFMLS
- 2026-01-08 Price Changed $200,000 NFMLS
- 2025-09-10 Listed $219,000 NFMLS
- 2022-10-03 Sold (Public Records) $195,000 Public Records
- 2022-09-27 Sold (MLS) $195,000 Stellar MLS as Distributed by MLS Grid
- 2022-08-12 Listing Removed — Stellar MLS as Distributed by MLS Grid
- 2021-09-14 Listed $189,900 Stellar MLS as Distributed by MLS Grid
- 2018-07-25 Sold (Public Records) $162,000 Public Records
- 2005-11-01 Sold (Public Records) $27,500 Public Records
Property tax history
+32.4%/yrLatest (2025): $2,506 · -0.9% YoY. Source: county tax records.
Cash-flow waterfall
monthlySold comps — $/sqft
last 12 mo · ≤1 miLoading sold comps…