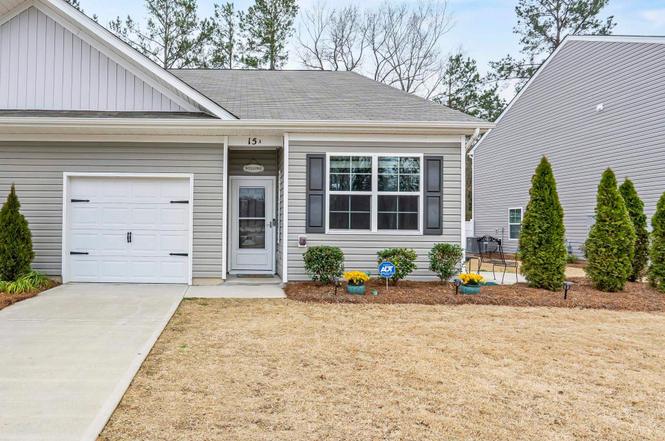
15 A Beechnut · Lugoff, SC
Flood risk No data
- FEMA flood zone
- —
- Chance of flooding over 30 yrs
- —
- Est. flood insurance / yr
- —
Fire risk No data
- Est. fire insurance / yr
- —
Heat risk No data
- Hot days now (above threshold)
- —
- Hot days in 30 yrs
- —
Wind risk No data
- Chance of severe wind over 30 yrs
- —
Air-quality risk No data
- Unhealthy air days now
- —
- Unhealthy air days in 30 yrs
- —
Risk factors via First Street. Map © Google.
Why this score? — see what drove the D- grade
The composite is a weighted blend of 9 inputs, each scored 0–100. Each bar is that input's sub-score; the figure is the points it added to the 100-point composite (weight × sub-score).
- Cash flow +11.9/30.0
- ARV discount +7.5/15.0
- 1% rule +4.1/10.0
- Schools +3.8/10.0
- Livability +3.6/5.0
- DSCR +3.5/10.0
- Rent growth +2.5/5.0
- Condition / age +2.5/5.0
- Appreciation +0.0/10.0
$220,000
🖨 Deal sheet (PDF) 📄 Offer letter ✓ Due diligence
Listing remarks
This meticulously maintained, move-in ready former model home has everything buyers want. The original (and only) owner has lived here since September 2025 and added thoughtful upgrades throughout. Highlights include upgraded built-in wood shelving in the pantry and laundry area, new remote-control ceiling fans in every room, a new storm door and a home security system. It’s the only home in the neighborhood with additional landscaping and an extra concrete pad on the side of the home. Maintenance-free yard — HOA pays landscapers. Single-level living at the front of the neighborhood, close to I-20, shopping, and popular dining. Award-winning schools. If you want to have all of t
Key facts
- Extra concrete pad
- Home security system
- Single-level living
Tags
Neighborhood map
What this means for you Summary
Snapshot
- This is a 3-bed/2.0-bath other listed at $220k.
Deal economics
- At list price, monthly cash flow is $-56 ($-666/yr) — negative.
- To cash-flow at today's rent, offer at most $210k (4.5% below list).
- To meet the 1% rule (rent ≥ 1% of price), the offer needs to be $200k (9.2% below list).
- Recommended offer: $200k (9.2% below list) — sets the bar for 1% rule.
Location & tenants
- Location reads 71/100 on livability (#47 in SC) — a middle-class / working-renter tenant base. Strengths: cost of living A+, housing A+, health & safety A+; Watch: amenities F, commute F.
- Kershaw 01 (rural): math 38% / reading 51% proficiency, ranked #25 of 80 in SC (top 31%) — families likely to look elsewhere, expect single-tenant / working-renter base with shorter leases.
- Zoned schools: Lugoff Elementary (math 44% / reading 51%, grade D, #199 of 597 statewide, top 35%, 526 students, 100% FRL); Lugoff-Elgin Middle (math 31% / reading 44%, grade F, #90 of 229 statewide, top 42%, 668 students, 68% FRL); Lugoff-Elgin High (math 65% / reading 89%, grade A-, #28 of 196 statewide, top 16%, 1,744 students, 62% FRL) — zoned schools average 77% FRL vs 49% district-wide (28 pts higher); higher-poverty schools than district average — tighter screening recommended.
- Market conditions: 181 active listings in the ZIP; 8 comparable units currently listed for rent nearby; rentals leasing fast (median 5d on market — plan ~1-2 weeks tenant-placement turnaround); 491 units permitted in Kershaw County in 2024 (0 in 5+ unit buildings).
- This rent runs 35% of the median local income ($68k/yr) — at the standard rent-burdened threshold; future hikes will face affordability resistance.
Forward outlook
- Local home prices are declining (-3.0%/yr); year-one equity from $2k of loan paydown is wiped out by about $7k of value loss. Plan a longer hold.
- Kershaw County population projected at +8% by 2050 — modest demand growth; plan on rents tracking national, not racing it.
Negotiation context
- It's been on market 24 days — a 2% lower offer ($217k) is reasonable based on typical stale-listing flexibility.
Questions for the listing agent
- What do current leases actually rent for vs. the listed asking? Can we see a recent rent roll and the last 12 months of T-12 income?
- Is there a deadline driving the sale (1031 exchange, divorce, estate, relocation)? That informs how much negotiation room exists.
- The area grade is low — what's the realistic commute time and amenity access for the typical tenant pool here? Any planned neighborhood developments (good or bad) we should know about?
- What's the average days-on-market for RENTAL listings here right now (not sales)? A rising rental-DOM trend means longer vacancies and softer asking-rent achievability than the comps imply.
- What's the recent tenant-quality profile in this submarket — average credit score on applications, eviction rate, late-payment / NSF rate, and stable-employment percentage? A property-management company in the area should have these aggregated.
- How much new for-sale + rental construction is in the pipeline within 1–3 miles? Heavy new supply typically softens prices + rents 12–24 months out; constrained supply supports both.
Investment metrics
- 1% rule
- 0.91% ✗
- Cap rate
- 5.99%
- Cash-on-cash
- -1.08%
- DSCR
- 0.95
- GRM
- 9.2
CMA / ARV
No comps found within radius.
Projected returns pro-forma
-3.0% appreciation · 3.0% rent growth · sell at horizon
- IRR
- -18.0%
- Equity multiple
- 0.37×
- Total profit
- $-39,087
- Equity at exit
- $32,803
- IRR
- -10.1%
- Equity multiple
- 0.38×
- Total profit
- $-38,186
- Equity at exit
- $19,022
Cash invested: $61,600 (down + closing). Projections, not guarantees.
Landlord ↔ Tenant lean methodology
- Overall (STATE)
- 90 Strongly Landlord-Friendly
- State South Carolina
- 90 Strongly Landlord-Friendly · R+6
- County
- — inherits STATE
- City
- — inherits STATE
ZIP-level market 29078
- Home prices YoY
- -22.9%
- Active inventory
- 181
- Price-to-rent
- 9.2×
Monthly cashflow live
- Estimated rent
- $1,997 high interval (Pro) →
- Mortgage (P&I)
- −$1,154
- Tax from tax record
- −$387 /mo · $4,649/yr
- Insurance
- −$92
- HOA
- −$0
- Vacancy / Maint / Mgmt
- −$419
- Net cashflow
- $-56
Break-even live
Sensitivity live
| Price | -10% $69 | -5% $7 | +0% $-56 | +5% $-118 | +10% $-180 |
|---|---|---|---|---|---|
| Rent | -10% $-213 | -5% $-134 | +0% $-56 | +5% $23 | +10% $102 |
| Rate | -1.0pp $55 | -0.5pp $0 | base $-56 | +0.5pp $-113 | +1.0pp $-171 |
UW: 25.0% down · 7.5% · 30yr · 1.5% tax · 5.0% vac · 8.0% maint · 8.0% mgmt
Financing live
Cash to close
- Down payment
- $55,000
- Closing costs
- $6,600
- Reserves months
- —
- Total cash needed
- —
Loan-product check · same deal, 3 products live
Conventional
25% down · 7.5% · 30yr
- Down + closing
- —
- Monthly P&I
- —
- Monthly cashflow
- —
- DSCR
- —
- Eligible?
- —
Personal DTI + credit; lowest rate.
DSCR
20% down · 8.5% · 30yr
- Down + closing
- —
- Monthly P&I
- —
- Monthly cashflow
- —
- DSCR
- —
- Eligible?
- —
No personal income docs; deal must DSCR.
Hard money
10% down · 12.0% · 12mo
- Down + closing
- —
- Monthly P&I
- —
- Monthly cashflow
- —
- DSCR
- —
- Eligible?
- —
Short-term bridge; refi at stabilization.
Rent comps 8 comps
| Address | Beds | Baths | Sqft | Rent | $/sqft | DOM | Units | Dist |
|---|---|---|---|---|---|---|---|---|
| 300 Pine Point Rd Unit D Lugoff, SC | 3.0 | 2.5 | 1470 | $1,750 | $1.19 | 5d | 1 | 0.08mi |
| 1302 Champions Rest Rd Unit C Lugoff, SC | 3.0 | 2.5 | 1383 | $2,000 | $1.45 | 5d | 1 | 0.11mi |
| 1302 Champions Rest Rd Unit B Lugoff, SC | 3.0 | 2.5 | 1383 | $1,900 | $1.37 | 5d | 1 | 0.11mi |
| 260 Pine Point Rd Unit C Lugoff, SC | 3.0 | 2.5 | 1335 | $1,900 | $1.42 | 13d | 1 | 0.12mi |
| 1292 Champions Rest Rd Unit A Lugoff, SC | 3.0 | 2.5 | 1383 | $2,100 | $1.52 | 25d | 1 | 0.13mi |
| 139 Triumph Ave Unit C Lugoff, SC | 3.0 | 2.5 | 1485 | $1,899 | $1.28 | 16d | 1 | 0.21mi |
| 186 State Rd S-28-743 Lugoff, SC | 2.0–3.0 | 2.0 | 1025 | $1,199 | $1.17 | 4d | 6 | 0.33mi |
| 40 State Rd S-28-910 Lugoff, SC | 1.0–3.0 | 1.0–2.0 | 930 | $1,249 | $1.34 | 4d | 3 | 0.35mi |
Listing history 4 events
-
2026-03-30status Pending
-
2026-03-17price $220,000
-
2026-03-07price $222,000
-
2026-03-06$220,900 Active
ⓘ Source: listings_history table (triggers on properties + properties_extension) + one-shot
backfill from property_details.listing_events for pre-trigger history.
Tax reassessment forecast SC · Resets to sale price
- Current annual tax
- $4,649 · $387/mo
- Projected year-2 tax
- $4,649 · $387/mo
- Expected delta
- $0/yr ($0/mo · 0.0%)
ⓘ Screening estimate from a state-policy table — verify with the county assessor before closing.
Nearby sold comps map
Loading sold comps map…
Walkable amenities ~0.75 mi
Loading nearby amenities…
Taxation est. · year 1
- Rental income
- $23,958
- − Mortgage interest
- −$12,323
- − Property taxes
- −$4,649
- − Insurance
- −$1,100
- − Repairs & maintenance
- −$1,917
- − Management
- −$1,917
- − Depreciation
- −$6,400
- Taxable loss
- −$4,347
- Est. tax savings @ 24.0%
- +$1,043
- After-tax cash flow
- $377/yr
For passive investors: Depreciation is non-cash, so a rental often shows a tax loss while cash-flowing — sheltering income. Rental losses are passive: they offset passive income freely, and up to $25,000/yr can offset ordinary (W-2) income if you actively participate and your MAGI is under $100k (phasing out to $0 by $150k); unused losses carry forward. On sale, claimed depreciation is recaptured at up to 25%, and gains may owe capital-gains tax (a 1031 exchange can defer both). Figures are a year-1 estimate at your 24.0% rate — not tax advice; consult a CPA.
Schools (NCES district)
- District
- Kershaw 01
- NCES district ID
- 4502550
- Math proficiency
- 38% ▼ -7.00%
- Reading proficiency
- 51% ▲ 6.00%
- Median HH income
- $44,585
- Composite
- 37.66/100
- National rank
- #4371
- State rank
- #25 of 80 in SC
Livability — Lugoff
- Score
- 71/100
- State rank
- #47
- US rank
- #6636
Category grades
Schools grade is shown separately in the Schools card above.
Census & demographics
- Census place
- Lugoff, SC
- County
- Kershaw County · 47,655 people
- City population
- 16,283
- Metro
- Columbia, SC
- Population (ZIP)
- 16,283
- Household income
- $67,727
- Rent vs Own
- Severe rent burden
- 61.0
Population outlook (Kershaw County) Hauer SSP2
- Today (2025)
- 67,683 people
- By 2030
- 69,374 · +2.5%
- By 2040
- 71,936 · +6.3%
- By 2050
- 73,292 · +8.3%
- By 2075
- 75,762 · +11.9%
- By 2100
- 72,620 · +7.3%
Race, ethnicity, and origin ACS 2023
- Neighborhood character
- Predominantly White (74%)
- Race & ethnicity
- White 74% Black 18% Hispanic / Latino 6% Two or more races 4%
- Hispanic origin (detail)
- Puerto Rican 3%
- Common ancestry
- Italian 2% Lithuanian 2% Slovak 1%
- Foreign-born
- 2% · Canada
- Languages at home
- 93% English-only · Spanish 6%
Political lean MEDSL · Kershaw
- 2024 margin
- Strong R (+28.2) · D 35.3% · R 63.5% · Other 1.2%
- 2008→2024 swing
- -9.5pp toward R · 2008: -18.7pp · 2024: -28.2pp
- All cycles
- 2024: R+28.2 2020: R+23.1 2016: R+24.8 2012: R+18.6 2008: R+18.7
Not yet ingested
- Civics
- —
Market trends
- HPI YoY
- ▼ -62.83%
- Current HPI
- 211.3661
- Rent YoY
- —
- Metro
- Columbia, SC
- State GDP YoY
- ▲ 4.51%
- F500 in state
- 2
Industry mix (Fortune 500 HQ in SC)
| Industry | F500 HQs | Revenue |
|---|---|---|
| Packaging | 1 | $7B |
|
||
Price history
-0.4% since first listed4 events — show timeline
- 2026-03-30 Pending — Consolidated MLS
- 2026-03-17 Price Changed $220,000 Consolidated MLS
- 2026-03-07 Price Changed $222,000 Consolidated MLS
- 2026-03-06 Listed $220,900 Consolidated MLS
Cash-flow waterfall
monthlySold comps — $/sqft
last 12 mo · ≤1 miLoading sold comps…