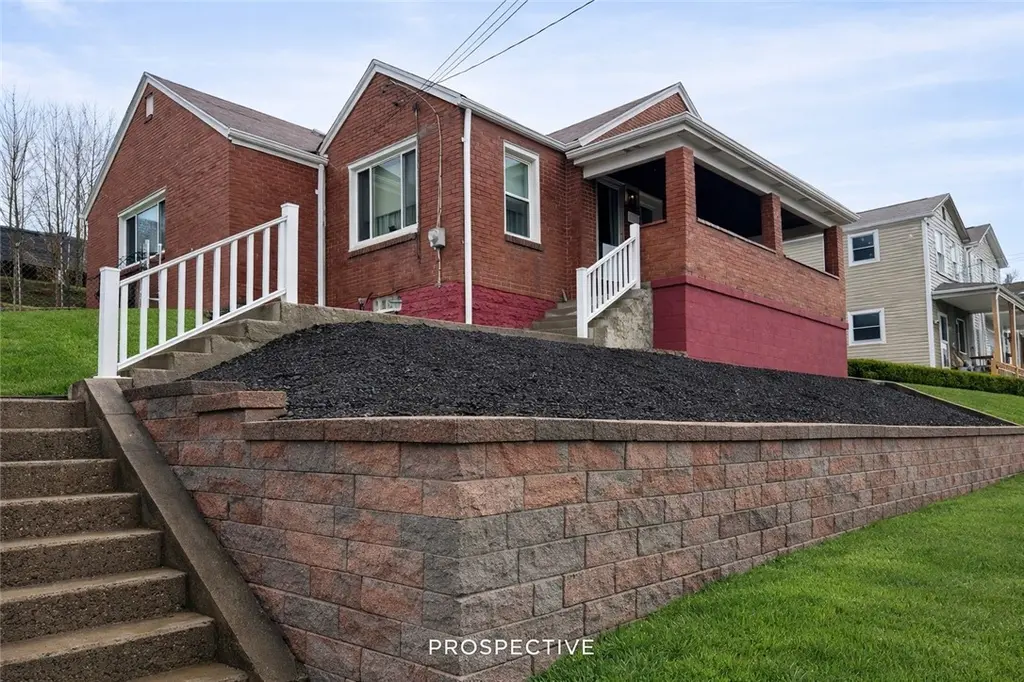
703 Laura St · West Mifflin, PA
Flood risk 1/10 · Minimal
- FEMA flood zone
- X (unshaded)
- Chance of flooding over 30 yrs
- 0.0%
- Est. flood insurance / yr
- $473 – $860
Fire risk 1/10 · Minimal
- Est. fire insurance / yr
- $511 – $949
Heat risk 4/10 · Minor
- Hot days now (above 97°F)
- 7 days/yr
- Hot days in 30 yrs
- 17 days/yr
Wind risk 2/10 · Minimal
- Chance of severe wind over 30 yrs
- —
Air-quality risk 4/10 · Minor
- Unhealthy air days now
- 4 days/yr
- Unhealthy air days in 30 yrs
- 5 days/yr
Risk factors via First Street. Map © Google.
Why this score? — see what drove the B+ grade
The composite is a weighted blend of 9 inputs, each scored 0–100. Each bar is that input's sub-score; the figure is the points it added to the 100-point composite (weight × sub-score).
- Cash flow +30.0/30.0
- ARV discount +15.0/15.0
- 1% rule +10.0/10.0
- DSCR +10.0/10.0
- Livability +3.7/5.0
- Schools +2.6/10.0
- Rent growth +2.5/5.0
- Condition / age +2.5/5.0
- Appreciation +0.0/10.0
$103,000
🖨 Deal sheet 📄 Offer letter ✓ Due diligence
Listing remarks
Welcome to 703 Laura Ave! Solid red brick 3 bed, 1 bath home w/ great curb appeal featuring a covered front porch & nicely landscaped front bed. The backyard offers a great space for outdoor activities, entertaining, or relaxing. Step inside to a functional layout ready for your personal touch. The home is in good overall condition w/ opportunity to add value through mostly cosmetic updates. Major updates already completed include HVAC (within 6 years), newer hot water tank (under 2 years), windows (within 5 years), plumbing updates, & a new sewer line. The full basement is clean & mostly unfinished offering great storage or potential additional living space. Minor repairs
Key facts
- Covered front porch
- Great storage
- Functional layout
Tags
Property features AI
Finance
- HOA & community: Public transportation nearby
Exterior
- Parking: Built-in attached garage (1 parking space)
- Home design: Single-story home; Resale property; Asphalt roof; Brick construction
- Construction: Brick construction; Asphalt roof
- Exterior features: Walk-out unfinished basement
Interior
- Kitchen: Refrigerator
- Flooring: Carpet; Hardwood; Vinyl
- Bathrooms: 1 full bathroom
- Heating & cooling: Forced air heating; Gas heating
- Interior features: Multi-pane windows
Neighborhood map
What this means for you Summary
Snapshot
- This is a 3-bed/1.0-bath single-family listed at $103k.
Deal economics
- At list price, monthly cash flow is $462 ($6k/yr) — positive.
- The deal already cash-flows at list — no discount required.
- Meets the 1% rule at list price ($2k rent vs $103k).
- Recommended offer: $100k (3.0% below list) — sets the bar for market timing.
- Cap rate 11.7% vs local median 5.2% in West Mifflin — top-decile yield for the area; either an underpriced asset or a hidden risk that comps aren't pricing in. Stress-test before assuming the spread holds.
Location & tenants
- Location reads 73/100 on livability (#539 in PA) — a middle-class / working-renter tenant base. Strengths: cost of living A+, housing A+, schools B+; Watch: health & safety D, crime D-, amenities F.
- West Mifflin Area SD (suburban): math 19% / reading 41% proficiency, ranked #443 of 539 in PA (top 82%) — families likely to look elsewhere, expect single-tenant / working-renter base with shorter leases.
- Market conditions: 58 active listings in the ZIP; 9 comparable units currently listed for rent nearby; rentals at typical pace (median 24d on market — plan ~3-4 weeks tenant-placement turnaround); 44% of comp listings sitting > 30 days — soft ceiling on asking rent; 2,996 units permitted in Allegheny County in 2024 (1,588 in 5+ unit buildings).
Forward outlook
- Local home prices are declining (-3.0%/yr); year-one equity from $712 of loan paydown is wiped out by about $3k of value loss. Plan a longer hold.
- At projected returns (-3.0% appreciation + 3.0% rent growth), your $29k cash investment doubles in ~7 years — after that, you're playing with house money.
Negotiation context
- It's been on market 55 days — a 3% lower offer ($100k) is reasonable based on typical stale-listing flexibility.
- Current owner paid $42k; list at $103k implies a 142% gain — meaningful room to come down on a strong offer.
Risks & watch-outs
- Watch-outs: property tax is 3.4% of price; built in 1940 — expect roof / HVAC / electrical / plumbing capex.
Questions for the listing agent
- It's been on market 55 days. Have you received any prior offers? Is the seller open to a 3% concession, seller financing, or rate buy-down credit?
- Built in 1940 — when were the roof, HVAC, electrical panel, plumbing, and water heater last replaced?
- Property tax is high relative to price — has the assessment been appealed recently, and will the sale trigger a re-assessment?
- Is there a deadline driving the sale (1031 exchange, divorce, estate, relocation)? That informs how much negotiation room exists.
- Schools are B-rated — typically a magnet for longer-tenancy family renters. What's the average tenant stay here, and is there a school-zone premium baked into asking?
- Crime grade is D in this area — have there been break-ins, vandalism, or insurance claims at this property in the last 3 years? What carrier currently insures it and at what premium?
- What's the average days-on-market for RENTAL listings here right now (not sales)? A rising rental-DOM trend means longer vacancies and softer asking-rent achievability than the comps imply.
- What's the recent tenant-quality profile in this submarket — average credit score on applications, eviction rate, late-payment / NSF rate, and stable-employment percentage? A property-management company in the area should have these aggregated.
- How much new for-sale + rental construction is in the pipeline within 1–3 miles? Heavy new supply typically softens prices + rents 12–24 months out; constrained supply supports both.
Investment metrics
- 1% rule
- 1.65% ✓
- Cap rate
- 11.67%
- Cash-on-cash
- 19.21%
- DSCR
- 1.85
- GRM
- 5.1
CMA / ARV
- ARV (on-the-fly)
- $148,608
- Comps found
- 12
Show comp detail 12 sales within ~0.75 mi
| Address | Dist | Beds/Ba | Sqft | Sold | Price | $/sf | Match |
|---|---|---|---|---|---|---|---|
| 703 Laura St | 0.00mi | 3/1.0 | 1,376 (0%) | 1mo | $115,000 | $84 | 99 |
| 4619 Greensprings Ave | 0.21mi | 3/1.0 | 1,450 (+5%) | 0mo | $185,000 | $128 | 81 |
| 724 Laura St | 0.06mi | 2/2.5 (-1) | 1,296 (-6%) | 3mo | $55,000 | $42 | 74 |
| 105 W 1st Ave | 0.37mi | 3/2.0 | 1,360 (-1%) | 5mo | $79,000 | $58 | 73 |
| 3909 Inland Ave | 0.51mi | 3/1.0 | 1,272 (-8%) | 2mo | $138,000 | $108 | 62 |
| 809 Frank St | 0.31mi | 3/1.5 | 1,576 (+14%) | 1mo | $133,000 | $84 | 59 |
| 403 Oak St | 0.61mi | 3/2.0 | 1,450 (+5%) | 1mo | $250,000 | $172 | 58 |
| 4803 Roberta Dr | 0.33mi | 3/1.0 | 1,187 (-14%) | 5mo | $125,000 | $105 | 57 |
| 328 Commonwealth Ave | 0.47mi | 2/1.0 (-1) | 1,216 (-12%) | 2mo | $102,000 | $84 | 52 |
| 725 Eastman St | 0.33mi | 3/3.0 | 1,549 (+13%) | 5mo | $253,500 | $164 | 52 |
| 216 Commonwealth Ave | 0.38mi | 4/2.0 (+1) | 1,540 (+12%) | 3mo | $218,000 | $142 | 51 |
| 409 Victoria St | 0.74mi | 3/1.0 | 1,545 (+12%) | 1mo | $230,000 | $149 | 44 |
Match score weights: distance 35% · size 25% · config 20% · recency 20%. Top-matched comps best support the ARV.
Projected returns pro-forma
-3.0% appreciation · 3.0% rent growth · sell at horizon
- IRR
- 11.2%
- Equity multiple
- 1.45×
- Total profit
- $12,842
- Equity at exit
- $15,358
- IRR
- 20.3%
- Equity multiple
- 2.72×
- Total profit
- $49,564
- Equity at exit
- $8,906
Cash invested: $28,840 (down + closing). Projections, not guarantees.
Landlord ↔ Tenant lean methodology
- Overall (STATE)
- 62 Landlord-Friendly
- State Pennsylvania
- 62 Landlord-Friendly · EVEN
- County
- — inherits STATE
- City
- — inherits STATE
ZIP-level market 15122
- Home prices YoY
- -30.4%
- Active inventory
- 58
- Price-to-rent
- 5.1×
Monthly cashflow live
- Estimated rent
- $1,695 high interval (Pro) →
- Mortgage (P&I)
- −$540
- Tax from tax record
- −$294 /mo · $3,530/yr
- Insurance
- −$43
- HOA
- −$0
- Vacancy / Maint / Mgmt
- −$356
- Net cashflow
- $462
Break-even live
UW: 25.0% down · 7.5% · 30yr · 1.5% tax · 5.0% vac · 8.0% maint · 8.0% mgmt
Financing live
Cash to close
- Down payment
- $25,750
- Closing costs
- $3,090
- Reserves months
- —
- Total cash needed
- —
Loan-product check · same deal, 3 products live
Conventional
25% down · 7.5% · 30yr
- Down + closing
- —
- Monthly P&I
- —
- Monthly cashflow
- —
- DSCR
- —
- Eligible?
- —
Personal DTI + credit; lowest rate.
DSCR
20% down · 8.5% · 30yr
- Down + closing
- —
- Monthly P&I
- —
- Monthly cashflow
- —
- DSCR
- —
- Eligible?
- —
No personal income docs; deal must DSCR.
Hard money
10% down · 12.0% · 12mo
- Down + closing
- —
- Monthly P&I
- —
- Monthly cashflow
- —
- DSCR
- —
- Eligible?
- —
Short-term bridge; refi at stabilization.
Rent comps 9 comps
| Address | Beds | Baths | Sqft | Rent | $/sqft | DOM | Units | Dist |
|---|---|---|---|---|---|---|---|---|
| 335 Commonwealth Ave West Mifflin, PA | 2.0 | 2.0 | 1536 | $2,500 | $1.63 | 43d | 1 | 0.46mi |
| 308 Lea St Homestead, PA | 4.0 | 2.0 | 1480 | $1,490 | $1.01 | 3d | 1 | 0.89mi |
| 218 Mary St Homestead, PA | 3.0 | 1.0 | 1776 | $1,400 | $0.79 | 21d | 1 | 0.99mi |
| 800 Richford St Duquesne, PA | 3.0 | 1.0 | 1300 | $1,600 | $1.23 | 23d | 1 | 1.20mi |
| 715 Grant Avenue Ext West Mifflin, PA | 3.0 | 2.0 | 1400 | $1,450 | $1.04 | 7d | 1 | 1.21mi |
| 3705 Botsford St Apt 2 Munhall, PA | 3.0 | 1.0 | 1000 | $1,195 | $1.20 | 43d | 1 | 1.31mi |
| 214 Vine St Homestead, PA | 2.0 | 1.0 | 1034 | $1,150 | $1.11 | 43d | 1 | 1.33mi |
| 537 6th St Braddock, PA | 3.0 | 1.0 | 1360 | $1,400 | $1.03 | 43d | 1 | 1.36mi |
| 931 Hilltop St Homestead, PA | 3.0 | 1.5 | 1312 | $1,500 | $1.14 | 14d | 1 | 1.48mi |
Listing history 3 events
-
2026-04-07historical Contingent
-
2026-04-01$103,000 Active
-
1987-04-30soldstatus $42,500
ⓘ Source: listings_history table (triggers on properties + properties_extension) + one-shot
backfill from property_details.listing_events for pre-trigger history.
Tax reassessment forecast PA · Partial reset (capped growth)
- Current annual tax
- $3,530 · $294/mo
- Projected year-2 tax
- $3,530 · $294/mo
- Expected delta
- $0/yr ($0/mo · 0.0%)
ⓘ Screening estimate from a state-policy table — verify with the county assessor before closing.
Climate risk First Street
- Flood 1/10 Low FEMA zone X (unshaded) · 0% chance over 30 yrs
- Wildfire 1/10 Low
- Heat 4/10 Moderate 7 d/yr ≥97°F today · 17 d/yr by 30 yrs out
- Wind 2/10 Low
- Air quality 4/10 Moderate 4 unhealthy d/yr today · 5 by 30 yrs out
Nearby sold comps map
Loading sold comps map…
Walkable amenities ~0.75 mi
Loading nearby amenities…
Taxation est. · year 1
- Rental income
- $20,338
- − Mortgage interest
- −$5,770
- − Property taxes
- −$3,530
- − Insurance
- −$515
- − Repairs & maintenance
- −$1,627
- − Management
- −$1,627
- − Depreciation
- −$2,996
- Taxable income
- $4,273
- Est. tax owed @ 24.0%
- −$1,026
- After-tax cash flow
- $4,515/yr
For passive investors: Depreciation is non-cash, so a rental often shows a tax loss while cash-flowing — sheltering income. Rental losses are passive: they offset passive income freely, and up to $25,000/yr can offset ordinary (W-2) income if you actively participate and your MAGI is under $100k (phasing out to $0 by $150k); unused losses carry forward. On sale, claimed depreciation is recaptured at up to 25%, and gains may owe capital-gains tax (a 1031 exchange can defer both). Figures are a year-1 estimate at your 24.0% rate — not tax advice; consult a CPA.
Schools (NCES district)
- District
- West Mifflin Area SD
- NCES district ID
- 4225680
- Math proficiency
- 19% ▼ -19.00%
- Reading proficiency
- 41% ▼ -14.00%
- Median HH income
- $46,532
- Composite
- 25.78/100
- National rank
- #7371
- State rank
- #443 of 539 in PA
Livability — West Mifflin
- Score
- 73/100
- State rank
- #539
- US rank
- #5042
Category grades
Schools grade is shown separately in the Schools card above.
Census & demographics
- Census place
- West Mifflin, PA
- County
- Allegheny County · 1,022,028 people
- City population
- 18,816
- Metro
- Pittsburgh, PA
- Population (ZIP)
- 18,816
- Household income
- $72,485
- Rent vs Own
- Severe rent burden
- 334.0
Population outlook (Allegheny County) Hauer SSP2
- Today (2025)
- 1,250,282 people
- By 2030
- 1,256,482 · +0.5%
- By 2040
- 1,256,318 · +0.5%
- By 2050
- 1,244,169 · -0.5%
- By 2075
- 1,197,693 · -4.2%
- By 2100
- 1,093,187 · -12.6%
Race, ethnicity, and origin ACS 2023
- Neighborhood character
- Predominantly White (81%)
- Race & ethnicity
- White 81% Black 9% Two or more races 7% Hispanic / Latino 2% Asian 1%
- Common ancestry
- Romanian 9% Slovak 1% Scotch-Irish 1%
- Foreign-born
- 1% · South Korea
- Languages at home
- 93% English-only · Spanish 4% Other Indo-European 1%
Political lean MEDSL · Allegheny
- 2024 margin
- Strong D (+20.3) · D 59.7% · R 39.4%
- 2008→2024 swing
- +4.8pp toward D · 2008: 15.5pp · 2024: 20.3pp
- All cycles
- 2024: D+20.3 2020: D+20.4 2016: D+16.4 2012: D+14.4 2008: D+15.5
Not yet ingested
- Civics
- —
Market trends
- HPI YoY
- ▼ -107.69%
- Current HPI
- 246.2486
- Rent YoY
- —
- Metro
- Pittsburgh, PA
- State GDP YoY
- ▲ 1.68%
- F500 in state
- 34
Industry mix (Fortune 500 HQ in PA)
| Industry | F500 HQs | Revenue |
|---|---|---|
| Healthcare | 2 | $309B |
|
||
| Insurance | 2 | $27B |
|
||
| Telecommunications / Media | 1 | $124B |
|
||
| Industrial Distribution | 1 | $22B |
|
||
| Financial Services | 1 | $20B |
|
||
| Chemicals / Materials | 1 | $18B |
|
||
Price history
+142.4% since first listed3 events — show timeline
- 2026-04-07 Contingent — West Penn MLS
- 2026-04-01 Listed $103,000 West Penn MLS
- 1987-04-30 Sold (Public Records) $42,500 Public Records
Property tax history
+3.4%/yrLatest (2026): $3,530 · +4.1% YoY. Source: county tax records.
Cash-flow waterfall
monthlySold comps — $/sqft
last 12 mo · ≤1 miLoading sold comps…