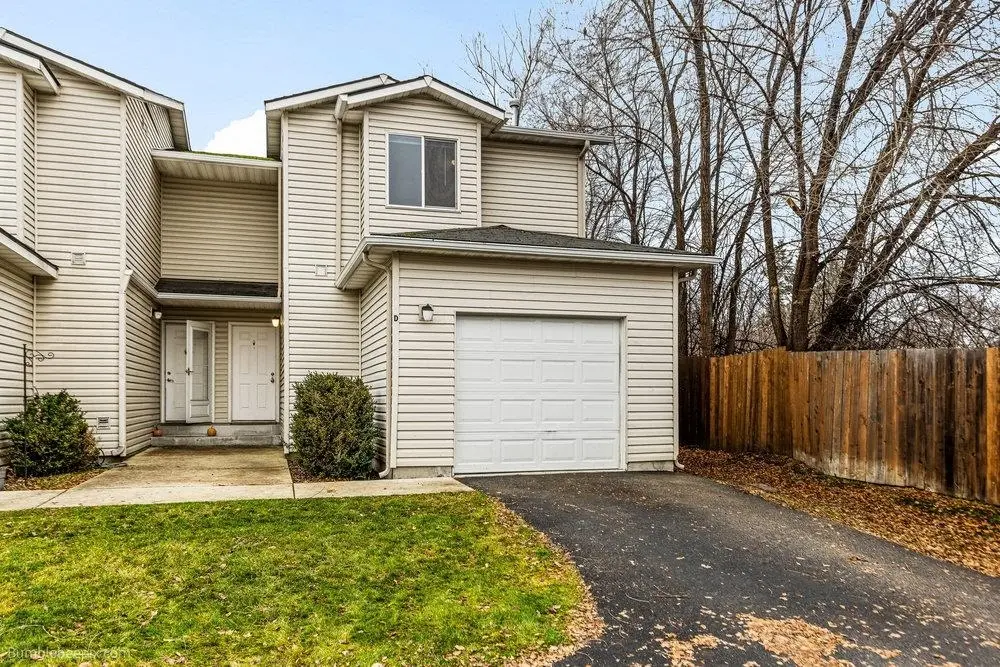
11212 E 4th Ave · Spokane Valley, WA
Flood risk 1/10 · Minimal
- FEMA flood zone
- X (unshaded)
- Chance of flooding over 30 yrs
- 0.0%
- Est. flood insurance / yr
- $507 – $1,088
Fire risk 2/10 · Minimal
- Est. fire insurance / yr
- $604 – $1,122
Heat risk 3/10 · Minor
- Hot days now (above 94°F)
- 7 days/yr
- Hot days in 30 yrs
- 15 days/yr
Wind risk 1/10 · Minimal
- Chance of severe wind over 30 yrs
- —
Air-quality risk 9/10 · Severe
- Unhealthy air days now
- 17 days/yr
- Unhealthy air days in 30 yrs
- 17 days/yr
Risk factors via First Street. Map © Google.
Why this score? — see what drove the D grade
The composite is a weighted blend of 9 inputs, each scored 0–100. Each bar is that input's sub-score; the figure is the points it added to the 100-point composite (weight × sub-score).
- ARV discount +15.0/15.0
- Cash flow +6.2/30.0
- Schools +5.4/10.0
- Livability +4.2/5.0
- Condition / age +3.8/5.0
- Rent growth +3.1/5.0
- 1% rule +2.3/10.0
- DSCR +0.5/10.0
- Appreciation +0.0/10.0
$230,000
🖨 Deal sheet (PDF) 📄 Offer letter ✓ Due diligence
Listing remarks
Welcome home to this charming Spokane Valley townhome featuring 3 beds, 3 baths, low-maintenance layout. Enjoy a bright main floor with a cozy living room, functional kitchen, and main-level laundry. Upstairs, the primary suite with private bath as well as two additional bedrooms offering flexible space. Stay comfortable with central A/C, gas-forced heat, and a one-car garage. The fully fenced yard with sprinkler system offering privacy. The HOA covers common-area upkeep and snow removal—easy living at its best.
Key facts
- Functional kitchen
- Flexible space
- Cozy living room
Tags
Property features AI
Finance
- HOA & community: HOA with a monthly fee of $148; Community features: see remarks
Exterior
- Parking: Attached garage with garage door opener; Shared driveway; 1 garage space
- Utilities: High-speed internet available
- Home design: Residential condominium; Two-story
- Construction: Siding exterior; Composition roof
- Exterior features: Fenced yard with fencing; Automatic sprinkler system; Level lot; Private, paved road frontage
Interior
- Kitchen: Range; Refrigerator; Disposal
- Bedrooms: 3 bedrooms
- Heating & cooling: Natural gas forced air heating; Central air conditioning
- Interior features: Kitchen island; Utility room
- Laundry & utility: Washer; Dryer
Neighborhood map
What this means for you Summary
Snapshot
- This is a 3-bed/3.0-bath townhouse listed at $230k. Condition is rated good.
Deal economics
- At list price, monthly cash flow is $-417 ($-5k/yr) — negative.
- To cash-flow at today's rent, offer at most $170k (26.2% below list).
- To meet the 1% rule (rent ≥ 1% of price), the offer needs to be $167k (27.3% below list).
- Recommended offer: $167k (27.3% below list) — sets the bar for 1% rule.
- Cap rate 4.1% vs local median 2.9% in Spokane Valley — top-decile yield for the area; either an underpriced asset or a hidden risk that comps aren't pricing in. Stress-test before assuming the spread holds.
Location & tenants
- Location reads 85/100 on livability (#31 in WA, #512 nationally) — a professional / high-income tenant draw. Strengths: amenities A+, commute A+, housing A+; Watch: crime D+.
- Central Valley School District (urban): math 55% / reading 66% proficiency, ranked #55 of 291 in WA (top 19%) — acceptable for families but not a draw, mixed tenant base, ~2y average lease.
- Zoned schools: Opportunity Elementary (634 students, 66% FRL); North Pines Middle School (509 students, 75% FRL); University High School (1,445 students, 46% FRL) — zoned schools average 62% FRL vs 28% district-wide (34 pts higher); higher-poverty schools than district average — tighter screening recommended.
- Market conditions: Rents rising (+2.4%/yr); 305 active listings in the ZIP; 39 comparable units currently listed for rent nearby; rentals at typical pace (median 25d on market — plan ~3-4 weeks tenant-placement turnaround); solid renter incomes; 3,608 units permitted in Spokane County in 2024 (1,792 in 5+ unit buildings).
Forward outlook
- Local home prices are declining (-3.0%/yr); year-one equity from $2k of loan paydown is wiped out by about $7k of value loss. Plan a longer hold.
- Spokane County population projected at +13% by 2050 — modest demand growth; plan on rents tracking national, not racing it.
Negotiation context
- It's been on market 17 days — a 2% lower offer ($227k) is reasonable based on typical stale-listing flexibility.
- 5 sale attempts since 21y ago with the ask held roughly flat each time — persistent listings suggest the price (not the market) is what's stuck; bring a comps-based counter.
Questions for the listing agent
- What do current leases actually rent for vs. the listed asking? Can we see a recent rent roll and the last 12 months of T-12 income?
- What does the HOA fee cover, when was the last increase, and are there any pending special assessments or reserve-fund shortfalls?
- Is there a deadline driving the sale (1031 exchange, divorce, estate, relocation)? That informs how much negotiation room exists.
- Schools are B-rated — typically a magnet for longer-tenancy family renters. What's the average tenant stay here, and is there a school-zone premium baked into asking?
- Crime grade is D in this area — have there been break-ins, vandalism, or insurance claims at this property in the last 3 years? What carrier currently insures it and at what premium?
- The area grade is low — what's the realistic commute time and amenity access for the typical tenant pool here? Any planned neighborhood developments (good or bad) we should know about?
- What's the average days-on-market for RENTAL listings here right now (not sales)? A rising rental-DOM trend means longer vacancies and softer asking-rent achievability than the comps imply.
- What's the recent tenant-quality profile in this submarket — average credit score on applications, eviction rate, late-payment / NSF rate, and stable-employment percentage? A property-management company in the area should have these aggregated.
- How much new for-sale + rental construction is in the pipeline within 1–3 miles? Heavy new supply typically softens prices + rents 12–24 months out; constrained supply supports both.
Investment metrics
- 1% rule
- 0.73% ✗
- Cap rate
- 4.12%
- Cash-on-cash
- -7.76%
- DSCR
- 0.65
- GRM
- 11.5
CMA / ARV
- ARV (median comp)
- $275,784
- List price
- $230,000
- Delta
- -16.60%
- Verdict
- UNDERPRICED
- Comps
- 2 within 2.0 mi
Show comp detail 5 sales within ~0.75 mi
| Address | Dist | Beds/Ba | Sqft | Sold | Price | $/sf | Match |
|---|---|---|---|---|---|---|---|
| 250 N Raymond St Unit A10 | 0.65mi | 2/1.0 (-1) | 990 (-10%) | 4mo | $203,000 | $205 | 37 |
| 219 N Raymond Rd #4 | 0.65mi | 2/2.0 (-1) | 1,152 (+5%) | 21mo | $244,000 | $212 | 35 |
| 250 N Raymond St Unit B-2 | 0.63mi | 2/1.0 (-1) | 986 (-10%) | 8mo | $214,500 | $218 | 34 |
| 250 N Raymond Rd Unit C-10 | 0.62mi | 2/1.0 (-1) | 990 (-10%) | 14mo | $210,000 | $212 | 30 |
| 250 N Raymond Rd Unit A11 | 0.65mi | 2/1.0 (-1) | 968 (-12%) | 23mo | $200,000 | $207 | 18 |
Match score weights: distance 35% · size 25% · config 20% · recency 20%. Top-matched comps best support the ARV.
Projected returns pro-forma
-3.0% appreciation · 2.44% rent growth · sell at horizon
- IRR
- -30.5%
- Equity multiple
- -0.00×
- Total profit
- $-64,624
- Equity at exit
- $34,294
- IRR
- -35.4%
- Equity multiple
- -0.46×
- Total profit
- $-93,770
- Equity at exit
- $19,886
Cash invested: $64,400 (down + closing). Projections, not guarantees.
Landlord ↔ Tenant lean methodology
- Overall (STATE)
- 28 Tenant-Leaning
- State Washington
- 28 Tenant-Leaning · D+8
- County
- — inherits STATE
- City
- — inherits STATE
ZIP-level market 99206
- Rents YoY
- 2.4%
- Active inventory
- 305
- Price-to-rent
- 11.5×
Monthly cashflow live
- Estimated rent
- $1,672 high interval (Pro) →
- Mortgage (P&I)
- −$1,206
- Tax est. 1.5%
- −$288 /mo · $3,450/yr
- Insurance
- −$96
- HOA
- −$148
- Vacancy / Maint / Mgmt
- −$351
- Net cashflow
- $-417
Break-even live
Sensitivity live
| Price | -10% $-258 | -5% $-337 | +0% $-417 | +5% $-496 | +10% $-576 |
|---|---|---|---|---|---|
| Rent | -10% $-549 | -5% $-483 | +0% $-417 | +5% $-351 | +10% $-285 |
| Rate | -1.0pp $-301 | -0.5pp $-358 | base $-417 | +0.5pp $-476 | +1.0pp $-537 |
UW: 25.0% down · 7.5% · 30yr · 1.5% tax · 5.0% vac · 8.0% maint · 8.0% mgmt
Financing live
Cash to close
- Down payment
- $57,500
- Closing costs
- $6,900
- Reserves months
- —
- Total cash needed
- —
Loan-product check · same deal, 3 products live
Conventional
25% down · 7.5% · 30yr
- Down + closing
- —
- Monthly P&I
- —
- Monthly cashflow
- —
- DSCR
- —
- Eligible?
- —
Personal DTI + credit; lowest rate.
DSCR
20% down · 8.5% · 30yr
- Down + closing
- —
- Monthly P&I
- —
- Monthly cashflow
- —
- DSCR
- —
- Eligible?
- —
No personal income docs; deal must DSCR.
Hard money
10% down · 12.0% · 12mo
- Down + closing
- —
- Monthly P&I
- —
- Monthly cashflow
- —
- DSCR
- —
- Eligible?
- —
Short-term bridge; refi at stabilization.
Rent comps 39 comps
| Address | Beds | Baths | Sqft | Rent | $/sqft | DOM | Units | Dist |
|---|---|---|---|---|---|---|---|---|
| 11319 E 4th Ave Spokane Valley, WA | 2.0 | 1.0 | 943 | $1,725 | $1.83 | 25d | 1 | 0.09mi |
| 22 N Skipworth Rd #14 Spokane Valley, WA | 2.0 | 1.0 | 714 | $1,150 | $1.61 | 22d | 1 | 0.35mi |
| 10808 E 9th Ave Unit 10808 Spokane Valley, WA | 3.0 | 2.0 | 1500 | $1,795 | $1.20 | 25d | 1 | 0.40mi |
| 10808 E 9th Ave Spokane Valley, WA | 3.0 | 2.0 | 1500 | $1,795 | $1.20 | 15d | 1 | 0.40mi |
| 11908 E 4th Ave Spokane Valley, WA | 3.0 | 2.0 | 1250 | $1,895 | $1.52 | 15d | 1 | 0.43mi |
| 11122 E Valleyway Ave Spokane Valley, WA | 2.0 | 1.0 | 940 | $1,250 | $1.33 | 22d | 1 | 0.52mi |
| 10329 E 5th Ln Spokane Valley, WA | 2.0 | 2.0 | 915 | $2,600 | $2.84 | 45d | 1 | 0.54mi |
| 11910 E 10th Ave Spokane Valley, WA | 2.0 | 1.0 | 1208 | $1,400 | $1.16 | 45d | 1 | 0.58mi |
| 12002 E Valleyway Ave Apt 6 Spokane Valley, WA | 2.0 | 2.0 | 950 | $1,475 | $1.55 | 15d | 1 | 0.67mi |
| 12002 E Valleyway Ave Spokane Valley, WA | 2.0 | 2.0 | 950 | $1,325 | $1.39 | 25d | 1 | 0.67mi |
| 205 S Pines Rd Spokane Valley, WA | 1.0–2.0 | 1.0 | 823 | $1,247 | $1.52 | 25d | 17 | 0.69mi |
| 10108 E Appleway Ave Unit B104 Spokane Valley, WA | 2.0 | 2.0 | 983 | $1,300 | $1.32 | 25d | 1 | 0.70mi |
| 10622 E 14th Ave Unit 10622-A Spokane Valley, WA | 2.0 | 1.0 | 920 | $1,450 | $1.58 | 25d | 1 | 0.71mi |
| 12403 E 3rd Ave Spokane Valley, WA | 3.0 | 2.0 | 1100 | $1,580 | $1.44 | 25d | 1 | 0.71mi |
| 12406 E 3rd Ave Unit 12408 Spokane Valley, WA | 2.0 | 1.0 | 780 | $1,095 | $1.40 | 25d | 1 | 0.74mi |
| 601 S Woodruff Rd Spokane Valley, WA | 2.0 | 2.0 | 984 | $1,245 | $1.27 | 45d | 1 | 0.77mi |
| 10211 E 14th Ave Spokane Valley, WA | 1.0–2.0 | 1.0 | 789 | $1,295 | $1.64 | 15d | 1 | 0.82mi |
| 9910 E Appleway Ave Spokane, WA | 1.0–3.0 | 1.0–2.0 | 943 | $1,617 | $1.71 | 15d | 1 | 0.84mi |
| 12112 E Alki Ave Spokane Valley, WA | 2.0 | 2.0 | 1044 | $1,352 | $1.30 | 15d | 3 | 0.85mi |
| 12421 E Riverside Ave Apt 6 Spokane Valley, WA | 2.0 | 1.0 | 850 | $1,200 | $1.41 | 45d | 1 | 0.85mi |
| 12415 E 12th Ave Spokane Valley, WA | 1.0–2.0 | 1.0 | 840 | $1,335 | $1.59 | 15d | 3 | 0.86mi |
| 9812 E 4th Ave Unit 102 Spokane Valley, WA | 2.0 | 1.0 | 900 | $1,345 | $1.49 | 25d | 1 | 0.88mi |
| 111 N Walnut Rd Spokane Valley, WA | 2.0 | 1.0 | 730 | $1,095 | $1.50 | 45d | 2 | 0.90mi |
| 12404 E Olive Ave Unit B101 Spokane Valley, WA | 3.0 | 3.5 | 1259 | $2,150 | $1.71 | 45d | 1 | 0.94mi |
| 11813 E Broadway Ave Spokane Valley, WA | 3.0 | 1.0–2.0 | 918 | $1,826 | $1.99 | 15d | 26 | 0.95mi |
| 515 S Farr Rd Spokane Valley, WA | 1.0–2.0 | 1.0 | 690 | $1,250 | $1.81 | 45d | 1 | 0.95mi |
| 12717 E 4th Ave Spokane Valley, WA | 2.0 | 2.0 | 858 | $1,648 | $1.92 | 15d | 6 | 0.96mi |
| 1019 N Woodward Rd Spokane Valley, WA | 3.0 | 1.0 | 1500 | $1,795 | $1.20 | 25d | 1 | 0.96mi |
| 1019 N Bowdish Rd Spokane Valley, WA | 2.0 | 2.0 | 1330 | $1,795 | $1.35 | 45d | 1 | 0.97mi |
| 12625 E Main Ave Unit 8 Spokane Valley, WA | 2.0 | 2.5 | 1370 | $1,899 | $1.39 | 45d | 1 | 1.01mi |
| 218 Woodlawn Ln Unit 1 Spokane Valley, WA | 3.0 | 2.5 | 1457 | $1,895 | $1.30 | 25d | 1 | 1.04mi |
| 210 S Farr Rd Spokane Valley, WA | 1.0–2.0 | 1.0 | 797 | $1,440 | $1.81 | 15d | 8 | 1.04mi |
| 319 S Woodlawn Ln Spokane, WA | 3.0 | 2.5 | 1490 | $1,895 | $1.27 | 22d | 1 | 1.05mi |
| 12402 E Broadway Ave #2 Spokane Valley, WA | 3.0 | 3.0 | 1480 | $2,170 | $1.47 | 22d | 1 | 1.09mi |
| 1318 S Robinhood St Unit 1 Spokane Valley, WA | 2.0 | 1.0 | 948 | $1,450 | $1.53 | 15d | 1 | 1.12mi |
| 12623 E Broadway Ave Spokane Valley, WA | 1.0–3.0 | 1.0–2.0 | 952 | $1,750 | $1.84 | 15d | 9 | 1.24mi |
| 2407 S University Rd Spokane Valley, WA | 3.0 | 1.0 | 1000 | $1,495 | $1.50 | 45d | 1 | 1.30mi |
| 12202 E Maxwell Ave Spokane Valley, WA | 2.0 | 2.0 | 1010 | $1,444 | $1.43 | 15d | 3 | 1.31mi |
| 1723 N Union Rd Spokane Valley, WA | 1.0–2.0 | 1.0–2.0 | 818 | $1,505 | $1.84 | 15d | 5 | 1.42mi |
HOA detail
- Monthly dues
- $148 · $1,776/yr
- Likely covers
- gassnow removal
Listing history 25 events
-
2026-06-21days on market $230,000 Active 17 DOM
-
2026-06-18days on market $230,000 Active 14 DOM
-
2026-06-17days on market $230,000 Active 13 DOM
-
2026-06-16days on market $230,000 Active 12 DOM
-
2026-06-15days on market $230,000 Active 11 DOM
-
2026-06-14days on market $230,000 Active 9 DOM
-
2026-06-10days on market $230,000 Active 6 DOM
-
2026-06-09days on market $230,000 Active 5 DOM
-
2026-06-08days on market $230,000 Active 4 DOM
-
2026-06-07days on market $230,000 Active 3 DOM
-
2026-06-05days on market $230,000 Active 1 DOM
-
2026-06-03days on market $230,000 Active 182 DOM
-
2026-06-02days on market $230,000 Active 181 DOM
-
2026-06-01days on market $230,000 Active 180 DOM
-
2026-05-31days on market $230,000 Active 179 DOM
-
2026-05-31days on market $230,000 Active 178 DOM
-
2026-05-03price $230,000 523-char remark
-
2026-01-14price $249,000 523-char remark
-
2025-12-03$259,000 Active 523-char remark
-
2006-06-09historical
-
2006-05-30historical
-
2006-04-19$436,000
-
2006-03-13$445,440
-
2006-03-13historical
-
2005-11-09$436,000
ⓘ Source: listings_history table (triggers on properties + properties_extension) + one-shot
backfill from property_details.listing_events for pre-trigger history.
Climate risk First Street
- Flood 1/10 Low FEMA zone X (unshaded) · 0% chance over 30 yrs
- Wildfire 2/10 Low
- Heat 3/10 Moderate 7 d/yr ≥94°F today · 15 d/yr by 30 yrs out
- Wind 1/10 Low
- Air quality 9/10 Extreme 17 unhealthy d/yr today · 17 by 30 yrs out
Nearby sold comps map
Loading sold comps map…
Walkable amenities ~0.75 mi
Loading nearby amenities…
Taxation est. · year 1
- Rental income
- $20,064
- − Mortgage interest
- −$12,884
- − Property taxes
- −$3,450
- − Insurance
- −$1,150
- − Repairs & maintenance
- −$1,605
- − Management
- −$1,605
- − HOA
- −$1,776
- − Depreciation
- −$6,691
- Taxable loss
- −$9,097
- Est. tax savings @ 24.0%
- +$2,183
- After-tax cash flow
- $-2,816/yr
For passive investors: Depreciation is non-cash, so a rental often shows a tax loss while cash-flowing — sheltering income. Rental losses are passive: they offset passive income freely, and up to $25,000/yr can offset ordinary (W-2) income if you actively participate and your MAGI is under $100k (phasing out to $0 by $150k); unused losses carry forward. On sale, claimed depreciation is recaptured at up to 25%, and gains may owe capital-gains tax (a 1031 exchange can defer both). Figures are a year-1 estimate at your 24.0% rate — not tax advice; consult a CPA.
Condition & rehab AI · 13 photos
This well-maintained townhome in Spokane Valley offers a good condition with a good rehab level, ready for a fresh coat of paint and some minor updates to boost its value.
Value-add opportunities
- Both paint exterior — enhances curb appeal and resale value
- Resale update flooring in bathrooms — improves aesthetics and resale value
- Both install new window treatments — enhances curb appeal and rental value
Renovation cost estimate screening
Value-add ROI direction
- Both paint exterior — enhances curb appeal and resale value ↑
- Resale update flooring in bathrooms — improves aesthetics and resale value ↑
- Both install new window treatments — enhances curb appeal and rental value ↑
ⓘ Cost ranges are severity-bucket heuristics (US national rule-of-thumb). Get contractor quotes + a written scope before underwriting a rehab budget.
Schools (NCES district)
- District
- Central Valley School District
- NCES district ID
- 5301110
- Math proficiency
- 55% ▬ 0.00%
- Reading proficiency
- 66% ▬ 0.00%
- Median HH income
- $55,824
- Composite
- 53.62/100
- National rank
- #3107
- State rank
- #55 of 291 in WA
Livability — Spokane Valley
- Score
- 85/100
- State rank
- #31
- US rank
- #512
Category grades
Schools grade is shown separately in the Schools card above.
Census & demographics
- Census place
- Spokane Valley, WA
- County
- Spokane County · 496,401 people
- City population
- 129,511
- Metro
- Spokane-Spokane Valley, WA
- Population (ZIP)
- 41,089
- Household income
- $81,764
- Rent vs Own
- Severe rent burden
- 1523.0
Population outlook (Spokane County) Hauer SSP2
- Today (2025)
- 531,314 people
- By 2030
- 549,278 · +3.4%
- By 2040
- 577,822 · +8.8%
- By 2050
- 598,188 · +12.6%
- By 2075
- 630,744 · +18.7%
- By 2100
- 622,360 · +17.1%
Race, ethnicity, and origin ACS 2023
- Neighborhood character
- Predominantly White (82%)
- Race & ethnicity
- White 82% Two or more races 8% Hispanic / Latino 7% Black 2% Asian 2%
- Hispanic origin (detail)
- Mexican 4%
- Common ancestry
- Portuguese 5% Slovak 3% Lithuanian 3%
- Foreign-born
- 5% · Canada, Vietnam
- Languages at home
- 93% English-only · Spanish 3% Russian/Polish/Slavic 1% Other Asian/Pacific 1%
Political lean MEDSL · Spokane
- 2024 margin
- Toss-up / Even · D 46.0% · R 51.0% · Other 3.0%
- 2008→2024 swing
- -3.8pp toward R · 2008: -1.1pp · 2024: -5.0pp
- All cycles
- 2024: R+5.0 2020: R+4.3 2016: R+8.3 2012: R+6.3 2008: R+1.1
Not yet ingested
- Civics
- —
Market trends
- HPI YoY
- ▼ -377.59%
- Current HPI
- 339.9959
- Rent YoY
- ▲ 2.44%
- Metro
- Spokane-Spokane Valley, WA
- State GDP YoY
- ▲ 4.65%
- F500 in state
- 22
Industry mix (Fortune 500 HQ in WA)
| Industry | F500 HQs | Revenue |
|---|---|---|
| Retail | 2 | $269B |
|
||
| Technology / Retail | 1 | $638B |
|
||
| Technology | 1 | $245B |
|
||
| Telecommunications | 1 | $38B |
|
||
| Food / Beverage | 1 | $36B |
|
||
| Automotive / Trucks | 1 | $34B |
|
||
Price history
-47.2% since first listed11 events — show timeline
- 2026-06-04 Listing Removed — SPOKANEMLS as Distributed by MLS Grid
- 2026-06-04 Listed $230,000 SPOKANEMLS as Distributed by MLS Grid
- 2026-05-03 Price Changed $230,000 SPOKANEMLS as Distributed by MLS Grid
- 2026-01-14 Price Changed $249,000 SPOKANEMLS as Distributed by MLS Grid
- 2025-12-03 Listed $259,000 SPOKANEMLS as Distributed by MLS Grid
- 2006-06-09 Listing Removed — SPOKANEMLS as Distributed by MLS Grid
- 2006-05-30 Listing Removed — SPOKANEMLS as Distributed by MLS Grid
- 2006-04-19 Listed $436,000 SPOKANEMLS as Distributed by MLS Grid
- 2006-03-13 Listing Removed — SPOKANEMLS as Distributed by MLS Grid
- 2006-03-13 Listed $445,440 SPOKANEMLS as Distributed by MLS Grid
- 2005-11-09 Listed $436,000 SPOKANEMLS as Distributed by MLS Grid
Cash-flow waterfall
monthlySold comps — $/sqft
last 12 mo · ≤1 miLoading sold comps…