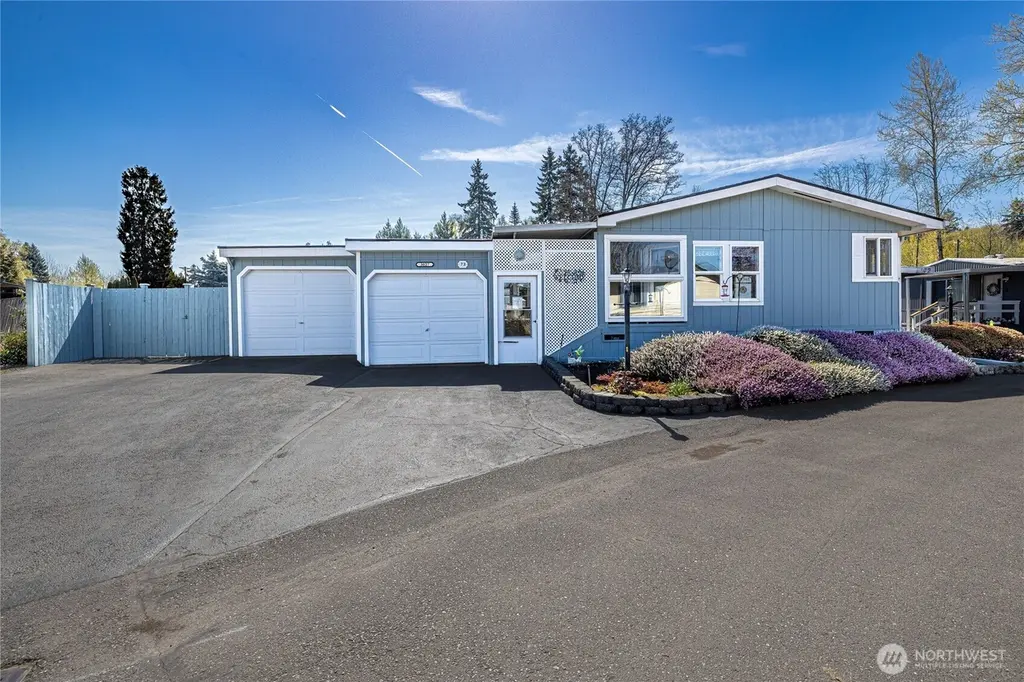
3027 35th Ave. Ct. East #73 · Waller, WA
Flood risk 8/10 · Major
- FEMA flood zone
- AE
- Chance of flooding over 30 yrs
- 0.78%
- Est. flood insurance / yr
- $1,737 – $8,500
Fire risk 3/10 · Minor
- Est. fire insurance / yr
- $604 – $1,122
Heat risk 3/10 · Minor
- Hot days now (above 88°F)
- 7 days/yr
- Hot days in 30 yrs
- 16 days/yr
Wind risk 1/10 · Minimal
- Chance of severe wind over 30 yrs
- —
Air-quality risk 7/10 · Major
- Unhealthy air days now
- 10 days/yr
- Unhealthy air days in 30 yrs
- 12 days/yr
Risk factors via First Street. Map © Google.
Why this score? — see what drove the B- grade
The composite is a weighted blend of 9 inputs, each scored 0–100. Each bar is that input's sub-score; the figure is the points it added to the 100-point composite (weight × sub-score).
- Cash flow +29.8/30.0
- DSCR +10.0/10.0
- 1% rule +7.7/10.0
- ARV discount +7.5/15.0
- Schools +5.4/10.0
- Livability +3.5/5.0
- Rent growth +2.5/5.0
- Condition / age +2.5/5.0
- Appreciation +0.0/10.0
$199,000
🖨 Deal sheet (PDF) 📄 Offer letter ✓ Due diligence
Listing remarks
This beautifully maintained 'FHA Good Sense Home" is located in the highly desirable Tacoma Country Estates; sitting on a private lot with no one behind you, or to the east or west. This amazing 55+ community is minutes from the Freeway and all that downtown Tacoma and Puyallup have to offer. Do you RV? Country Estates has RV parking on premises for easy living. Large primary suite with 5pc bath and soaking tub. Open floor plan with soaring ceilings; great for gatherings and everyday living. The AC/Heat pump is soothing for hot summer days, and the pellet stove for those cold winter nights. * NEW * Luxury Vinyl plank flooring throughout living areas. Newer Paint and * ROOF * create
Key facts
- Private lot
- Rv parking
- Shop area
Tags
Neighborhood map
What this means for you Summary
Snapshot
- This is a 3-bed/2.0-bath manufactured listed at $199k.
Deal economics
- At list price, monthly cash flow is $305 ($4k/yr) — positive.
- The deal already cash-flows at list — no discount required.
- Meets the 1% rule at list price ($3k rent vs $199k).
- Recommended offer: $187k (6.0% below list) — sets the bar for market timing.
- Cap rate 10.7% vs local median 2.1% in Waller — top-decile yield for the area; either an underpriced asset or a hidden risk that comps aren't pricing in. Stress-test before assuming the spread holds.
Location & tenants
- Location reads 69/100 on livability (#254 in WA) — a middle-class / working-renter tenant base. Strengths: employment A+, housing A+, crime B; Watch: health & safety C-, commute D+, schools D-.
- Puyallup School District (suburban): math 53% / reading 66% proficiency, ranked #52 of 291 in WA (top 18%) — acceptable for families but not a draw, mixed tenant base, ~2y average lease.
- Market conditions: 27 active listings in the ZIP; 5 comparable units currently listed for rent nearby; rentals at typical pace (median 25d on market — plan ~3-4 weeks tenant-placement turnaround); 3,209 units permitted in Pierce County in 2024 (1,269 in 5+ unit buildings).
Forward outlook
- Local home prices are declining (-3.0%/yr); year-one equity from $1k of loan paydown is wiped out by about $6k of value loss. Plan a longer hold.
- Pierce County population projected at +26% by 2050 — long-run rental-demand tailwind backs the buy-and-hold thesis.
Negotiation context
- It's been on market 67 days — a 6% lower offer ($187k) is reasonable based on typical stale-listing flexibility.
Risks & watch-outs
- Watch-outs: flood insurance adds $427/mo.
- Climate carrying-cost: in FEMA flood zone AE (mandatory federal flood insurance) — expect insurance premiums to compound above CPI over the hold.
Questions for the listing agent
- It's been on market 67 days. Have you received any prior offers? Is the seller open to a 6% concession, seller financing, or rate buy-down credit?
- What's the actual annual flood-insurance premium (NFIP or private), and is the property in a SFHA with mandatory coverage?
- Why hasn't it sold? Are there any deal-killer items the seller is aware of (foundation, flood, title, zoning, code violations)?
- Is there a deadline driving the sale (1031 exchange, divorce, estate, relocation)? That informs how much negotiation room exists.
- Schools are D-rated, which usually means shorter tenancies and higher turnover. Who's the typical renter profile here, and what's been the actual vacancy rate?
- What's the average days-on-market for RENTAL listings here right now (not sales)? A rising rental-DOM trend means longer vacancies and softer asking-rent achievability than the comps imply.
- What's the recent tenant-quality profile in this submarket — average credit score on applications, eviction rate, late-payment / NSF rate, and stable-employment percentage? A property-management company in the area should have these aggregated.
- How much new for-sale + rental construction is in the pipeline within 1–3 miles? Heavy new supply typically softens prices + rents 12–24 months out; constrained supply supports both.
Investment metrics
- 1% rule
- 1.27% ✓
- Cap rate
- 10.70%
- Cash-on-cash
- 15.75%
- DSCR
- 1.70
- GRM
- 6.6
CMA / ARV
- ARV (median comp)
- $89,950
- List price
- $199,000
- Delta
- 121.23%
- Verdict
- OVERPRICED
- Comps
- 1 within 2.0 mi
Show comp detail 4 sales within ~0.75 mi
| Address | Dist | Beds/Ba | Sqft | Sold | Price | $/sf | Match |
|---|---|---|---|---|---|---|---|
| 3102 35th Avenue Ct E | 0.02mi | 3/2.0 | 1,502 (+1%) | 19mo | $50,000 | $33 | 81 |
| 2912 36th Ave E #4 | 0.13mi | 2/2.0 (-1) | 1,440 (-3%) | 23mo | $140,000 | $97 | 65 |
| 3021 28th ST Ct E #7 | 0.36mi | 3/2.0 | 1,404 (-5%) | 20mo | $133,500 | $95 | 58 |
| 3821 Waller Rd E | 0.47mi | 2/2.0 (-1) | 1,470 (-1%) | 20mo | $350,000 | $238 | 55 |
Match score weights: distance 35% · size 25% · config 20% · recency 20%. Top-matched comps best support the ARV.
Projected returns pro-forma
-3.0% appreciation · 3.0% rent growth · sell at horizon
- IRR
- -6.1%
- Equity multiple
- 0.77×
- Total profit
- $-12,593
- Equity at exit
- $29,672
- IRR
- 3.7%
- Equity multiple
- 1.27×
- Total profit
- $14,989
- Equity at exit
- $17,206
Cash invested: $55,720 (down + closing). Projections, not guarantees.
Landlord ↔ Tenant lean methodology
- Overall (STATE)
- 28 Tenant-Leaning
- State Washington
- 28 Tenant-Leaning · D+8
- County
- — inherits STATE
- City
- — inherits STATE
ZIP-level market 98443
- Active inventory
- 27
- Price-to-rent
- 6.6×
Monthly cashflow live
- Estimated rent
- $2,529 high interval (Pro) →
- Mortgage (P&I)
- −$1,044
- Tax from tax record
- −$140 /mo · $1,676/yr
- Insurance
- −$83
- Flood insurance flood zone
- −$427 /mo · $5,118/yr
- HOA
- −$0
- Vacancy / Maint / Mgmt
- −$531
- Net cashflow
- $305
Break-even live
Sensitivity live
| Price | -10% $418 | -5% $361 | +0% $305 | +5% $249 | +10% $192 |
|---|---|---|---|---|---|
| Rent | -10% $105 | -5% $205 | +0% $305 | +5% $405 | +10% $505 |
| Rate | -1.0pp $405 | -0.5pp $356 | base $305 | +0.5pp $253 | +1.0pp $201 |
UW: 25.0% down · 7.5% · 30yr · 1.5% tax · 5.0% vac · 8.0% maint · 8.0% mgmt
Financing live
Cash to close
- Down payment
- $49,750
- Closing costs
- $5,970
- Reserves months
- —
- Total cash needed
- —
Loan-product check · same deal, 3 products live
Conventional
25% down · 7.5% · 30yr
- Down + closing
- —
- Monthly P&I
- —
- Monthly cashflow
- —
- DSCR
- —
- Eligible?
- —
Personal DTI + credit; lowest rate.
DSCR
20% down · 8.5% · 30yr
- Down + closing
- —
- Monthly P&I
- —
- Monthly cashflow
- —
- DSCR
- —
- Eligible?
- —
No personal income docs; deal must DSCR.
Hard money
10% down · 12.0% · 12mo
- Down + closing
- —
- Monthly P&I
- —
- Monthly cashflow
- —
- DSCR
- —
- Eligible?
- —
Short-term bridge; refi at stabilization.
Rent comps 5 comps
| Address | Beds | Baths | Sqft | Rent | $/sqft | DOM | Units | Dist |
|---|---|---|---|---|---|---|---|---|
| 2036 E Morton St Tacoma, WA | 3.0 | 1.0 | 889 | $3,300 | $3.71 | 2d | 1 | 0.87mi |
| 4600 16th St E Fife, WA | 1.0–3.0 | 1.0–2.0 | 925 | $2,300 | $2.49 | 24d | 1 | 1.08mi |
| 4919 Waller Rd E Unit 4919 Tacoma, WA | 2.0 | 1.0 | 1200 | $2,300 | $1.92 | 24d | 1 | 1.20mi |
| 1207 46th Ave E Unit 1207 Fife, WA | 3.0 | 1.5 | 1200 | $1,995 | $1.66 | 24d | 1 | 1.36mi |
| 1405 E 38th St Tacoma, WA | 3.0 | 2.5 | 1265 | $2,650 | $2.09 | 2d | 1 | 1.40mi |
Listing history 16 events
-
2026-06-18days on market $199,000 Active 67 DOM
-
2026-06-17days on market $199,000 Active 66 DOM
-
2026-06-16days on market $199,000 Active 65 DOM
-
2026-06-15days on market $199,000 Active 64 DOM
-
2026-06-13days on market $199,000 Active 62 DOM
-
2026-06-13days on market $199,000 Active 61 DOM
-
2026-06-09days on market $199,000 Active 58 DOM
-
2026-06-08days on market $199,000 Active 57 DOM
-
2026-06-07days on market $199,000 Active 56 DOM
-
2026-06-04days on market $199,000 Active 53 DOM
-
2026-06-03days on market $199,000 Active 52 DOM
-
2026-06-02days on market $199,000 Active 51 DOM
-
2026-06-01days on market $199,000 Active 50 DOM
-
2026-05-31days on market $199,000 Active 49 DOM
-
2026-04-24price $199,000
-
2026-04-12$210,000 Active
ⓘ Source: listings_history table (triggers on properties + properties_extension) + one-shot
backfill from property_details.listing_events for pre-trigger history.
Tax reassessment forecast WA · Resets to sale price
- Current annual tax
- $1,676 · $140/mo
- Projected year-2 tax
- $1,950 · $163/mo
- Expected delta
- +$274/yr (+$23/mo · 16.4%)
ⓘ Screening estimate from a state-policy table — verify with the county assessor before closing.
Climate risk First Street
- Flood 8/10 Severe FEMA zone AE · 78% chance over 30 yrs
- Wildfire 3/10 Moderate
- Heat 3/10 Moderate 7 d/yr ≥88°F today · 16 d/yr by 30 yrs out
- Wind 1/10 Low
- Air quality 7/10 Severe 10 unhealthy d/yr today · 12 by 30 yrs out
Nearby sold comps map
Loading sold comps map…
Walkable amenities ~0.75 mi
Loading nearby amenities…
Taxation est. · year 1
- Rental income
- $30,343
- − Mortgage interest
- −$11,147
- − Property taxes
- −$1,676
- − Insurance
- −$6,114
- − Repairs & maintenance
- −$2,427
- − Management
- −$2,427
- − Depreciation
- −$5,789
- Taxable income
- $763
- Est. tax owed @ 24.0%
- −$183
- After-tax cash flow
- $3,476/yr
For passive investors: Depreciation is non-cash, so a rental often shows a tax loss while cash-flowing — sheltering income. Rental losses are passive: they offset passive income freely, and up to $25,000/yr can offset ordinary (W-2) income if you actively participate and your MAGI is under $100k (phasing out to $0 by $150k); unused losses carry forward. On sale, claimed depreciation is recaptured at up to 25%, and gains may owe capital-gains tax (a 1031 exchange can defer both). Figures are a year-1 estimate at your 24.0% rate — not tax advice; consult a CPA.
Schools (NCES district)
- District
- Puyallup School District
- NCES district ID
- 5306960
- Math proficiency
- 53% ▬ 0.00%
- Reading proficiency
- 66% ▬ 0.00%
- Median HH income
- $68,291
- Composite
- 54.01/100
- National rank
- #3006
- State rank
- #52 of 291 in WA
Livability — Waller
- Score
- 69/100
- State rank
- #254
- US rank
- #8174
Category grades
Schools grade is shown separately in the Schools card above.
Census & demographics
- Census place
- Waller, WA
- City population
- 5,787
- Population (ZIP)
- 5,787
Population outlook (Pierce County) Hauer SSP2
- Today (2025)
- 956,648 people
- By 2030
- 1,010,862 · +5.7%
- By 2040
- 1,113,170 · +16.4%
- By 2050
- 1,206,524 · +26.1%
- By 2075
- 1,436,425 · +50.2%
- By 2100
- 1,563,654 · +63.5%
Race, ethnicity, and origin ACS 2023
- Neighborhood character
- Predominantly White (71%)
- Race & ethnicity
- White 71% Two or more races 11% Hispanic / Latino 10% Asian 6% Black 2%
- Hispanic origin (detail)
- Mexican 8%
- Common ancestry
- Portuguese 5% Italian 4% Romanian 3%
- Foreign-born
- 7% · Canada, Vietnam, South Korea
- Languages at home
- 89% English-only · Spanish 5% Other Asian/Pacific 2% German/W. Germanic 1%
Political lean MEDSL · Pierce
- 2024 margin
- D (+10.8) · D 53.9% · R 43.1% · Other 3.0%
- 2008→2024 swing
- -1.4pp toward R · 2008: 12.2pp · 2024: 10.8pp
- All cycles
- 2024: D+10.8 2020: D+11.2 2016: D+7.5 2012: D+11.0 2008: D+12.2
Not yet ingested
- Civics
- —
Market trends
- HPI YoY
- ▼ -375.05%
- Current HPI
- 299.5307
- Rent YoY
- —
- Metro
- —
- State GDP YoY
- ▲ 4.65%
- F500 in state
- 22
Industry mix (Fortune 500 HQ in WA)
| Industry | F500 HQs | Revenue |
|---|---|---|
| Retail | 2 | $269B |
|
||
| Technology / Retail | 1 | $638B |
|
||
| Technology | 1 | $245B |
|
||
| Telecommunications | 1 | $38B |
|
||
| Food / Beverage | 1 | $36B |
|
||
| Automotive / Trucks | 1 | $34B |
|
||
Price history
-5.2% since first listed2 events — show timeline
- 2026-04-24 Price Changed $199,000 NWMLS as Distributed by MLS Grid
- 2026-04-12 Listed $210,000 NWMLS as Distributed by MLS Grid
Property tax history
+5.6%/yrLatest (2026): $1,676 · +6.4% YoY. Source: county tax records.
Cash-flow waterfall
monthlySold comps — $/sqft
last 12 mo · ≤1 miLoading sold comps…