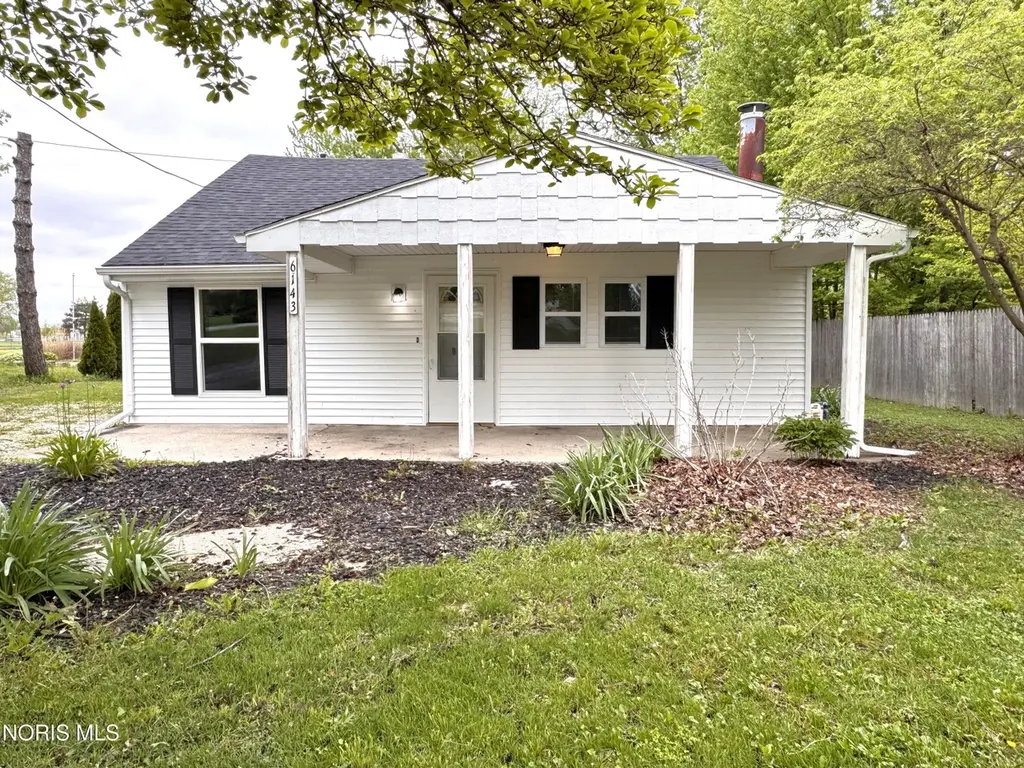
6143 Seaman Rd · Oregon, OH
Flood risk 1/10 · Minimal
- FEMA flood zone
- X (unshaded)
- Chance of flooding over 30 yrs
- 0.0%
- Est. flood insurance / yr
- $507 – $1,088
Fire risk 1/10 · Minimal
- Est. fire insurance / yr
- $713 – $1,323
Heat risk 3/10 · Minor
- Hot days now (above 99°F)
- 7 days/yr
- Hot days in 30 yrs
- 16 days/yr
Wind risk 2/10 · Minimal
- Chance of severe wind over 30 yrs
- —
Air-quality risk 2/10 · Minimal
- Unhealthy air days now
- 1 days/yr
- Unhealthy air days in 30 yrs
- 2 days/yr
Risk factors via First Street. Map © Google.
Why this score? — see what drove the D grade
The composite is a weighted blend of 9 inputs, each scored 0–100. Each bar is that input's sub-score; the figure is the points it added to the 100-point composite (weight × sub-score).
- ARV discount +15.0/15.0
- Cash flow +8.7/30.0
- Schools +4.6/10.0
- Livability +3.8/5.0
- 1% rule +2.5/10.0
- Rent growth +2.5/5.0
- Condition / age +2.5/5.0
- DSCR +2.4/10.0
- Appreciation +0.0/10.0
$184,900
🖨 Deal sheet (PDF) 📄 Offer letter ✓ Due diligence
Listing remarks
Recently remodeled 3 bedroom, 2 full bath Oregon ranch on just under 1 acre. Large living room is enhanced by the dramatic vaulted ceilings. Updated kitchen and baths. Large kitchen features excellent granite counter space and new cabinets. The vinyl exterior is in great condition. Enjoy the summer nights on your covered front porch or back deck. Sizable portion of the backyard if fenced and ready for your pets. Feature new vinyl flooring and windows. The roof was replaced in 2023. The deep lot backs up to farm field. This is a rare find in this real estate market. Schedule a viewing today before it is gone!
Key facts
- 0.94 acre lot
- Built 1945
- Listed 29 days
Property features AI
Exterior
- Parking: Asphalt driveway parking
- Security: Smoke detector(s)
- Utilities: Public water; Sanitary sewer; Electricity connected; Natural gas connected; Cable available
- Home design: Single-family residence (house); Attached: yes; One level / single-story; Accessible features included; Faces city street (asphalt road frontage)
- Construction: Vinyl siding; Block foundation with crawl space; Asphalt shingle roof
- Exterior features: Deck; Front porch; Covered porch; Chain link fence; Shed(s); Asphalt driveway
Interior
- Kitchen: Eat-in kitchen; Pantry
- Bedrooms: Three main-level bedrooms (one listed as Bedroom 3)
- Flooring: Plank flooring; Vinyl flooring
- Bathrooms: Two full bathrooms; Accessible full bath
- Heating & cooling: Forced air heating (natural gas); Central air conditioning
- Interior features: Built-in shower chair; Eat-in kitchen; Pantry; Ceiling fans; Vaulted ceilings; Double-pane, insulated windows with screens; Sliding doors
- Laundry & utility: Washer hookup on main level; Electric dryer hookup on main level
Neighborhood map
What this means for you Summary
Snapshot
- This is a 2-bed/2.0-bath single-family listed at $185k.
Deal economics
- At list price, monthly cash flow is $-156 ($-2k/yr) — negative.
- To cash-flow at today's rent, offer at most $157k (14.9% below list).
- To meet the 1% rule (rent ≥ 1% of price), the offer needs to be $138k (25.4% below list).
- Recommended offer: $138k (25.4% below list) — sets the bar for 1% rule.
- Cap rate 5.3% vs local median 3.3% in Oregon — top-decile yield for the area; either an underpriced asset or a hidden risk that comps aren't pricing in. Stress-test before assuming the spread holds.
Location & tenants
- Location reads 76/100 on livability (#210 in OH, #3,303 nationally) — a middle-class / working-renter tenant base. Strengths: cost of living A+, housing A+, health & safety A+; Watch: crime D, amenities F, commute F.
- Oregon City (rural): math 48% / reading 59% proficiency, ranked #384 of 656 in OH (top 58%) — acceptable for families but not a draw, mixed tenant base, ~2y average lease.
- Zoned schools: Jerusalem Elementary School (math 77% / reading 67%, grade A-, #323 of 1,584 statewide, top 23%, 396 students, 34% FRL); Fassett Junior High School (math 42% / reading 54%, grade C-, #441 of 654 statewide, top 68%, 519 students, 40% FRL); Clay High School (math 27% / reading 69%, grade D, #429 of 781 statewide, top 55%, 1,139 students, 39% FRL) — zoned schools at 38% FRL track the district average.
- Market conditions: 80 active listings in the ZIP; solid renter incomes; 415 units permitted in Lucas County in 2024 (122 in 5+ unit buildings).
Forward outlook
- Local home prices are declining (-3.0%/yr); year-one equity from $1k of loan paydown is wiped out by about $6k of value loss. Plan a longer hold.
- Lucas County population projected at -16% by 2050 — secular population decline; favor cash flow + early exit over multi-decade hold.
Negotiation context
- It's been on market 29 days — a 2% lower offer ($182k) is reasonable based on typical stale-listing flexibility.
- 4 sale attempts since 2y ago with the ask held roughly flat each time — persistent listings suggest the price (not the market) is what's stuck; bring a comps-based counter.
Risks & watch-outs
- Watch-outs: built in 1945 — expect roof / HVAC / electrical / plumbing capex.
Questions for the listing agent
- What do current leases actually rent for vs. the listed asking? Can we see a recent rent roll and the last 12 months of T-12 income?
- Built in 1945 — when were the roof, HVAC, electrical panel, plumbing, and water heater last replaced?
- Is there a deadline driving the sale (1031 exchange, divorce, estate, relocation)? That informs how much negotiation room exists.
- Schools are B-rated — typically a magnet for longer-tenancy family renters. What's the average tenant stay here, and is there a school-zone premium baked into asking?
- Crime grade is D in this area — have there been break-ins, vandalism, or insurance claims at this property in the last 3 years? What carrier currently insures it and at what premium?
- The area grade is low — what's the realistic commute time and amenity access for the typical tenant pool here? Any planned neighborhood developments (good or bad) we should know about?
- What's the average days-on-market for RENTAL listings here right now (not sales)? A rising rental-DOM trend means longer vacancies and softer asking-rent achievability than the comps imply.
- What's the recent tenant-quality profile in this submarket — average credit score on applications, eviction rate, late-payment / NSF rate, and stable-employment percentage? A property-management company in the area should have these aggregated.
- How much new for-sale + rental construction is in the pipeline within 1–3 miles? Heavy new supply typically softens prices + rents 12–24 months out; constrained supply supports both.
Investment metrics
- 1% rule
- 0.75% ✗
- Cap rate
- 5.28%
- Cash-on-cash
- -3.62%
- DSCR
- 0.84
- GRM
- 11.2
CMA / ARV
- ARV (median comp)
- $256,581
- List price
- $184,900
- Delta
- -27.94%
- Verdict
- UNDERPRICED
- Comps
- 20 within 1.0 mi
Show comp detail 4 sales within ~0.75 mi
| Address | Dist | Beds/Ba | Sqft | Sold | Price | $/sf | Match |
|---|---|---|---|---|---|---|---|
| 6143 Seaman Rd | 0.00mi | 3/2.0 (+1) | 1,426 (0%) | 1mo | $186,000 | $130 | 94 |
| 503 Sky Way Dr | 0.71mi | 3/2.5 (+1) | 1,502 (+5%) | 7mo | $330,000 | $220 | 45 |
| 46 S Stadium Rd | 0.46mi | 3/1.0 (+1) | 1,576 (+10%) | 12mo | $265,000 | $168 | 42 |
| 233 Enos Dr | 0.50mi | 3/2.0 (+1) | 1,264 (-11%) | 17mo | $255,000 | $202 | 39 |
Match score weights: distance 35% · size 25% · config 20% · recency 20%. Top-matched comps best support the ARV.
Projected returns pro-forma
-3.0% appreciation · 3.0% rent growth · sell at horizon
- IRR
- -22.4%
- Equity multiple
- 0.23×
- Total profit
- $-39,916
- Equity at exit
- $27,569
- IRR
- -16.5%
- Equity multiple
- 0.08×
- Total profit
- $-47,571
- Equity at exit
- $15,987
Cash invested: $51,772 (down + closing). Projections, not guarantees.
Landlord ↔ Tenant lean methodology
- Overall (STATE)
- 73 Landlord-Friendly
- State Ohio
- 73 Landlord-Friendly · R+6
- County
- — inherits STATE
- City
- — inherits STATE
ZIP-level market 43616
- Home prices YoY
- -20.9%
- Active inventory
- 80
- Price-to-rent
- 11.2×
Monthly cashflow live
- Estimated rent
- $1,380 medium interval (Pro) →
- Mortgage (P&I)
- −$970
- Tax from tax record
- −$200 /mo · $2,396/yr
- Insurance
- −$77
- HOA
- −$0
- Lot rent
- −$0
- Vacancy / Maint / Mgmt
- −$290
- Net cashflow
- $-156
Break-even live
Sensitivity live
| Price | -10% $-52 | -5% $-104 | +0% $-156 | +5% $-209 | +10% $-261 |
|---|---|---|---|---|---|
| Rent | -10% $-265 | -5% $-211 | +0% $-156 | +5% $-102 | +10% $-47 |
| Rate | -1.0pp $-63 | -0.5pp $-109 | base $-156 | +0.5pp $-204 | +1.0pp $-253 |
UW: 25.0% down · 7.5% · 30yr · 1.5% tax · 5.0% vac · 8.0% maint · 8.0% mgmt
Financing live
Cash to close
- Down payment
- $46,225
- Closing costs
- $5,547
- Reserves months
- —
- Total cash needed
- —
Loan-product check · same deal, 3 products live
Conventional
25% down · 7.5% · 30yr
- Down + closing
- —
- Monthly P&I
- —
- Monthly cashflow
- —
- DSCR
- —
- Eligible?
- —
Personal DTI + credit; lowest rate.
DSCR
20% down · 8.5% · 30yr
- Down + closing
- —
- Monthly P&I
- —
- Monthly cashflow
- —
- DSCR
- —
- Eligible?
- —
No personal income docs; deal must DSCR.
Hard money
10% down · 12.0% · 12mo
- Down + closing
- —
- Monthly P&I
- —
- Monthly cashflow
- —
- DSCR
- —
- Eligible?
- —
Short-term bridge; refi at stabilization.
Listing history 10 events
-
2026-05-04historical Contingent 625-char remark
-
2026-04-29$184,900 Active 625-char remark
-
2024-05-13historical $1,650
-
2024-04-12$1,650
-
2024-03-14historical $1,700
-
2024-01-24$1,700
-
2024-01-24historical $1,700
-
2024-01-23$1,700
-
2022-05-19soldstatus $80,000
-
2005-06-16soldstatus $100,000
ⓘ Source: listings_history table (triggers on properties + properties_extension) + one-shot
backfill from property_details.listing_events for pre-trigger history.
Tax reassessment forecast OH · Partial reset (capped growth)
- Current annual tax
- $2,396 · $200/mo
- Projected year-2 tax
- $2,640 · $220/mo
- Expected delta
- +$244/yr (+$20/mo · 10.2%)
ⓘ Screening estimate from a state-policy table — verify with the county assessor before closing.
Climate risk First Street
- Flood 1/10 Low FEMA zone X (unshaded) · 0% chance over 30 yrs
- Wildfire 1/10 Low
- Heat 3/10 Moderate 7 d/yr ≥99°F today · 16 d/yr by 30 yrs out
- Wind 2/10 Low
- Air quality 2/10 Low 1 unhealthy d/yr today · 2 by 30 yrs out
Nearby sold comps map
Loading sold comps map…
Walkable amenities ~0.75 mi
Loading nearby amenities…
Taxation est. · year 1
- Rental income
- $16,557
- − Mortgage interest
- −$10,357
- − Property taxes
- −$2,396
- − Insurance
- −$924
- − Repairs & maintenance
- −$1,325
- − Management
- −$1,325
- − Depreciation
- −$5,379
- Taxable loss
- −$5,148
- Est. tax savings @ 24.0%
- +$1,236
- After-tax cash flow
- $-640/yr
For passive investors: Depreciation is non-cash, so a rental often shows a tax loss while cash-flowing — sheltering income. Rental losses are passive: they offset passive income freely, and up to $25,000/yr can offset ordinary (W-2) income if you actively participate and your MAGI is under $100k (phasing out to $0 by $150k); unused losses carry forward. On sale, claimed depreciation is recaptured at up to 25%, and gains may owe capital-gains tax (a 1031 exchange can defer both). Figures are a year-1 estimate at your 24.0% rate — not tax advice; consult a CPA.
Schools (NCES district)
- District
- Oregon City
- NCES district ID
- 3904460
- Math proficiency
- 48% ▼ -20.00%
- Reading proficiency
- 59% ▼ -7.00%
- Median HH income
- $53,972
- Composite
- 46.03/100
- National rank
- #2524
- State rank
- #384 of 656 in OH
Livability — Oregon
- Score
- 76/100
- State rank
- #210
- US rank
- #3303
Category grades
Schools grade is shown separately in the Schools card above.
Census & demographics
- Census place
- Oregon, OH
- County
- Lucas County · 380,724 people
- City population
- 20,309
- Metro
- Toledo, OH
- Population (ZIP)
- 20,309
- Household income
- $81,829
- Rent vs Own
- Severe rent burden
- 395.0
Population outlook (Lucas County) Hauer SSP2
- Today (2025)
- 420,751 people
- By 2030
- 410,187 · -2.5%
- By 2040
- 384,019 · -8.7%
- By 2050
- 355,125 · -15.6%
- By 2075
- 291,683 · -30.7%
- By 2100
- 233,670 · -44.5%
Race, ethnicity, and origin ACS 2023
- Neighborhood character
- Predominantly White (86%)
- Race & ethnicity
- White 86% Hispanic / Latino 8% Two or more races 6% Asian 2% Black 1%
- Hispanic origin (detail)
- Mexican 7%
- Common ancestry
- Romanian 8% Lithuanian 6% Slovak 2%
- Foreign-born
- 3% · Canada, Vietnam, China
- Languages at home
- 95% English-only · Spanish 2% Vietnamese 1%
Political lean MEDSL · Lucas
- 2024 margin
- D (+12.6) · D 55.8% · R 43.2%
- 2008→2024 swing
- -18.9pp toward R · 2008: 31.4pp · 2024: 12.6pp
- All cycles
- 2024: D+12.6 2020: D+16.8 2016: D+17.4 2012: D+30.4 2008: D+31.4
Not yet ingested
- Civics
- —
Market trends
- HPI YoY
- ▼ -56.90%
- Current HPI
- 214.6328
- Rent YoY
- —
- Metro
- Toledo, OH
- State GDP YoY
- ▲ 1.98%
- F500 in state
- 48
Industry mix (Fortune 500 HQ in OH)
| Industry | F500 HQs | Revenue |
|---|---|---|
| Insurance | 3 | $145B |
|
||
| Industrial Machinery | 3 | $49B |
|
||
| Financial Services | 3 | $24B |
|
||
| Consumer Goods | 2 | $93B |
|
||
| Aerospace / Defense | 2 | $47B |
|
||
| Utilities | 2 | $33B |
|
||
Price history
+86.0% since first listed12 events — show timeline
- 2026-06-03 Sold (MLS) $186,000 NORIS
- 2026-05-28 Pending — NORIS
- 2026-05-04 Contingent — NORIS
- 2026-04-29 Listed $184,900 NORIS
- 2024-05-13 Rental Removed $1,650 TURBOTENANT
- 2024-04-12 Listed for Rent $1,650 TURBOTENANT
- 2024-03-14 Rental Removed $1,700 APPFOLIO
- 2024-01-24 Listed for Rent $1,700 APPFOLIO
- 2024-01-24 Rental Removed $1,700 TURBOTENANT
- 2024-01-23 Listed for Rent $1,700 TURBOTENANT
- 2022-05-19 Sold (Public Records) $80,000 Public Records
- 2005-06-16 Sold (Public Records) $100,000 Public Records
Property tax history
-0.4%/yrLatest (2025): $2,396 · +4.2% YoY. Source: county tax records.
Cash-flow waterfall
monthlySold comps — $/sqft
last 12 mo · ≤1 miLoading sold comps…