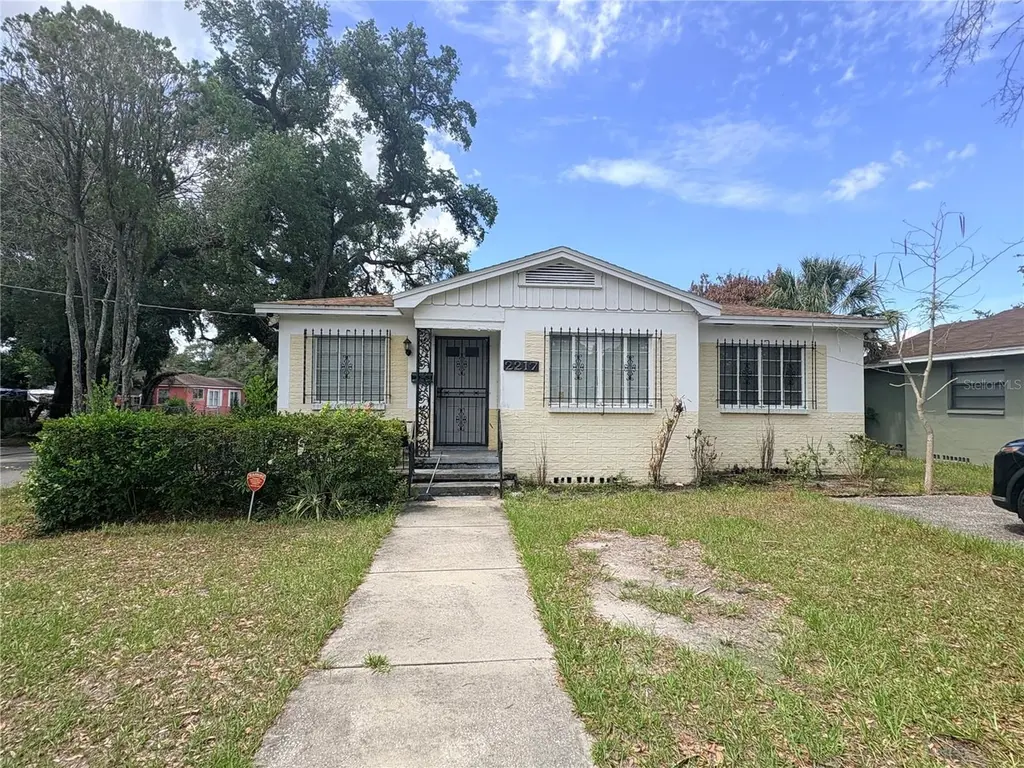
2217 Mallory Ave · Tampa, FL
Flood risk 1/10 · Minimal
- FEMA flood zone
- X (unshaded)
- Chance of flooding over 30 yrs
- 0.0%
- Est. flood insurance / yr
- $507 – $1,088
Fire risk 1/10 · Minimal
- Est. fire insurance / yr
- $947 – $1,759
Heat risk 10/10 · Severe
- Hot days now (above 107°F)
- 7 days/yr
- Hot days in 30 yrs
- 26 days/yr
Wind risk 9/10 · Severe
- Chance of severe wind over 30 yrs
- 99.0%
Air-quality risk 3/10 · Minor
- Unhealthy air days now
- 3 days/yr
- Unhealthy air days in 30 yrs
- 4 days/yr
Risk factors via First Street. Map © Google.
Why this score? — see what drove the C+ grade
The composite is a weighted blend of 9 inputs, each scored 0–100. Each bar is that input's sub-score; the figure is the points it added to the 100-point composite (weight × sub-score).
- Cash flow +20.9/30.0
- Appreciation +10.0/10.0
- ARV discount +7.5/15.0
- DSCR +6.6/10.0
- 1% rule +5.3/10.0
- Schools +4.2/10.0
- Livability +4.0/5.0
- Rent growth +2.6/5.0
- Condition / age +2.5/5.0
$199,900
🖨 Deal sheet 📄 Offer letter ✓ Due diligence
Listing remarks
Under contract-accepting backup offers. Exceptional opportunity to own a solid concrete block home on a premium corner lot, situated just minutes from Historic Ybor City! Boasting robust construction and great bones, this 3-bedroom, 1-bathroom property features a 1-car garage and serves as the perfect blank canvas for custom upgrades, modern renovations, or a personalized touch. Location is everything! Enjoy the ultimate urban lifestyle with seamless access to the very best of Tampa. Just a short drive away from Downtown Tampa, the vibrant Channelside District, historic Ybor City, and the highly anticipated Gas Worx development. Whether you are looking to build sweat equity in your primary
Key facts
- 5,225 sq ft lot
- Garage
- Built 1950
Property features AI
Finance
- Other: Zoning: RS-50
- HOA & community: No HOA / association indicated
Exterior
- Parking: Curb parking; Driveway; On-street parking; Attached garage (1 car)
- Utilities: Public water; Public sewer; Broadband / high-speed internet available
- Home design: Single family residence; One story; Faces south; Residential property
- Construction: Block and concrete construction; Shingle roof; Block foundation; Built on 1 story
- Exterior features: Front porch; Side porch; Corner lot; Within city limits; Paved road frontage
Interior
- Kitchen: Range; Refrigerator
- Bedrooms: 3 bedrooms
- Flooring: Ceramic tile; Laminate
- Bathrooms: 1 full bathroom
- Heating & cooling: Central heating; Central air conditioning
- Interior features: Ceiling fans; Living room / dining room combo; Bonus room
- Laundry & utility: No laundry in unit (none indicated)
Neighborhood map
What this means for you Summary
Snapshot
- This is a 2-bed/1.0-bath single-family listed at $200k.
Deal economics
- At list price, monthly cash flow is $277 ($3k/yr) — positive.
- The deal already cash-flows at list — no discount required.
- Meets the 1% rule at list price ($2k rent vs $200k).
Location & tenants
- Location reads 79/100 on livability (#142 in FL, #2,135 nationally) — a middle-class / working-renter tenant base. Strengths: commute A+, housing A+, health & safety A+; Watch: schools C-, crime D+.
- Hillsborough (suburban): math 47% / reading 50% proficiency, ranked #41 of 73 in FL (top 56%) — families likely to look elsewhere, expect single-tenant / working-renter base with shorter leases.
- Market conditions: Rents flat; 187 active listings in the ZIP; 40 comparable units currently listed for rent nearby; rentals at typical pace (median 15d on market — plan ~3-4 weeks tenant-placement turnaround); lower-income renter base — watch delinquency; 9,053 units permitted in Hillsborough County in 2024 (4,555 in 5+ unit buildings).
- At $2,055/mo this rent would consume 67% of the median local household income ($37k/yr) (locally 1374% of renters already pay >50% of income on rent) — very limited rent-growth headroom before tenants either downsize or default.
Forward outlook
- In year one you build about $21k of equity ($1k loan paydown + $20k appreciation (10.0% local appreciation)).
- Hillsborough County population projected at +37% by 2050 — long-run rental-demand tailwind backs the buy-and-hold thesis.
- At projected returns (10.0% appreciation + 0.6% rent growth), your $56k cash investment doubles in ~3 years — after that, you're playing with house money.
- By year 2, paydown + projected appreciation supports a ~$34k cash-out refi (75% LTV) — recoverable capital for the next deal without selling this one.
Negotiation context
- Only 1 days on market — expect competitive offers; lowballing is unlikely to land.
Risks & watch-outs
- Watch-outs: built in 1950 — expect roof / HVAC / electrical / plumbing capex.
- Climate carrying-cost: severe wind risk, 99% chance of damaging wind over 30y; extreme-heat days projected 7→26/yr by 2055 (HVAC capex compounding) — expect insurance premiums to compound above CPI over the hold.
Questions for the listing agent
- Built in 1950 — when were the roof, HVAC, electrical panel, plumbing, and water heater last replaced?
- Is there a deadline driving the sale (1031 exchange, divorce, estate, relocation)? That informs how much negotiation room exists.
- Crime grade is D in this area — have there been break-ins, vandalism, or insurance claims at this property in the last 3 years? What carrier currently insures it and at what premium?
- What's the average days-on-market for RENTAL listings here right now (not sales)? A rising rental-DOM trend means longer vacancies and softer asking-rent achievability than the comps imply.
- What's the recent tenant-quality profile in this submarket — average credit score on applications, eviction rate, late-payment / NSF rate, and stable-employment percentage? A property-management company in the area should have these aggregated.
- How much new for-sale + rental construction is in the pipeline within 1–3 miles? Heavy new supply typically softens prices + rents 12–24 months out; constrained supply supports both.
Investment metrics
- 1% rule
- 1.03% ✓
- Cap rate
- 7.96%
- Cash-on-cash
- 5.94%
- DSCR
- 1.26
- GRM
- 8.1
CMA / ARV
No comps found within radius.
Projected returns pro-forma
10.0% appreciation · 0.58% rent growth · sell at horizon
- IRR
- 27.7%
- Equity multiple
- 3.17×
- Total profit
- $121,637
- Equity at exit
- $180,086
- IRR
- 23.5%
- Equity multiple
- 6.99×
- Total profit
- $335,379
- Equity at exit
- $388,362
Cash invested: $55,972 (down + closing). Projections, not guarantees.
Landlord ↔ Tenant lean methodology
- Overall (STATE)
- 87 Strongly Landlord-Friendly
- State Florida
- 87 Strongly Landlord-Friendly · R+3
- County
- — inherits STATE
- City
- — inherits STATE
ZIP-level market 33605
- Home prices YoY
- 3.7%
- Rents YoY
- 0.6%
- Active inventory
- 187
- Price-to-rent
- 8.1×
Monthly cashflow live
- Estimated rent
- $2,055 high interval (Pro) →
- Mortgage (P&I)
- −$1,048
- Tax from tax record
- −$215 /mo · $2,580/yr
- Insurance
- −$83
- HOA
- −$0
- Vacancy / Maint / Mgmt
- −$432
- Net cashflow
- $277
Break-even live
UW: 25.0% down · 7.5% · 30yr · 1.5% tax · 5.0% vac · 8.0% maint · 8.0% mgmt
Financing live
Cash to close
- Down payment
- $49,975
- Closing costs
- $5,997
- Reserves months
- —
- Total cash needed
- —
Loan-product check · same deal, 3 products live
Conventional
25% down · 7.5% · 30yr
- Down + closing
- —
- Monthly P&I
- —
- Monthly cashflow
- —
- DSCR
- —
- Eligible?
- —
Personal DTI + credit; lowest rate.
DSCR
20% down · 8.5% · 30yr
- Down + closing
- —
- Monthly P&I
- —
- Monthly cashflow
- —
- DSCR
- —
- Eligible?
- —
No personal income docs; deal must DSCR.
Hard money
10% down · 12.0% · 12mo
- Down + closing
- —
- Monthly P&I
- —
- Monthly cashflow
- —
- DSCR
- —
- Eligible?
- —
Short-term bridge; refi at stabilization.
Rent comps 40 comps
| Address | Beds | Baths | Sqft | Rent | $/sqft | DOM | Units | Dist |
|---|---|---|---|---|---|---|---|---|
| 2214 E 18th Ave Tampa, FL | 3.0 | 2.0 | 1188 | $2,295 | $1.93 | 4d | 1 | 0.13mi |
| 2108 E 22nd Ave Tampa, FL | 3.0 | 3.0 | 1308 | $2,100 | $1.61 | 3d | 1 | 0.16mi |
| 2108 E 22nd Ave Tampa, FL | 3.0 | 3.0 | 1308 | $2,100 | $1.61 | 4d | 1 | 0.16mi |
| 2703 N 24th St Unit 1 Tampa, FL | 3.0 | 3.0 | 1164 | $2,295 | $1.97 | 13d | 1 | 0.21mi |
| 2104 E Columbus Dr Unit 301 Tampa, FL | 3.0 | 2.0 | 1083 | $2,050 | $1.89 | 24d | 1 | 0.25mi |
| 2104 E Columbus Dr Tampa, FL | 3.0 | 2.0 | 1231 | $1,995 | $1.62 | 24d | 1 | 0.25mi |
| 2308 E 15th Ave Tampa, FL | 3.0 | 1.0 | 936 | $1,895 | $2.02 | 14d | 1 | 0.27mi |
| 2006 E Columbus Dr Unit A Tampa, FL | 2.0 | 1.0 | 896 | $1,495 | $1.67 | 1d | 1 | 0.29mi |
| 1807 E 20th Ave Tampa, FL | 3.0 | 2.0 | 1131 | $2,900 | $2.56 | 24d | 1 | 0.34mi |
| 2708 N 19th St Tampa, FL | 3.0 | 2.0 | 1680 | $2,200 | $1.31 | 16d | 1 | 0.35mi |
| 2205 Chipco St Tampa, FL | 2.0 | 1.0 | 1100 | $1,600 | $1.45 | 24d | 1 | 0.37mi |
| 1808 E Columbus Dr #5 Tampa, FL | 2.0 | 2.5 | 1620 | $1,900 | $1.17 | 2d | 1 | 0.41mi |
| 2504 E 12th Ave Tampa, FL | 3.0 | 2.0 | 1422 | $2,500 | $1.76 | 4d | 1 | 0.42mi |
| 1716 E Columbus Dr Unit A Tampa, FL | 2.0 | 1.0 | 924 | $1,800 | $1.95 | 24d | 1 | 0.46mi |
| 3101 E 18th Ave Tampa, FL | 3.0 | 1.0 | 1050 | $1,750 | $1.67 | 3d | 1 | 0.46mi |
| 2312 E 10th Ave Tampa, FL | 3.0 | 1.0 | 1520 | $2,400 | $1.58 | 17d | 1 | 0.51mi |
| 2810 N 16th St Tampa, FL | 2.0 | 1.0 | 1066 | $2,550 | $2.39 | 12d | 1 | 0.55mi |
| 1520 E 21st Ave Tampa, FL | 3.0 | 2.0 | 1671 | $2,350 | $1.41 | 16d | 1 | 0.56mi |
| 2312 E 9th Ave Tampa, FL | 3.0 | 2.0 | 1008 | $2,200 | $2.18 | 24d | 1 | 0.56mi |
| 3021 Sanchez St Tampa, FL | 3.0 | 1.0 | 1300 | $2,195 | $1.69 | 24d | 1 | 0.57mi |
| 2610 E Lake Ave Tampa, FL | 3.0 | 2.0 | 1698 | $2,250 | $1.33 | 2d | 1 | 0.59mi |
| 2907 N 15th St Unit D Tampa, FL | 3.0 | 2.0 | 888 | $1,850 | $2.08 | 4d | 1 | 0.60mi |
| 2312 E 8th Ave Tampa, FL | 3.0 | 2.0 | 1420 | $2,500 | $1.76 | 11d | 1 | 0.61mi |
| 3107 Chipco St Tampa, FL | 3.0 | 1.0 | 1268 | $1,799 | $1.42 | 24d | 1 | 0.62mi |
| 1302 E 21st Ave Tampa, FL | 1.0–2.0 | 1.0–2.0 | 800 | $1,408 | $1.76 | 4d | 9 | 0.77mi |
| 2002 E 5th Ave Tampa, FL | 2.0 | 2.0 | 1064 | $1,795 | $1.69 | 4d | 1 | 0.79mi |
| 3716 N 31st St Tampa, FL | 3.0 | 2.0 | 1200 | $1,895 | $1.58 | 4d | 1 | 0.79mi |
| 1515 E 31st Ave Tampa, FL | 2.0 | 1.0 | 914 | $1,500 | $1.64 | 4d | 1 | 0.79mi |
| 1221 E Columbus Dr Tampa, FL | 2.0 | 1.0 | 1000 | $1,499 | $1.50 | 24d | 1 | 0.80mi |
| 2006 E 4th Ave Tampa, FL | 2.0 | 2.0 | 1140 | $2,000 | $1.75 | 14d | 1 | 0.83mi |
| 1212 E 25th Ave Tampa, FL | 2.0 | 1.0 | 1035 | $1,490 | $1.44 | 19d | 1 | 0.84mi |
| 3411 N 13th St Tampa, FL | 3.0 | 2.0 | 978 | $1,895 | $1.94 | 24d | 1 | 0.84mi |
| 3511 Bishop Eddie Newkirk Way Tampa, FL | 3.0 | 1.0 | 1056 | $1,800 | $1.70 | 10d | 1 | 0.84mi |
| 3511 Bishop Eddie Newkirk Way Tampa, FL | 3.0 | 1.0 | 1056 | $1,800 | $1.70 | 24d | 1 | 0.84mi |
| 3517 Bishop Eddie Newkirk Way Tampa, FL | 3.0 | 2.0 | 1200 | $2,500 | $2.08 | 24d | 1 | 0.87mi |
| 3601 N 13th St Tampa, FL | 3.0 | 2.5 | 1800 | $2,550 | $1.42 | 24d | 1 | 0.89mi |
| 1817 E 4th Ave Tampa, FL | 2.0 | 1.0 | 900 | $2,400 | $2.67 | 4d | 1 | 0.90mi |
| 3507 E 29th Ave Tampa, FL | 3.0 | 2.0 | 928 | $1,700 | $1.83 | 24d | 1 | 0.92mi |
| 1504 E 33rd Ave Tampa, FL | 3.0 | 2.0 | 1108 | $2,900 | $2.62 | 24d | 1 | 0.94mi |
| 2409 E 2nd Ave Tampa, FL | 2.0 | 1.0–2.0 | 882 | $3,549 | $4.02 | 2d | 23 | 0.95mi |
Listing history 2 events
-
2026-06-08remarks 699-char remark
-
2026-06-08$199,900 Pending 1 DOM
ⓘ Source: listings_history table (triggers on properties + properties_extension) + one-shot
backfill from property_details.listing_events for pre-trigger history.
Tax reassessment forecast FL · Resets to sale price
- Current annual tax
- $2,580 · $215/mo
- Projected year-2 tax
- $2,580 · $215/mo
- Expected delta
- $0/yr ($0/mo · 0.0%)
ⓘ Screening estimate from a state-policy table — verify with the county assessor before closing.
Climate risk First Street
- Flood 1/10 Low FEMA zone X (unshaded) · 0% chance over 30 yrs
- Wildfire 1/10 Low
- Heat 10/10 Extreme 7 d/yr ≥107°F today · 26 d/yr by 30 yrs out
- Wind 9/10 Extreme 99% chance of damaging wind over 30 yrs
- Air quality 3/10 Moderate 3 unhealthy d/yr today · 4 by 30 yrs out
Nearby sold comps map
Loading sold comps map…
Walkable amenities ~0.75 mi
Loading nearby amenities…
Taxation est. · year 1
- Rental income
- $24,662
- − Mortgage interest
- −$11,198
- − Property taxes
- −$2,580
- − Insurance
- −$1,000
- − Repairs & maintenance
- −$1,973
- − Management
- −$1,973
- − Depreciation
- −$5,815
- Taxable income
- $124
- Est. tax owed @ 24.0%
- −$30
- After-tax cash flow
- $3,294/yr
For passive investors: Depreciation is non-cash, so a rental often shows a tax loss while cash-flowing — sheltering income. Rental losses are passive: they offset passive income freely, and up to $25,000/yr can offset ordinary (W-2) income if you actively participate and your MAGI is under $100k (phasing out to $0 by $150k); unused losses carry forward. On sale, claimed depreciation is recaptured at up to 25%, and gains may owe capital-gains tax (a 1031 exchange can defer both). Figures are a year-1 estimate at your 24.0% rate — not tax advice; consult a CPA.
Schools (NCES district)
- District
- Hillsborough
- NCES district ID
- 1200870
- Math proficiency
- 47% ▼ -8.00%
- Reading proficiency
- 50% ▼ -4.00%
- Median HH income
- $50,622
- Composite
- 41.6/100
- National rank
- #3435
- State rank
- #41 of 73 in FL
Livability — Tampa
- Score
- 79/100
- State rank
- #142
- US rank
- #2135
Category grades
Schools grade is shown separately in the Schools card above.
Census & demographics
- Census place
- Tampa, FL
- County
- Hillsborough County · 1,540,968 people
- City population
- 523,346
- Metro
- Tampa-St. Petersburg-Clearwater, FL
- Population (ZIP)
- 16,030
- Household income
- $36,975
- Rent vs Own
- Severe rent burden
- 1374.0
Population outlook (Hillsborough County) Hauer SSP2
- Today (2025)
- 1,607,022 people
- By 2030
- 1,733,968 · +7.9%
- By 2040
- 1,979,565 · +23.2%
- By 2050
- 2,203,427 · +37.1%
- By 2075
- 2,667,893 · +66.0%
- By 2100
- 2,891,558 · +79.9%
Race, ethnicity, and origin ACS 2023
- Neighborhood character
- Diverse neighborhood (Simpson 0.66)
- Race & ethnicity
- Black 48% Hispanic / Latino 28% Two or more races 18% White 17% Asian 1%
- Hispanic origin (detail)
- Mexican 6% Puerto Rican 8% Cuban 6% Dominican 1%
- Common ancestry
- Hispanic 2% Romanian 1% Lithuanian 1%
- Foreign-born
- 17% · Canada, Vietnam, Jamaica
- Languages at home
- 72% English-only · Spanish 24% French/Haitian/Cajun 3% Other Asian/Pacific 1%
Political lean MEDSL · Hillsborough
- 2024 margin
- Toss-up / Even · D 47.8% · R 50.9% · Other 1.3%
- 2008→2024 swing
- -10.2pp toward R · 2008: 7.1pp · 2024: -3.1pp
- All cycles
- 2024: R+3.1 2020: D+6.9 2016: D+6.8 2012: D+6.7 2008: D+7.1
Not yet ingested
- Civics
- —
Market trends
- HPI YoY
- ▲ 17.43%
- Current HPI
- 494.1871
- Rent YoY
- ▲ 0.58%
- Metro
- Tampa-St. Petersburg-Clearwater, FL
- State GDP YoY
- ▲ 3.28%
- F500 in state
- 36
Industry mix (Fortune 500 HQ in FL)
| Industry | F500 HQs | Revenue |
|---|---|---|
| Industrial Technology | 2 | $29B |
|
||
| Insurance | 2 | $17B |
|
||
| Retail | 1 | $60B |
|
||
| Technology Distribution | 1 | $58B |
|
||
| Homebuilding | 1 | $35B |
|
||
| Technology Manufacturing | 1 | $35B |
|
||
Price history
2 events — show timeline
- 2026-06-08 Pending — Stellar MLS as Distributed by MLS Grid
- 2026-06-08 Listed $199,900 Stellar MLS as Distributed by MLS Grid
Property tax history
+10.7%/yrLatest (2025): $2,580 · +11.8% YoY. Source: county tax records.
Cash-flow waterfall
monthlySold comps — $/sqft
last 12 mo · ≤1 miLoading sold comps…