 🌊 Lakefront
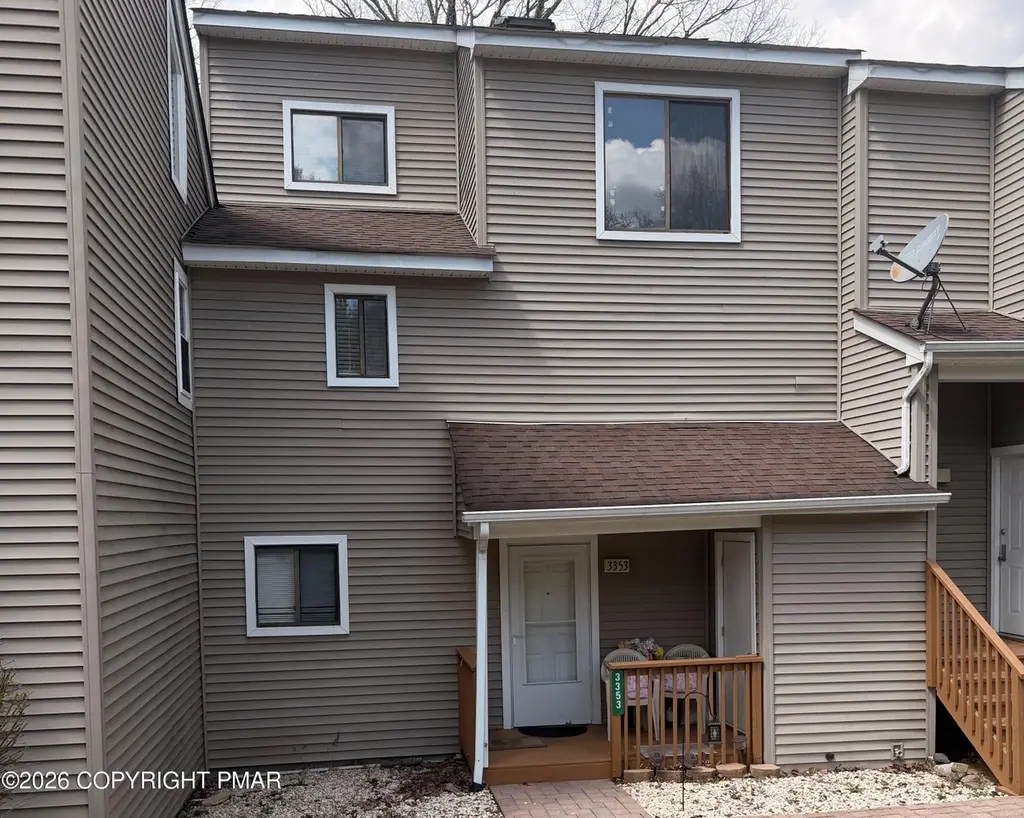
3353 Windemere Dr · Saw Creek, PA
Flood risk 1/10 · Minimal
- FEMA flood zone
- X (unshaded)
- Chance of flooding over 30 yrs
- 0.0%
- Est. flood insurance / yr
- $473 – $860
Fire risk 4/10 · Minor
- Est. fire insurance / yr
- $511 – $949
Heat risk 4/10 · Minor
- Hot days now (above 95°F)
- 7 days/yr
- Hot days in 30 yrs
- 15 days/yr
Wind risk 4/10 · Minor
- Chance of severe wind over 30 yrs
- 11.0%
Air-quality risk 2/10 · Minimal
- Unhealthy air days now
- 1 days/yr
- Unhealthy air days in 30 yrs
- 2 days/yr
Risk factors via First Street. Map © Google.
Why this score? — see what drove the C+ grade
The composite is a weighted blend of 9 inputs, each scored 0–100. Each bar is that input's sub-score; the figure is the points it added to the 100-point composite (weight × sub-score).
- Cash flow +17.5/30.0
- ARV discount +15.0/15.0
- 1% rule +7.2/10.0
- Appreciation +6.8/10.0
- DSCR +5.5/10.0
- Schools +3.0/10.0
- Livability +3.0/5.0
- Condition / age +2.8/5.0
- Rent growth +2.5/5.0
$180,000
🖨 Deal sheet (PDF) 📄 Offer letter ✓ Due diligence
Listing remarks
Lakefront living under $200,000! Do not miss this opportunity to own this 3 bed 1.5 bath townhome overlooking the lake in Saw Creek Estates. This property is drenched in natural light from all the windows, skylights and big sliders off the living room. With bonuses for all year round there is a wood burning fireplace to cozy up to in the winter and a large deck to relax and enjoy the changing scenery of the seasons and wildlife on the lake. It's the best of Pocono living, and that's just the townhome! There is plenty to explore in the community including indoor and outdoor pools, playgrounds, a community recreation center, tennis courts, basketball courts, ski slopes, and clubhouse amenitie
Key facts
- Lakefront living
- Large deck
- Natural light
Tags
Neighborhood map
What this means for you Summary
Snapshot
- This is a 3-bed/1.5-bath townhouse listed at $180k. Condition is rated average.
Deal economics
- At list price, monthly cash flow is $139 ($2k/yr) — positive.
- The deal already cash-flows at list — no discount required.
- Meets the 1% rule at list price ($2k rent vs $180k).
- Cap rate 7.2% vs local median 4.3% in Saw Creek — top-decile yield for the area; either an underpriced asset or a hidden risk that comps aren't pricing in. Stress-test before assuming the spread holds.
Location & tenants
- Location reads 59/100 on livability (#1,538 in PA) — a working-class tenant base; expect higher turnover. Strengths: crime A+, cost of living A+, housing A+; Watch: employment C-, health & safety D, schools F.
- East Stroudsburg Area SD (rural): math 25% / reading 43% proficiency, ranked #413 of 539 in PA (top 77%) — families likely to look elsewhere, expect single-tenant / working-renter base with shorter leases.
- Market conditions: 293 active listings in the ZIP; 1 comparable units currently listed for rent nearby; 213 units permitted in Pike County in 2024 (0 in 5+ unit buildings).
Forward outlook
- In year one you build about $8k of equity ($1k loan paydown + $6k appreciation (3.5% local appreciation)).
- Pike County population projected at -25% by 2050 — secular population decline; favor cash flow + early exit over multi-decade hold.
- At projected returns (3.5% appreciation + 3.0% rent growth), your $50k cash investment doubles in ~5 years — after that, you're playing with house money.
- By year 5, paydown + projected appreciation supports a ~$33k cash-out refi (75% LTV) — recoverable capital for the next deal without selling this one.
Negotiation context
- Only 3 days on market — expect competitive offers; lowballing is unlikely to land.
- 3 sale attempts with the ask held roughly flat each time — persistent listings suggest the price (not the market) is what's stuck; bring a comps-based counter.
Questions for the listing agent
- What does the HOA fee cover, when was the last increase, and are there any pending special assessments or reserve-fund shortfalls?
- Is there a deadline driving the sale (1031 exchange, divorce, estate, relocation)? That informs how much negotiation room exists.
- Schools are F-rated, which usually means shorter tenancies and higher turnover. Who's the typical renter profile here, and what's been the actual vacancy rate?
- This sits on a lake — are riparian / water-frontage rights deeded with the parcel? Any dock permits, shoreline easements, or HOA water-use restrictions?
- What's the documented flood / surge / shoreline-erosion history here (FEMA AND non-FEMA — e.g., storm surge, creek backup, septic-field saturation)?
- Any water-quality or seasonal algae-bloom issues that affect tenant satisfaction or short-term-rental demand?
- What's the average days-on-market for RENTAL listings here right now (not sales)? A rising rental-DOM trend means longer vacancies and softer asking-rent achievability than the comps imply.
- What's the recent tenant-quality profile in this submarket — average credit score on applications, eviction rate, late-payment / NSF rate, and stable-employment percentage? A property-management company in the area should have these aggregated.
- How much new for-sale + rental construction is in the pipeline within 1–3 miles? Heavy new supply typically softens prices + rents 12–24 months out; constrained supply supports both.
Investment metrics
- 1% rule
- 1.22% ✓
- Cap rate
- 7.22%
- Cash-on-cash
- 3.31%
- DSCR
- 1.15
- GRM
- 6.8
CMA / ARV
- ARV (on-the-fly)
- $243,840
- Comps found
- 2
Show comp detail 2 sales within ~0.75 mi
| Address | Dist | Beds/Ba | Sqft | Sold | Price | $/sf | Match |
|---|---|---|---|---|---|---|---|
| 3319 Windermere Dr | 0.10mi | 3/2.5 | 1,600 (+5%) | 14mo | $245,000 | $153 | 71 |
| 3339 Windermere Dr | 0.04mi | 2/2.5 (-1) | 1,440 (-6%) | 21mo | $230,000 | $160 | 62 |
Match score weights: distance 35% · size 25% · config 20% · recency 20%. Top-matched comps best support the ARV.
Projected returns pro-forma
3.51% appreciation · 3.0% rent growth · sell at horizon
- IRR
- 12.0%
- Equity multiple
- 1.71×
- Total profit
- $35,658
- Equity at exit
- $86,113
- IRR
- 13.9%
- Equity multiple
- 3.16×
- Total profit
- $109,000
- Equity at exit
- $136,884
Cash invested: $50,400 (down + closing). Projections, not guarantees.
Landlord ↔ Tenant lean methodology
- Overall (STATE)
- 62 Landlord-Friendly
- State Pennsylvania
- 62 Landlord-Friendly · EVEN
- County
- — inherits STATE
- City
- — inherits STATE
ZIP-level market 18324
- Home prices YoY
- 1.5%
- Active inventory
- 293
- Price-to-rent
- 6.8×
Monthly cashflow live
- Estimated rent
- $2,200 medium interval (Pro) →
- Mortgage (P&I)
- −$944
- Tax est. 1.5%
- −$225 /mo · $2,700/yr
- Insurance
- −$75
- HOA
- −$355
- Vacancy / Maint / Mgmt
- −$462
- Net cashflow
- $139
Break-even live
Sensitivity live
| Price | -10% $263 | -5% $201 | +0% $139 | +5% $77 | +10% $15 |
|---|---|---|---|---|---|
| Rent | -10% $-35 | -5% $52 | +0% $139 | +5% $226 | +10% $313 |
| Rate | -1.0pp $230 | -0.5pp $185 | base $139 | +0.5pp $92 | +1.0pp $45 |
UW: 25.0% down · 7.5% · 30yr · 1.5% tax · 5.0% vac · 8.0% maint · 8.0% mgmt
Financing live
Cash to close
- Down payment
- $45,000
- Closing costs
- $5,400
- Reserves months
- —
- Total cash needed
- —
Loan-product check · same deal, 3 products live
Conventional
25% down · 7.5% · 30yr
- Down + closing
- —
- Monthly P&I
- —
- Monthly cashflow
- —
- DSCR
- —
- Eligible?
- —
Personal DTI + credit; lowest rate.
DSCR
20% down · 8.5% · 30yr
- Down + closing
- —
- Monthly P&I
- —
- Monthly cashflow
- —
- DSCR
- —
- Eligible?
- —
No personal income docs; deal must DSCR.
Hard money
10% down · 12.0% · 12mo
- Down + closing
- —
- Monthly P&I
- —
- Monthly cashflow
- —
- DSCR
- —
- Eligible?
- —
Short-term bridge; refi at stabilization.
Rent comps 1 comps
| Address | Beds | Baths | Sqft | Rent | $/sqft | DOM | Units | Dist |
|---|---|---|---|---|---|---|---|---|
| 272 Stafford Dr Bushkill, PA | 3.0 | 2.0 | 1218 | $2,200 | $1.81 | 0d | 1 | 0.89mi |
HOA detail
- Monthly dues
- $355 · $4,260/yr
- Likely covers
- landscapingpool
Listing history 11 events
-
2026-04-20status Pending
-
2026-04-17price $180,000
-
2026-04-06$175,000 Active
-
2026-01-01historical
-
2025-11-19price $205,000
-
2025-11-19price $205,000
-
2025-09-06price $215,000
-
2025-09-06price $215,000
-
2025-08-17$225,000 Active
-
2025-07-18price $225,000
-
2025-06-20$230,000 Active
ⓘ Source: listings_history table (triggers on properties + properties_extension) + one-shot
backfill from property_details.listing_events for pre-trigger history.
Climate risk First Street
- Flood 1/10 Low FEMA zone X (unshaded) · 0% chance over 30 yrs
- Wildfire 4/10 Moderate
- Heat 4/10 Moderate 7 d/yr ≥95°F today · 15 d/yr by 30 yrs out
- Wind 4/10 Moderate 11% chance of damaging wind over 30 yrs
- Air quality 2/10 Low 1 unhealthy d/yr today · 2 by 30 yrs out
Nearby sold comps map
Loading sold comps map…
Walkable amenities ~0.75 mi
Loading nearby amenities…
Taxation est. · year 1
- Rental income
- $26,400
- − Mortgage interest
- −$10,083
- − Property taxes
- −$2,700
- − Insurance
- −$900
- − Repairs & maintenance
- −$2,112
- − Management
- −$2,112
- − HOA
- −$4,260
- − Depreciation
- −$5,236
- Taxable loss
- −$1,003
- Est. tax savings @ 24.0%
- +$241
- After-tax cash flow
- $1,909/yr
For passive investors: Depreciation is non-cash, so a rental often shows a tax loss while cash-flowing — sheltering income. Rental losses are passive: they offset passive income freely, and up to $25,000/yr can offset ordinary (W-2) income if you actively participate and your MAGI is under $100k (phasing out to $0 by $150k); unused losses carry forward. On sale, claimed depreciation is recaptured at up to 25%, and gains may owe capital-gains tax (a 1031 exchange can defer both). Figures are a year-1 estimate at your 24.0% rate — not tax advice; consult a CPA.
Condition & rehab AI · 12 photos
This townhouse requires moderate renovations to update the kitchen and exterior, but offers a good starting point with a lakefront view and community amenities.
Repairs flagged
- Moderate kitchen cabinets — dated and worn
- Moderate kitchen countertops — dated and worn
- Moderate kitchen appliances — dated and worn
Value-add opportunities
- Both modern kitchen appliances — improves functionality and aesthetics
- Both new flooring — enhances overall appearance and durability
- Both exterior painting — enhances curb appeal and value
- Both landscaping — enhances curb appeal and value
Renovation cost estimate screening
| Repair item | Severity | Est. cost |
|---|---|---|
| kitchen cabinets · dated and worn | Moderate | $3,000–15,000 |
| kitchen countertops · dated and worn | Moderate | $3,000–15,000 |
| kitchen appliances · dated and worn | Moderate | $3,000–15,000 |
| Total estimated repair cost · 3 items | $9,000–45,000 |
Value-add ROI direction
- Both modern kitchen appliances — improves functionality and aesthetics ↑
- Both new flooring — enhances overall appearance and durability ↑
- Both exterior painting — enhances curb appeal and value ↑
- Both landscaping — enhances curb appeal and value ↑
ⓘ Cost ranges are severity-bucket heuristics (US national rule-of-thumb). Get contractor quotes + a written scope before underwriting a rehab budget.
Schools (NCES district)
- District
- East Stroudsburg Area SD
- NCES district ID
- 4208670
- Math proficiency
- 25% ▼ -11.00%
- Reading proficiency
- 43% ▼ -18.00%
- Median HH income
- $57,142
- Composite
- 30.13/100
- National rank
- #6332
- State rank
- #413 of 539 in PA
Livability — Saw Creek
- Score
- 59/100
- State rank
- #1538
- US rank
- #20241
Category grades
Schools grade is shown separately in the Schools card above.
Census & demographics
- Census place
- Saw Creek, PA
- Population (ZIP)
- 9,591
Population outlook (Pike County) Hauer SSP2
- Today (2025)
- 53,548 people
- By 2030
- 51,622 · -3.6%
- By 2040
- 46,490 · -13.2%
- By 2050
- 40,372 · -24.6%
- By 2075
- 31,951 · -40.3%
- By 2100
- 26,821 · -49.9%
Race, ethnicity, and origin ACS 2023
- Neighborhood character
- Diverse neighborhood (Simpson 0.67)
- Race & ethnicity
- White 47% Hispanic / Latino 26% Black 21% Two or more races 12% Asian 1%
- Hispanic origin (detail)
- Mexican 1% Puerto Rican 12% Cuban 3% Dominican 5%
- Common ancestry
- Romanian 2% Estonian 1% Lithuanian 1%
- Foreign-born
- 19% · Canada, South Korea
- Languages at home
- 69% English-only · Spanish 19% Russian/Polish/Slavic 4% French/Haitian/Cajun 3%
Political lean MEDSL · Pike
- 2024 margin
- Strong R (+24.1) · D 37.6% · R 61.6%
- 2008→2024 swing
- -19.8pp toward R · 2008: -4.2pp · 2024: -24.1pp
- All cycles
- 2024: R+24.1 2020: R+19.0 2016: R+26.0 2012: R+11.0 2008: R+4.2
Not yet ingested
- Civics
- —
Market trends
- HPI YoY
- ▲ 3.51%
- Current HPI
- 243.6754
- Rent YoY
- —
- Metro
- —
- State GDP YoY
- ▲ 1.68%
- F500 in state
- 34
Industry mix (Fortune 500 HQ in PA)
| Industry | F500 HQs | Revenue |
|---|---|---|
| Healthcare | 2 | $309B |
|
||
| Insurance | 2 | $27B |
|
||
| Telecommunications / Media | 1 | $124B |
|
||
| Industrial Distribution | 1 | $22B |
|
||
| Financial Services | 1 | $20B |
|
||
| Chemicals / Materials | 1 | $18B |
|
||
Price history
-21.7% since first listed11 events — show timeline
- 2026-04-20 Pending — PMAR
- 2026-04-17 Price Changed $180,000 PMAR
- 2026-04-06 Listed $175,000 PMAR
- 2026-01-01 Listing Removed — GLVRMLS
- 2025-11-19 Price Changed $205,000 PMAR
- 2025-11-19 Price Changed $205,000 GLVRMLS
- 2025-09-06 Price Changed $215,000 PMAR
- 2025-09-06 Price Changed $215,000 GLVRMLS
- 2025-08-17 Listed $225,000 PMAR
- 2025-07-18 Price Changed $225,000 GLVRMLS
- 2025-06-20 Listed $230,000 GLVRMLS
Cash-flow waterfall
monthlySold comps — $/sqft
last 12 mo · ≤1 miLoading sold comps…