 🏢 Co-op
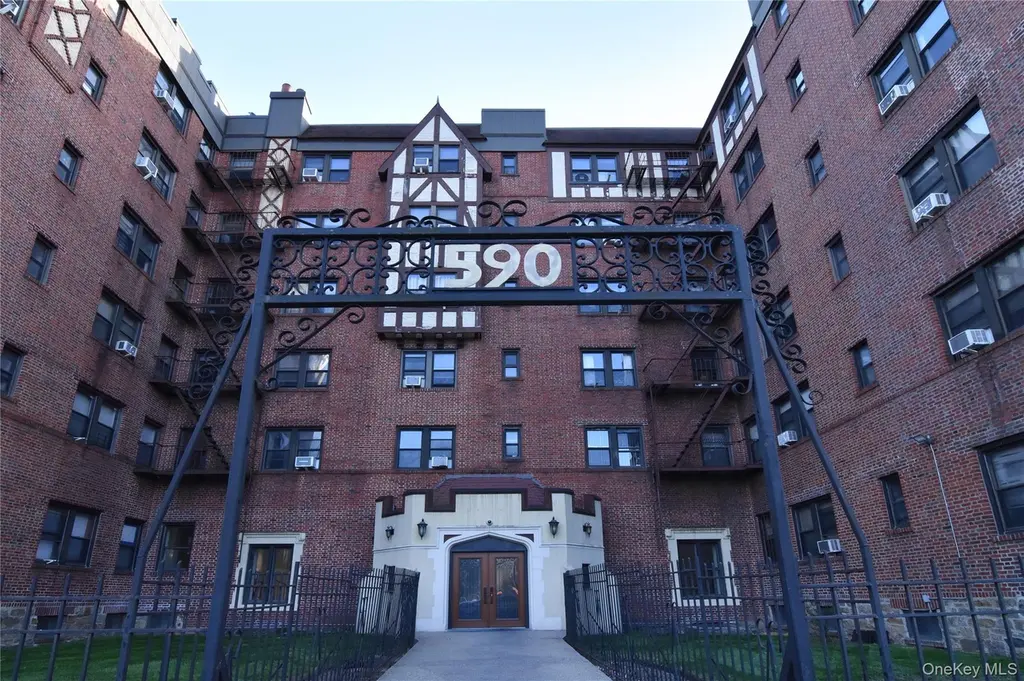
590 E 3rd St Unit MK · Mount Vernon, NY
Flood risk 1/10 · Minimal
- FEMA flood zone
- X (unshaded)
- Chance of flooding over 30 yrs
- 0.0%
- Est. flood insurance / yr
- $507 – $1,088
Fire risk 1/10 · Minimal
- Est. fire insurance / yr
- $691 – $1,283
Heat risk 6/10 · Moderate
- Hot days now (above 98°F)
- 7 days/yr
- Hot days in 30 yrs
- 15 days/yr
Wind risk 6/10 · Moderate
- Chance of severe wind over 30 yrs
- 27.0%
Air-quality risk 5/10 · Moderate
- Unhealthy air days now
- 6 days/yr
- Unhealthy air days in 30 yrs
- 8 days/yr
Risk factors via First Street. Map © Google.
Why this score? — see what drove the B- grade
The composite is a weighted blend of 9 inputs, each scored 0–100. Each bar is that input's sub-score; the figure is the points it added to the 100-point composite (weight × sub-score).
- Cash flow +27.2/30.0
- DSCR +9.5/10.0
- ARV discount +7.5/15.0
- 1% rule +7.4/10.0
- Condition / age +4.0/5.0
- Schools +3.7/10.0
- Livability +3.6/5.0
- Rent growth +2.5/5.0
- Appreciation +0.0/10.0
$265,000
🖨 Deal sheet 📄 Offer letter ✓ Due diligence
Listing remarks
590 E. 3rd Street – Mount Vernon / Pelham Border. Sponsor unit – no board approval! Spacious and renovated 3BR/1BA in a charming Tudor-style pre-war elevator co-op overlooking Hutchinson Park. This well-proportioned home offers a flexible layout with generously sized rooms, a bright living area with excellent natural light, and a renovated kitchen featuring modern cabinetry and stainless steel appliances. The updated, windowed full bath adds to the home’s appeal, while all three bedrooms provide comfortable living space with great light and versatility for sleeping, home office, or guest use. Set in a well-maintained elevator building, this residence blends classic pre-war
Key facts
- Tudor-style pre-war
- Renovated kitchen
- Elevator co-op
Tags
Property features AI
Exterior
- Parking: On-street parking; No carport
- Utilities: Con Edison electric service; Public sewer; Electricity available; Natural gas available
- Home design: Stock cooperative
- Construction: Block and brick construction
- Exterior features: Block and brick construction; Not waterfront; No additional parcels
Interior
- Kitchen: Range; Refrigerator
- Bedrooms: Entry level: 3; Total rooms: 3
- Bathrooms: 1 full bathroom
- Heating & cooling: Radiant heating; No central cooling
- Interior features: Elevator; Pets allowed (cats and dogs; size limits apply)
- Laundry & utility: No basement
Neighborhood map
What this means for you Summary
Snapshot
- This is a 3-bed/1.0-bath condo listed at $265k. Condition is rated good.
Deal economics
- At list price, monthly cash flow is $762 ($9k/yr) — positive.
- The deal already cash-flows at list — no discount required.
- Meets the 1% rule at list price ($3k rent vs $265k).
- Recommended offer: $261k (1.5% below list) — sets the bar for market timing.
- Cap rate 9.7% vs local median 5.3% in Mount Vernon — top-decile yield for the area; either an underpriced asset or a hidden risk that comps aren't pricing in. Stress-test before assuming the spread holds.
Location & tenants
- Location reads 71/100 on livability (#397 in NY) — a middle-class / working-renter tenant base. Strengths: commute A+, health & safety A, employment B; Watch: crime D-, cost of living F.
- Mount Vernon School District (suburban): math 35% / reading 50% proficiency, ranked #485 of 590 in NY (top 82%) — families likely to look elsewhere, expect single-tenant / working-renter base with shorter leases; 62% free/reduced lunch — lower-income household profile, screen leases tightly.
- Zoned schools: Graham School (math 17% / reading 42%, grade F, #1,729 of 2,108 statewide, top 84%, 425 students, 74% FRL); Benjamin Turner Middle School (math 8% / reading 32%, grade F, #678 of 729 statewide, top 94%, 196 students, 71% FRL); Mount Vernon High School (math 54% / reading 75%, grade B-, #776 of 1,100 statewide, top 73%, 1,094 students, 76% FRL).
- Market conditions: 47 active listings in the ZIP; 22 comparable units currently listed for rent nearby; rentals at typical pace (median 25d on market — plan ~3-4 weeks tenant-placement turnaround); 954 units permitted in Westchester County in 2024 (649 in 5+ unit buildings).
Forward outlook
- Local home prices are declining (-3.0%/yr); year-one equity from $2k of loan paydown is wiped out by about $8k of value loss. Plan a longer hold.
- Westchester County population projected at +10% by 2050 — modest demand growth; plan on rents tracking national, not racing it.
- At projected returns (-3.0% appreciation + 3.0% rent growth), your $74k cash investment doubles in ~10 years — after that, you're playing with house money.
Negotiation context
- It's been on market 22 days — a 2% lower offer ($261k) is reasonable based on typical stale-listing flexibility.
Risks & watch-outs
- Watch-outs: built in 1928 — expect roof / HVAC / electrical / plumbing capex.
- Climate carrying-cost: major wind risk, 27% chance of damaging wind over 30y; extreme-heat days projected 7→15/yr by 2055 (HVAC capex compounding) — expect insurance premiums to compound above CPI over the hold.
Questions for the listing agent
- Built in 1928 — when were the roof, HVAC, electrical panel, plumbing, and water heater last replaced?
- Any open or pending special assessments — roof, HVAC, plumbing, elevator, façade? What's the per-unit balance and payoff schedule, and is the seller paying it off at close or rolling it to the buyer?
- Is there a deadline driving the sale (1031 exchange, divorce, estate, relocation)? That informs how much negotiation room exists.
- Crime grade is D in this area — have there been break-ins, vandalism, or insurance claims at this property in the last 3 years? What carrier currently insures it and at what premium?
- What's the average days-on-market for RENTAL listings here right now (not sales)? A rising rental-DOM trend means longer vacancies and softer asking-rent achievability than the comps imply.
- What's the recent tenant-quality profile in this submarket — average credit score on applications, eviction rate, late-payment / NSF rate, and stable-employment percentage? A property-management company in the area should have these aggregated.
- How much new apartment / multifamily construction is in the pipeline within 1–3 miles? Heavy new supply (>2% of stock underway) typically softens rents 12–24 months out; light construction supports rent growth.
Investment metrics
- 1% rule
- 1.24% ✓
- Cap rate
- 9.74%
- Cash-on-cash
- 12.33%
- DSCR
- 1.55
- GRM
- 6.7
CMA / ARV
No comps found within radius.
Projected returns pro-forma
-3.0% appreciation · 3.0% rent growth · sell at horizon
- IRR
- 2.0%
- Equity multiple
- 1.08×
- Total profit
- $5,649
- Equity at exit
- $39,512
- IRR
- 11.6%
- Equity multiple
- 1.91×
- Total profit
- $67,624
- Equity at exit
- $22,912
Cash invested: $74,200 (down + closing). Projections, not guarantees.
Landlord ↔ Tenant lean methodology
- Overall (STATE)
- 15 Strongly Tenant-Friendly
- State New York
- 15 Strongly Tenant-Friendly · D+10
- County
- — inherits STATE
- City
- — inherits STATE
ZIP-level market 10553
- Active inventory
- 47
- Price-to-rent
- 6.7×
Monthly cashflow live
- Estimated rent
- $3,283 high interval (Pro) →
- Mortgage (P&I)
- −$1,390
- Tax est. 1.5%
- −$331 /mo · $3,975/yr
- Insurance
- −$110
- HOA
- −$0
- Vacancy / Maint / Mgmt
- −$689
- Net cashflow
- $762
Break-even live
UW: 25.0% down · 7.5% · 30yr · 1.5% tax · 5.0% vac · 8.0% maint · 8.0% mgmt
Financing live
Cash to close
- Down payment
- $66,250
- Closing costs
- $7,950
- Reserves months
- —
- Total cash needed
- —
Loan-product check · same deal, 3 products live
Conventional
25% down · 7.5% · 30yr
- Down + closing
- —
- Monthly P&I
- —
- Monthly cashflow
- —
- DSCR
- —
- Eligible?
- —
Personal DTI + credit; lowest rate.
DSCR
20% down · 8.5% · 30yr
- Down + closing
- —
- Monthly P&I
- —
- Monthly cashflow
- —
- DSCR
- —
- Eligible?
- —
No personal income docs; deal must DSCR.
Hard money
10% down · 12.0% · 12mo
- Down + closing
- —
- Monthly P&I
- —
- Monthly cashflow
- —
- DSCR
- —
- Eligible?
- —
Short-term bridge; refi at stabilization.
Rent comps 22 comps
| Address | Beds | Baths | Sqft | Rent | $/sqft | DOM | Units | Dist |
|---|---|---|---|---|---|---|---|---|
| 131 Pelhamdale Ave Mount Vernon, NY | 2.0 | 2.0 | 1600 | $3,300 | $2.06 | 4d | 1 | 0.31mi |
| 635 E Lincoln Ave Mount Vernon, NY | 2.0 | 1.0 | 1000 | $3,150 | $3.15 | 7d | 1 | 0.69mi |
| 218 Washington St Unit 2 Mt Vernon, NY | 4.0 | 2.0 | 950 | $3,900 | $4.11 | 24d | 1 | 0.71mi |
| 112 N Columbus Ave Unit 2 Mt Vernon, NY | 2.0 | 2.0 | 900 | $2,997 | $3.33 | 19d | 1 | 0.73mi |
| 10 9th St Unit 2 New Rochelle, NY | 2.0 | 1.0 | 1185 | $2,850 | $2.41 | 43d | 1 | 0.75mi |
| 9 9th St Unit 1st Floor New Rochelle, NY | 3.0 | 1.0 | 1463 | $3,400 | $2.32 | 43d | 1 | 0.77mi |
| 173 Washington St Unit 1 Mt Vernon, NY | 3.0 | 2.0 | 1100 | $3,000 | $2.73 | 24d | 1 | 0.79mi |
| 173 Washington St Unit 2 Mt Vernon, NY | 3.0 | 2.0 | 1500 | $3,200 | $2.13 | 1d | 1 | 0.79mi |
| 70 Elm Ave Unit Right Mt Vernon, NY | 3.0 | 2.5 | 1800 | $4,000 | $2.22 | 4d | 1 | 0.90mi |
| 148 Claremont Ave Mount Vernon, NY | 2.0 | 1.0 | 960 | $2,400 | $2.50 | 19d | 1 | 0.93mi |
| 36 4th St Unit One New Rochelle, NY | 2.0 | 1.0 | 900 | $2,900 | $3.22 | 4d | 1 | 0.99mi |
| 274 Lockwood Ave Unit First floor New Rochelle, NY | 2.0 | 1.0 | 908 | $2,700 | $2.97 | 43d | 1 | 1.03mi |
| 607 S 5th Ave Unit 2ND Mt Vernon, NY | 3.0 | 1.0 | 1200 | $3,400 | $2.83 | 24d | 1 | 1.14mi |
| 641 S 5th Ave Unit 1ST Mt Vernon, NY | 3.0 | 1.5 | 1300 | $3,600 | $2.77 | 4d | 1 | 1.18mi |
| 194 Webster Ave Unit 1 New Rochelle, NY | 3.0 | 1.0 | 1050 | $3,500 | $3.33 | 43d | 1 | 1.22mi |
| 60 Saint Pauls Pl Mount Vernon, NY | 3.0 | 1.0 | 1100 | $3,000 | $2.73 | 24d | 1 | 1.24mi |
| 173 Crary Ave Mount Vernon, NY | 3.0 | 2.0 | 1100 | $3,100 | $2.82 | 24d | 1 | 1.26mi |
| 421 S 10th Ave Mount Vernon, NY | 3.0 | 1.0 | 1200 | $3,500 | $2.92 | 24d | 1 | 1.32mi |
| 356 S Tenth Ave Unit 2nd Floor Mt Vernon, NY | 3.0 | 2.0 | 1100 | $3,850 | $3.50 | 24d | 1 | 1.34mi |
| 139 Sickles Ave Unit 2 New Rochelle, NY | 2.0 | 1.5 | 1000 | $3,100 | $3.10 | 20d | 1 | 1.35mi |
| 133 Lincoln Ave Unit 1 New Rochelle, NY | 3.0 | 1.0 | 1112 | $6,500 | $5.85 | 2d | 1 | 1.38mi |
| 123 Clinton Ave Unit 2 New Rochelle, NY | 4.0 | 2.0 | 1378 | $4,250 | $3.08 | 43d | 1 | 1.48mi |
HOA detail condo
- Monthly dues
- $0 · $0/yr
- Assessments
- None detected in remarks — confirm with the listing agent.
Listing history 2 events
-
2026-05-06status Pending
-
2026-04-14$265,000 Active
ⓘ Source: listings_history table (triggers on properties + properties_extension) + one-shot
backfill from property_details.listing_events for pre-trigger history.
Climate risk First Street
- Flood 1/10 Low FEMA zone X (unshaded) · 0% chance over 30 yrs
- Wildfire 1/10 Low
- Heat 6/10 Major 7 d/yr ≥98°F today · 15 d/yr by 30 yrs out
- Wind 6/10 Major 27% chance of damaging wind over 30 yrs
- Air quality 5/10 Major 6 unhealthy d/yr today · 8 by 30 yrs out
Nearby sold comps map
Loading sold comps map…
Walkable amenities ~0.75 mi
Loading nearby amenities…
Taxation est. · year 1
- Rental income
- $39,395
- − Mortgage interest
- −$14,844
- − Property taxes
- −$3,975
- − Insurance
- −$1,325
- − Repairs & maintenance
- −$3,152
- − Management
- −$3,152
- − Depreciation
- −$7,709
- Taxable income
- $5,238
- Est. tax owed @ 24.0%
- −$1,257
- After-tax cash flow
- $7,888/yr
For passive investors: Depreciation is non-cash, so a rental often shows a tax loss while cash-flowing — sheltering income. Rental losses are passive: they offset passive income freely, and up to $25,000/yr can offset ordinary (W-2) income if you actively participate and your MAGI is under $100k (phasing out to $0 by $150k); unused losses carry forward. On sale, claimed depreciation is recaptured at up to 25%, and gains may owe capital-gains tax (a 1031 exchange can defer both). Figures are a year-1 estimate at your 24.0% rate — not tax advice; consult a CPA.
Condition & rehab AI · 12 photos
This renovated 3-bedroom, 1-bathroom unit in a charming Tudor-style pre-war elevator co-op is move-in ready and offers a good condition score with minimal repairs needed.
Value-add opportunities
- Both Paint exterior brick — Enhances curb appeal and resale value
- Both Replace window screens — Improves energy efficiency and aesthetics
- Both Install smart home devices — Enhances convenience and marketability
Renovation cost estimate screening
Value-add ROI direction
- Both Paint exterior brick — Enhances curb appeal and resale value ↑
- Both Replace window screens — Improves energy efficiency and aesthetics ↑
- Both Install smart home devices — Enhances convenience and marketability ↑
ⓘ Cost ranges are severity-bucket heuristics (US national rule-of-thumb). Get contractor quotes + a written scope before underwriting a rehab budget.
Schools (NCES district)
- District
- Mount Vernon School District
- NCES district ID
- 3620100
- Math proficiency
- 35% ▼ -3.00%
- Reading proficiency
- 50% ▲ 6.00%
- Median HH income
- $50,890
- Composite
- 36.59/100
- National rank
- #4631
- State rank
- #485 of 590 in NY
Livability — Mount Vernon
- Score
- 71/100
- State rank
- #397
- US rank
- #6876
Category grades
Schools grade is shown separately in the Schools card above.
Census & demographics
- Census place
- Mount Vernon, NY
- City population
- 61,313
- Population (ZIP)
- 10,815
Population outlook (Westchester County) Hauer SSP2
- Today (2025)
- 1,028,035 people
- By 2030
- 1,051,636 · +2.3%
- By 2040
- 1,098,520 · +6.9%
- By 2050
- 1,136,044 · +10.5%
- By 2075
- 1,196,925 · +16.4%
- By 2100
- 1,175,147 · +14.3%
Race, ethnicity, and origin ACS 2023
- Neighborhood character
- Predominantly Black (67%)
- Race & ethnicity
- Black 67% Hispanic / Latino 15% White 12% Two or more races 8%
- Hispanic origin (detail)
- Puerto Rican 6% Dominican 3%
- Common ancestry
- Russian 7% Lithuanian 1% Romanian 1%
- Foreign-born
- 35% · Canada, Jamaica, Mexico
- Languages at home
- 76% English-only · Spanish 11% Other Indo-European 6% German/W. Germanic 1%
Political lean MEDSL · Westchester
- 2024 margin
- Strong D (+26.3) · D 63.1% · R 36.9%
- 2008→2024 swing
- -1.3pp toward R · 2008: 27.6pp · 2024: 26.3pp
- All cycles
- 2024: D+26.3 2020: D+36.3 2016: D+32.8 2012: D+22.2 2008: D+27.6
Not yet ingested
- Civics
- —
Market trends
- HPI YoY
- ▼ -114.74%
- Current HPI
- 206.233
- Rent YoY
- —
- Metro
- —
- State GDP YoY
- ▲ 2.60%
- F500 in state
- 92
Industry mix (Fortune 500 HQ in NY)
| Industry | F500 HQs | Revenue |
|---|---|---|
| Financial Services | 10 | $950B |
|
||
| Consumer Goods | 9 | $162B |
|
||
| Insurance | 4 | $225B |
|
||
| Telecommunications | 2 | $144B |
|
||
| Pharmaceuticals | 2 | $112B |
|
||
| Media / Entertainment | 2 | $69B |
|
||
Price history
2 events — show timeline
- 2026-05-06 Pending — OneKey® MLS as Distributed by MLS Grid
- 2026-04-14 Listed $265,000 OneKey® MLS as Distributed by MLS Grid
Cash-flow waterfall
monthlySold comps — $/sqft
last 12 mo · ≤1 miLoading sold comps…