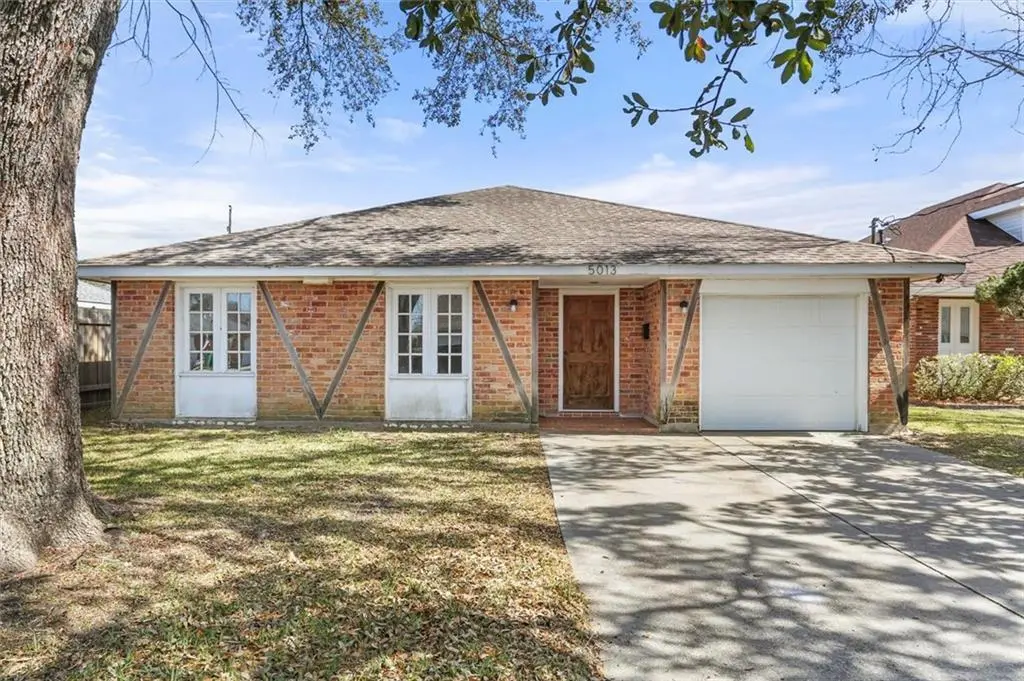
5013 Jeannette Dr · Metairie, LA
Flood risk 8/10 · Major
- FEMA flood zone
- X
- Chance of flooding over 30 yrs
- 0.6%
- Est. flood insurance / yr
- $507 – $1,088
Fire risk 1/10 · Minimal
- Est. fire insurance / yr
- $1,269 – $2,357
Heat risk 10/10 · Severe
- Hot days now (above 108°F)
- 7 days/yr
- Hot days in 30 yrs
- 21 days/yr
Wind risk 10/10 · Severe
- Chance of severe wind over 30 yrs
- 99.0%
Air-quality risk 3/10 · Minor
- Unhealthy air days now
- 2 days/yr
- Unhealthy air days in 30 yrs
- 3 days/yr
Risk factors via First Street. Map © Google.
Why this score? — see what drove the D grade
The composite is a weighted blend of 9 inputs, each scored 0–100. Each bar is that input's sub-score; the figure is the points it added to the 100-point composite (weight × sub-score).
- ARV discount +13.7/15.0
- Cash flow +11.2/30.0
- Livability +4.4/5.0
- DSCR +3.3/10.0
- Rent growth +3.0/5.0
- 1% rule +2.6/10.0
- Schools +2.5/10.0
- Condition / age +2.5/5.0
- Appreciation +0.0/10.0
$299,000
🖨 Deal sheet (PDF) 📄 Offer letter ✓ Due diligence
Listing remarks MLS
Tradtional spacious floor plan, all brick in comfortable neighborhood, living/dining or 2nd den with extra wide kitchen and breakfast area that opens to den. All bedrooms have large closets, covered patio and garage, well maintained and no carpet throughout.
Key facts
- Garage
- Built 1981
- Listed 116 days
Neighborhood map
What this means for you Summary
Snapshot
- This is a 3-bed/2.0-bath single-family listed at $299k.
Deal economics
- At list price, monthly cash flow is $-180 ($-2k/yr) — negative.
- To cash-flow at today's rent, offer at most $267k (10.6% below list).
- To meet the 1% rule (rent ≥ 1% of price), the offer needs to be $226k (24.3% below list).
- Recommended offer: $226k (24.3% below list) — sets the bar for 1% rule.
- Cap rate 5.8% vs local median 3.6% in Metairie — top-decile yield for the area; either an underpriced asset or a hidden risk that comps aren't pricing in. Stress-test before assuming the spread holds.
Location & tenants
- Location reads 87/100 on livability (#1 in LA, #261 nationally) — a professional / high-income tenant draw. Strengths: commute A+, housing A+, health & safety A+.
- Jefferson Parish (suburban): math 24% / reading 34% proficiency, ranked #44 of 98 in LA (top 45%) — low school quality limits family demand, transient renter base, plan for 1-2y turnover; 70% free/reduced lunch — lower-income household profile, screen leases tightly.
- Zoned schools: Airline Park Academy For Advanced Studies (math 92% / reading 92%, grade A+, #3 of 646 statewide, top 0%, 418 students, 16% FRL); John Q. Adams Middle School (math 22% / reading 36%, grade F, #117 of 218 statewide, top 54%, 900 students, 55% FRL); Grace King High School (math 16% / reading 23%, grade F, #186 of 265 statewide, top 73%, 1,463 students, 47% FRL) — zoned schools average 39% FRL vs 70% district-wide (31 pts lower); this property's tenant base skews higher-income than the district average.
- Zoned-school proficiency averages 47% at this address vs 29% district-wide (+18 pts) — the actual schools serving this property are materially stronger than the Jefferson Parish average implies; a family-tenant draw the district grade alone would hide.
- Market conditions: Rents rising (+2.1%/yr); 227 active listings in the ZIP; 28 comparable units currently listed for rent nearby; rentals at typical pace (median 26d on market — plan ~3-4 weeks tenant-placement turnaround); solid renter incomes; 518 units permitted in Jefferson Parish in 2024 (43 in 5+ unit buildings).
- This rent runs 36% of the median local income ($76k/yr) — at the standard rent-burdened threshold; future hikes will face affordability resistance.
Forward outlook
- Local home prices are declining (-3.0%/yr); year-one equity from $2k of loan paydown is wiped out by about $9k of value loss. Plan a longer hold.
Negotiation context
- It's been on market 116 days — a 9% lower offer ($272k) is reasonable based on typical stale-listing flexibility.
- 2 sale attempts; this cycle's ask has dropped $31k (9%) from the opening price — seller is motivated, your offer sets the floor, not the list.
- Current owner paid $77k; list at $299k implies a 288% gain — meaningful room to come down on a strong offer.
Risks & watch-outs
- Watch-outs: flood insurance adds $66/mo.
- Climate carrying-cost: severe flood risk; severe wind risk, 99% chance of damaging wind over 30y; extreme-heat days projected 7→21/yr by 2055 (HVAC capex compounding) — expect insurance premiums to compound above CPI over the hold.
Questions for the listing agent
- What do current leases actually rent for vs. the listed asking? Can we see a recent rent roll and the last 12 months of T-12 income?
- It's been on market 116 days. Have you received any prior offers? Is the seller open to a 24% concession, seller financing, or rate buy-down credit?
- What's the actual annual flood-insurance premium (NFIP or private), and is the property in a SFHA with mandatory coverage?
- Why hasn't it sold? Are there any deal-killer items the seller is aware of (foundation, flood, title, zoning, code violations)?
- Is there a deadline driving the sale (1031 exchange, divorce, estate, relocation)? That informs how much negotiation room exists.
- Schools are B-rated — typically a magnet for longer-tenancy family renters. What's the average tenant stay here, and is there a school-zone premium baked into asking?
- The area grade is low — what's the realistic commute time and amenity access for the typical tenant pool here? Any planned neighborhood developments (good or bad) we should know about?
- What's the average days-on-market for RENTAL listings here right now (not sales)? A rising rental-DOM trend means longer vacancies and softer asking-rent achievability than the comps imply.
- What's the recent tenant-quality profile in this submarket — average credit score on applications, eviction rate, late-payment / NSF rate, and stable-employment percentage? A property-management company in the area should have these aggregated.
- How much new for-sale + rental construction is in the pipeline within 1–3 miles? Heavy new supply typically softens prices + rents 12–24 months out; constrained supply supports both.
Investment metrics
- 1% rule
- 0.76% ✗
- Cap rate
- 5.84%
- Cash-on-cash
- -1.63%
- DSCR
- 0.93
- GRM
- 11.0
CMA / ARV
- ARV (median comp)
- $346,867
- List price
- $299,000
- Delta
- -13.80%
- Verdict
- UNDERPRICED
- Comps
- 20 within 1.0 mi
Show comp detail 12 sales within ~0.75 mi
| Address | Dist | Beds/Ba | Sqft | Sold | Price | $/sf | Match |
|---|---|---|---|---|---|---|---|
| 5041 Burke Dr | 0.14mi | 3/2.0 | 1,711 (-4%) | 6mo | $384,000 | $224 | 82 |
| 4917 Pike Dr | 0.19mi | 3/2.0 | 1,705 (-4%) | 3mo | $395,000 | $232 | 81 |
| 4709 Senac Dr | 0.30mi | 3/2.0 | 1,720 (-3%) | 2mo | $220,000 | $128 | 79 |
| 4908 Pike Dr | 0.22mi | 3/2.0 | 1,931 (+9%) | 2mo | $247,500 | $128 | 74 |
| 4908 Alexander Dr | 0.12mi | 4/2.0 (+1) | 1,941 (+9%) | 5mo | $340,000 | $175 | 70 |
| 5221 Alexander Dr | 0.23mi | 3/3.5 | 1,893 (+6%) | 3mo | $320,000 | $169 | 70 |
| 4617 Jeannette Dr | 0.33mi | 3/2.0 | 1,943 (+9%) | 5mo | $315,000 | $162 | 65 |
| 4813 Academy Dr | 0.33mi | 3/2.5 | 1,990 (+12%) | 0mo | $186,000 | $93 | 62 |
| 3920 Lake Trail Dr | 0.74mi | 3/2.0 | 1,857 (+4%) | 2mo | $377,000 | $203 | 56 |
| 6809 Wilty St | 0.71mi | 4/2.5 (+1) | 1,840 (+4%) | 6mo | $290,000 | $158 | 49 |
| 4613 Page Dr | 0.71mi | 3/2.0 | 1,930 (+9%) | 6mo | $300,000 | $155 | 48 |
| 7013 Wilty St | 0.73mi | 4/2.0 (+1) | 2,036 (+15%) | 1mo | $255,000 | $125 | 36 |
Match score weights: distance 35% · size 25% · config 20% · recency 20%. Top-matched comps best support the ARV.
Projected returns pro-forma
-3.0% appreciation · 2.15% rent growth · sell at horizon
- IRR
- -21.5%
- Equity multiple
- 0.26×
- Total profit
- $-61,873
- Equity at exit
- $44,582
- IRR
- -17.2%
- Equity multiple
- 0.09×
- Total profit
- $-76,506
- Equity at exit
- $25,852
Cash invested: $83,720 (down + closing). Projections, not guarantees.
Landlord ↔ Tenant lean methodology
- Overall (STATE)
- 90 Strongly Landlord-Friendly
- State Louisiana
- 90 Strongly Landlord-Friendly · R+12
- County
- — inherits STATE
- City
- — inherits STATE
ZIP-level market 70003
- Rents YoY
- 2.1%
- Active inventory
- 227
- Price-to-rent
- 11.0×
Monthly cashflow live
- Estimated rent
- $2,264 high interval (Pro) →
- Mortgage (P&I)
- −$1,568
- Tax from tax record
- −$210 /mo · $2,520/yr
- Insurance
- −$125
- Flood insurance flood zone
- −$66 /mo · $798/yr
- HOA
- −$0
- Vacancy / Maint / Mgmt
- −$476
- Net cashflow
- $-180
Break-even live
Sensitivity live
| Price | -10% $-11 | -5% $-96 | +0% $-180 | +5% $-265 | +10% $-349 |
|---|---|---|---|---|---|
| Rent | -10% $-359 | -5% $-270 | +0% $-180 | +5% $-91 | +10% $-1 |
| Rate | -1.0pp $-30 | -0.5pp $-104 | base $-180 | +0.5pp $-258 | +1.0pp $-336 |
UW: 25.0% down · 7.5% · 30yr · 1.5% tax · 5.0% vac · 8.0% maint · 8.0% mgmt
Financing live
Cash to close
- Down payment
- $74,750
- Closing costs
- $8,970
- Reserves months
- —
- Total cash needed
- —
Loan-product check · same deal, 3 products live
Conventional
25% down · 7.5% · 30yr
- Down + closing
- —
- Monthly P&I
- —
- Monthly cashflow
- —
- DSCR
- —
- Eligible?
- —
Personal DTI + credit; lowest rate.
DSCR
20% down · 8.5% · 30yr
- Down + closing
- —
- Monthly P&I
- —
- Monthly cashflow
- —
- DSCR
- —
- Eligible?
- —
No personal income docs; deal must DSCR.
Hard money
10% down · 12.0% · 12mo
- Down + closing
- —
- Monthly P&I
- —
- Monthly cashflow
- —
- DSCR
- —
- Eligible?
- —
Short-term bridge; refi at stabilization.
Rent comps 28 comps
| Address | Beds | Baths | Sqft | Rent | $/sqft | DOM | Units | Dist |
|---|---|---|---|---|---|---|---|---|
| 4837 Academy Dr Metairie, LA | 3.0 | 2.0 | 1834 | $3,000 | $1.64 | 25d | 1 | 0.24mi |
| 4908 Purdue Dr Metairie, LA | 4.0 | 2.0 | 1846 | $1,995 | $1.08 | 6d | 1 | 0.25mi |
| 4312 Tartan Dr Metairie, LA | 4.0 | 2.0 | 1500 | $2,150 | $1.43 | 25d | 1 | 0.69mi |
| 3600 Lake Trail Dr Kenner, LA | 4.0 | 2.5 | 2600 | $2,800 | $1.08 | 6d | 1 | 0.71mi |
| 6508 Wilty St Metairie, LA | 3.0 | 2.0 | 1300 | $2,000 | $1.54 | 25d | 1 | 0.72mi |
| 6301 Wilty St Metairie, LA | 3.0 | 2.0 | 1340 | $2,000 | $1.49 | 5d | 1 | 0.72mi |
| 2 Schill Ave Kenner, LA | 4.0 | 2.0 | 2026 | $2,500 | $1.23 | 6d | 1 | 0.78mi |
| 7116 Wilty St Metairie, LA | 3.0 | 2.0 | 1722 | $2,300 | $1.34 | 6d | 1 | 0.78mi |
| 6501 Ithaca St Metairie, LA | 3.0 | 2.0 | 2400 | $2,900 | $1.21 | 45d | 1 | 0.85mi |
| 13 Emile Ave Kenner, LA | 3.0 | 3.0 | 2100 | $2,300 | $1.10 | 25d | 1 | 0.89mi |
| 4409 Saint Martin St Metairie, LA | 3.0 | 2.0 | 1576 | $2,100 | $1.33 | 45d | 1 | 0.97mi |
| 4112 Henican Pl Metairie, LA | 3.0 | 2.0 | 1750 | $2,000 | $1.14 | 25d | 1 | 0.98mi |
| 3224 Massachusetts Ave Kenner, LA | 4.0 | 2.0 | 2070 | $2,750 | $1.33 | 3d | 1 | 1.00mi |
| 4416 Barnett St Unit B Metairie, LA | 3.0 | 3.5 | 1700 | $2,000 | $1.18 | 23d | 1 | 1.08mi |
| 6217 Leslie St Metairie, LA | 3.0 | 1.0 | 1300 | $1,800 | $1.38 | 46d | 1 | 1.09mi |
| 4404 Barnett St Unit C Metairie, LA | 3.0 | 3.5 | 1700 | $2,100 | $1.24 | 25d | 1 | 1.10mi |
| 5104 W Esplanade Ave Metairie, LA | 3.0 | 2.0 | 1455 | $1,675 | $1.15 | 45d | 1 | 1.12mi |
| 53 Antigua Dr Unit D Kenner, LA | 2.0 | 1.5 | 1325 | $1,500 | $1.13 | 25d | 1 | 1.13mi |
| 61 Emile Ave Kenner, LA | 3.0 | 2.0 | 1450 | $1,900 | $1.31 | 46d | 1 | 1.14mi |
| 3908 Page Dr Metairie, LA | 3.0 | 1.5 | 1470 | $1,850 | $1.26 | 46d | 1 | 1.17mi |
| 4245 Illinois Ave Kenner, LA | 3.0 | 2.0 | 1720 | $2,300 | $1.34 | 45d | 1 | 1.23mi |
| 2150 42nd St Unit D226 Kenner, LA | 2.0 | 2.0 | 1612 | $1,820 | $1.13 | 25d | 1 | 1.28mi |
| 3245 Iowa Ave Kenner, LA | 4.0 | 2.0 | 1800 | $2,300 | $1.28 | 23d | 1 | 1.30mi |
| 4422 Lake Vista Dr Metairie, LA | 2.0 | 2.5 | 2500 | $2,900 | $1.16 | 25d | 1 | 1.38mi |
| 4401 Sonfield St Unit D Metairie, LA | 3.0 | 3.0 | 1300 | $1,500 | $1.15 | 45d | 1 | 1.38mi |
| 4401 Sonfield St Unit C Metairie, LA | 4.0 | 3.0 | 1300 | $1,800 | $1.38 | 45d | 1 | 1.38mi |
| 3101 Kansas Ave Kenner, LA | 3.0 | 2.0 | 1500 | $2,000 | $1.33 | 16d | 1 | 1.41mi |
| 6801 Veterans Blvd Metairie, LA | 1.0–3.0 | 1.0–2.0 | 985 | $1,701 | $1.73 | 3d | 27 | 1.45mi |
Listing history 19 events
-
2026-06-21days on market $299,000 Active 116 DOM
-
2026-06-18days on market $299,000 Active 113 DOM
-
2026-06-17days on market $299,000 Active 112 DOM
-
2026-06-16days on market $299,000 Active 111 DOM
-
2026-06-15days on market $299,000 Active 110 DOM
-
2026-06-13days on market $299,000 Active 108 DOM
-
2026-06-10days on market $299,000 Active 105 DOM
-
2026-06-09days on market $299,000 Active 104 DOM
-
2026-06-08days on market $299,000 Active 103 DOM
-
2026-06-07days on market $299,000 Active 102 DOM
-
2026-06-03days on market $299,000 Active 98 DOM
-
2026-06-02days on market $299,000 Active 97 DOM
-
2026-06-01days on market $299,000 Active 96 DOM
-
2026-05-31days on market $299,000 Active 95 DOM
-
2026-04-27price $299,000 258-char remark
Show marketing remark (258 chars)
Tradtional spacious floor plan, all brick in comfortable neighborhood, living/dining or 2nd den with extra wide kitchen and breakfast area that opens to den. All bedrooms have large closets, covered patio and garage, well maintained and no carpet throughout.
-
2026-02-24$330,000 Active 258-char remark
Show marketing remark (258 chars)
Tradtional spacious floor plan, all brick in comfortable neighborhood, living/dining or 2nd den with extra wide kitchen and breakfast area that opens to den. All bedrooms have large closets, covered patio and garage, well maintained and no carpet throughout.
-
1979-06-01soldstatus $77,000
ⓘ Source: listings_history table (triggers on properties + properties_extension) + one-shot
backfill from property_details.listing_events for pre-trigger history.
Tax reassessment forecast LA · Resets to sale price
- Current annual tax
- $2,520 · $210/mo
- Projected year-2 tax
- $2,520 · $210/mo
- Expected delta
- $0/yr ($0/mo · 0.0%)
ⓘ Screening estimate from a state-policy table — verify with the county assessor before closing.
Climate risk First Street
- Flood 8/10 Severe FEMA zone X · 60% chance over 30 yrs
- Wildfire 1/10 Low
- Heat 10/10 Extreme 7 d/yr ≥108°F today · 21 d/yr by 30 yrs out
- Wind 10/10 Extreme 99% chance of damaging wind over 30 yrs
- Air quality 3/10 Moderate 2 unhealthy d/yr today · 3 by 30 yrs out
Nearby sold comps map
Loading sold comps map…
Walkable amenities ~0.75 mi
Loading nearby amenities…
Taxation est. · year 1
- Rental income
- $27,173
- − Mortgage interest
- −$16,749
- − Property taxes
- −$2,520
- − Insurance
- −$2,292
- − Repairs & maintenance
- −$2,174
- − Management
- −$2,174
- − Depreciation
- −$8,698
- Taxable loss
- −$7,435
- Est. tax savings @ 24.0%
- +$1,784
- After-tax cash flow
- $-378/yr
For passive investors: Depreciation is non-cash, so a rental often shows a tax loss while cash-flowing — sheltering income. Rental losses are passive: they offset passive income freely, and up to $25,000/yr can offset ordinary (W-2) income if you actively participate and your MAGI is under $100k (phasing out to $0 by $150k); unused losses carry forward. On sale, claimed depreciation is recaptured at up to 25%, and gains may owe capital-gains tax (a 1031 exchange can defer both). Figures are a year-1 estimate at your 24.0% rate — not tax advice; consult a CPA.
Schools (NCES district)
- District
- Jefferson Parish
- NCES district ID
- 2200840
- Math proficiency
- 24% ▼ -36.00%
- Reading proficiency
- 34% ▼ -30.00%
- Median HH income
- $48,421
- Composite
- 25.19/100
- National rank
- #7511
- State rank
- #44 of 98 in LA
Livability — Metairie
- Score
- 87/100
- State rank
- #1
- US rank
- #261
Category grades
Schools grade is shown separately in the Schools card above.
Census & demographics
- Census place
- Metairie, LA
- County
- Jefferson Parish · 426,999 people
- City population
- 137,978
- Metro
- New Orleans-Metairie, LA
- Population (ZIP)
- 39,344
- Household income
- $76,261
- Rent vs Own
- Severe rent burden
- 710.0
Population outlook (Jefferson County) Hauer SSP2
- Today (2025)
- 451,696 people
- By 2030
- 455,451 · +0.8%
- By 2040
- 458,308 · +1.5%
- By 2050
- 461,031 · +2.1%
- By 2075
- 476,351 · +5.5%
- By 2100
- 499,377 · +10.6%
Race, ethnicity, and origin ACS 2023
- Neighborhood character
- Predominantly White (65%)
- Race & ethnicity
- White 65% Hispanic / Latino 19% Two or more races 12% Black 8% Asian 5%
- Hispanic origin (detail)
- Mexican 3% Cuban 1%
- Common ancestry
- Lithuanian 12% Scotch-Irish 1% Slovak 1%
- Foreign-born
- 14% · Canada, Vietnam, China
- Languages at home
- 81% English-only · Spanish 12% Other Indo-European 3% Arabic 1%
Political lean MEDSL · Jefferson
- 2024 margin
- R (+12.9) · D 42.5% · R 55.5% · Other 2.1%
- 2008→2024 swing
- +13.6pp toward D · 2008: -26.6pp · 2024: -12.9pp
- All cycles
- 2024: R+12.9 2020: R+11.1 2016: R+14.8 2012: R+18.4 2008: R+26.6
Not yet ingested
- Civics
- —
Market trends
- HPI YoY
- ▼ -252.03%
- Current HPI
- 138.5632
- Rent YoY
- ▲ 2.15%
- Metro
- New Orleans-Metairie, LA
- State GDP YoY
- ▲ 3.29%
- F500 in state
- 10
Industry mix (Fortune 500 HQ in LA)
| Industry | F500 HQs | Revenue |
|---|---|---|
| Telecommunications | 2 | $23B |
|
||
| Utilities | 1 | $12B |
|
||
| Wholesale / Distribution | 1 | $5B |
|
||
| Advertising | 1 | $2B |
|
||
Price history
+288.3% since first listed5 events — show timeline
- 2026-04-27 Price Changed $299,000 AcadianaMLS
- 2026-04-27 Price Changed $299,000 GSREIN
- 2026-02-24 Listed $330,000 GSREIN
- 2026-02-24 Listed $330,000 AcadianaMLS
- 1979-06-01 Sold (Public Records) $77,000 Public Records
Property tax history
+1.8%/yrLatest (2025): $2,520 · +0.2% YoY. Source: county tax records.
Cash-flow waterfall
monthlySold comps — $/sqft
last 12 mo · ≤1 miLoading sold comps…