 🏷️ Likely Rental
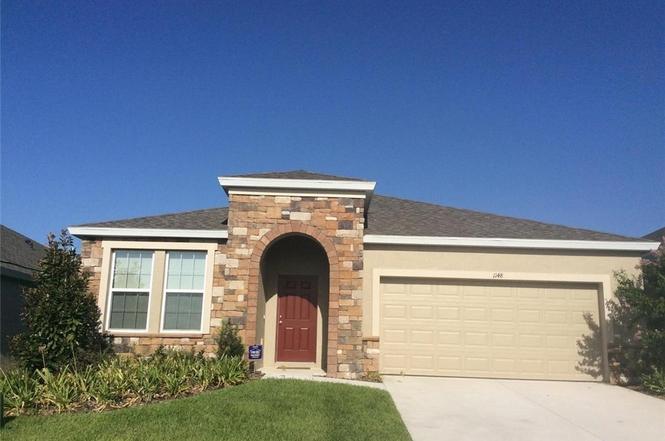
1148 Grand Hilltop Dr · South Apopka, FL
Flood risk 1/10 · Minimal
- FEMA flood zone
- X (unshaded)
- Chance of flooding over 30 yrs
- 0.0%
- Est. flood insurance / yr
- $507 – $1,088
Fire risk 4/10 · Minor
- Est. fire insurance / yr
- $947 – $1,759
Heat risk 9/10 · Severe
- Hot days now (above 108°F)
- 7 days/yr
- Hot days in 30 yrs
- 24 days/yr
Wind risk 9/10 · Severe
- Chance of severe wind over 30 yrs
- 99.0%
Air-quality risk 1/10 · Minimal
- Unhealthy air days now
- 0 days/yr
- Unhealthy air days in 30 yrs
- 0 days/yr
Risk factors via First Street. Map © Google.
Why this score? — see what drove the D grade
The composite is a weighted blend of 9 inputs, each scored 0–100. Each bar is that input's sub-score; the figure is the points it added to the 100-point composite (weight × sub-score).
- Cash flow +15.0/30.0
- ARV discount +7.5/15.0
- 1% rule +5.0/10.0
- DSCR +5.0/10.0
- Schools +4.1/10.0
- Livability +3.4/5.0
- Condition / age +2.5/5.0
- Rent growth +1.8/5.0
- Appreciation +0.0/10.0
$5,000
🖨 Deal sheet 📄 Offer letter ✓ Due diligence
Listing remarks MLS
For Sold / Data Entry purposes only.
Key facts
- 5,663 sq ft lot
- 2 garage spots
- Built 2016
Property features AI
Exterior
- Parking: - 2-car garage
- Utilities: - Water: Other; - Sewer: Other
- Home design: - Single-family residence; - One level; - Zoning: P-D
- Construction: - Construction details: see remarks
- Exterior features: - Front porch; - Other roof
Interior
- Flooring: - Other flooring
- Bathrooms: - 2 full bathrooms
- Heating & cooling: - No heating; - No cooling
- Interior features: - Other flooring; - Total of 1 room
Neighborhood map
What this means for you Summary
Snapshot
- This is a 3-bed/2.0-bath single-family listed at $5k.
Deal economics
- At list price, monthly cash flow is $2k ($24k/yr) — positive.
- The deal already cash-flows at list — no discount required.
- Meets the 1% rule at list price ($3k rent vs $5k).
Location & tenants
- Location reads 67/100 on livability (#578 in FL) — a middle-class / working-renter tenant base. Strengths: commute A+, cost of living A+, housing A+; Watch: schools F, amenities F, employment F.
- Orange (suburban): math 46% / reading 51% proficiency, ranked #43 of 73 in FL (top 59%) — families likely to look elsewhere, expect single-tenant / working-renter base with shorter leases.
- Market conditions: Rents soft (-2.8%/yr); 564 active listings in the ZIP; 20 comparable units currently listed for rent nearby; rentals at typical pace (median 15d on market — plan ~3-4 weeks tenant-placement turnaround); 8,053 units permitted in Orange County in 2024 (3,133 in 5+ unit buildings).
- This rent runs 43% of the median local income ($73k/yr) — at the standard rent-burdened threshold; future hikes will face affordability resistance.
Forward outlook
- Local home prices are declining (-3.0%/yr); year-one equity from $35 of loan paydown is wiped out by about $150 of value loss. Plan a longer hold.
- Orange County population projected at +52% by 2050 — long-run rental-demand tailwind backs the buy-and-hold thesis.
- At projected returns (-3.0% appreciation + 0.0% rent growth), your $1k cash investment doubles in ~1 year — after that, you're playing with house money.
Negotiation context
- Only 3 days on market — expect competitive offers; lowballing is unlikely to land.
- 2 sale attempts since 10y ago with the ask held roughly flat each time — persistent listings suggest the price (not the market) is what's stuck; bring a comps-based counter.
Risks & watch-outs
- Climate carrying-cost: severe wind risk, 99% chance of damaging wind over 30y; extreme-heat days projected 7→24/yr by 2055 (HVAC capex compounding) — expect insurance premiums to compound above CPI over the hold.
Questions for the listing agent
- Is there a deadline driving the sale (1031 exchange, divorce, estate, relocation)? That informs how much negotiation room exists.
- Schools are F-rated, which usually means shorter tenancies and higher turnover. Who's the typical renter profile here, and what's been the actual vacancy rate?
- The area grade is low — what's the realistic commute time and amenity access for the typical tenant pool here? Any planned neighborhood developments (good or bad) we should know about?
- What's the average days-on-market for RENTAL listings here right now (not sales)? A rising rental-DOM trend means longer vacancies and softer asking-rent achievability than the comps imply.
- What's the recent tenant-quality profile in this submarket — average credit score on applications, eviction rate, late-payment / NSF rate, and stable-employment percentage? A property-management company in the area should have these aggregated.
- How much new for-sale + rental construction is in the pipeline within 1–3 miles? Heavy new supply typically softens prices + rents 12–24 months out; constrained supply supports both.
Investment metrics
- 1% rule
- 51.87% ✓
- Cap rate
- 489.69%
- Cash-on-cash
- 1726.40%
- DSCR
- 77.82
- GRM
- 0.2
CMA / ARV
- ARV (on-the-fly)
- $419,060
- Comps found
- 1
Show comp detail 1 sale within ~0.75 mi
| Address | Dist | Beds/Ba | Sqft | Sold | Price | $/sf | Match |
|---|---|---|---|---|---|---|---|
| 983 Karst Tree Ln | 0.30mi | 3/2.0 | 1,805 (-1%) | 1mo | $415,000 | $230 | 84 |
Match score weights: distance 35% · size 25% · config 20% · recency 20%. Top-matched comps best support the ARV.
Projected returns pro-forma
-3.0% appreciation · 0.0% rent growth · sell at horizon
- IRR
- —
- Equity multiple
- 86.65×
- Total profit
- $119,911
- Equity at exit
- $746
- IRR
- —
- Equity multiple
- 172.71×
- Total profit
- $240,387
- Equity at exit
- $432
Cash invested: $1,400 (down + closing). Projections, not guarantees.
Landlord ↔ Tenant lean methodology
- Overall (STATE)
- 87 Strongly Landlord-Friendly
- State Florida
- 87 Strongly Landlord-Friendly · R+3
- County
- — inherits STATE
- City
- — inherits STATE
ZIP-level market 32703
- Rents YoY
- -2.8%
- Active inventory
- 564
- Price-to-rent
- 0.2×
Monthly cashflow live
- Estimated rent
- $2,593 high interval (Pro) →
- Mortgage (P&I)
- −$26
- Tax est. 1.5%
- −$6 /mo · $75/yr
- Insurance
- −$2
- HOA
- −$0
- Vacancy / Maint / Mgmt
- −$545
- Net cashflow
- $2,014
Break-even live
UW: 25.0% down · 7.5% · 30yr · 1.5% tax · 5.0% vac · 8.0% maint · 8.0% mgmt
Financing live
Cash to close
- Down payment
- $1,250
- Closing costs
- $150
- Reserves months
- —
- Total cash needed
- —
Loan-product check · same deal, 3 products live
Conventional
25% down · 7.5% · 30yr
- Down + closing
- —
- Monthly P&I
- —
- Monthly cashflow
- —
- DSCR
- —
- Eligible?
- —
Personal DTI + credit; lowest rate.
DSCR
20% down · 8.5% · 30yr
- Down + closing
- —
- Monthly P&I
- —
- Monthly cashflow
- —
- DSCR
- —
- Eligible?
- —
No personal income docs; deal must DSCR.
Hard money
10% down · 12.0% · 12mo
- Down + closing
- —
- Monthly P&I
- —
- Monthly cashflow
- —
- DSCR
- —
- Eligible?
- —
Short-term bridge; refi at stabilization.
Rent comps 20 comps
| Address | Beds | Baths | Sqft | Rent | $/sqft | DOM | Units | Dist |
|---|---|---|---|---|---|---|---|---|
| 959 Maypole Dr Apopka, FL | 3.0 | 3.0 | 2352 | $2,850 | $1.21 | 23d | 1 | 0.17mi |
| 827 Creeping Fig St Unit 1 Apopka, FL | 3.0 | 2.5 | 1688 | $2,895 | $1.72 | 21d | 1 | 0.47mi |
| 1595 Marden Rdg Lp Apopka, FL | 1.0–3.0 | 1.0–2.0 | 1055 | $2,195 | $2.08 | 2d | 44 | 0.53mi |
| 342 Lady Palm St Apopka, FL | 3.0 | 2.5 | 2147 | $2,700 | $1.26 | 7d | 1 | 0.58mi |
| 1250 Marden Rd Apopka, FL | 1.0–3.0 | 1.0–2.0 | 1089 | $2,895 | $2.66 | 2d | 26 | 0.59mi |
| 1500 Silver Lining Way Apopka, FL | 4.0 | 3.0 | 1825 | $2,350 | $1.29 | 20d | 1 | 0.61mi |
| 402 W 17th St Apopka, FL | 4.0 | 2.0 | 1380 | $1,950 | $1.41 | 23d | 1 | 0.78mi |
| 1672 Rider Rain Ln Apopka, FL | 4.0 | 2.0 | 2300 | $2,995 | $1.30 | 14d | 1 | 1.12mi |
| 1660 Crowncrest Dr Apopka, FL | 3.0 | 2.5 | 1857 | $2,500 | $1.35 | 23d | 1 | 1.18mi |
| 1353 Clarcona Rd Apopka, FL | 4.0 | 2.0 | 1530 | $2,275 | $1.49 | 14d | 1 | 1.24mi |
| 50 W 12th St Apopka, FL | 4.0 | 2.0 | 1437 | $2,300 | $1.60 | 14d | 1 | 1.25mi |
| 40 W 12th St Apopka, FL | 4.0 | 2.0 | 1437 | $2,899 | $2.02 | 21d | 1 | 1.27mi |
| 1979 Rider Rain Ln Apopka, FL | 4.0 | 3.0 | 2401 | $2,895 | $1.21 | 11d | 1 | 1.33mi |
| 3030 Ascend Oak St Apopka, FL | 1.0–3.0 | 1.0–2.0 | 1172 | $2,375 | $2.03 | 2d | 28 | 1.35mi |
| 2575 Rider Rain Ln Apopka, FL | 4.0 | 3.0 | 2023 | $2,725 | $1.35 | 3d | 1 | 1.36mi |
| 2557 Rider Rain Ln Apopka, FL | 3.0 | 2.5 | 1795 | $2,590 | $1.44 | 10d | 1 | 1.38mi |
| 2080 Rider Rain Ln Apopka, FL | 4.0 | 3.0 | 2030 | $2,699 | $1.33 | 16d | 1 | 1.38mi |
| 2101 Lakeview Ridge Cir Apopka, FL | 1.0–3.0 | 1.0–2.0 | 1032 | $2,067 | $2.00 | 1d | 8 | 1.40mi |
| 2132 Rider Rain Ln Apopka, FL | 4.0 | 2.5 | 2000 | $2,600 | $1.30 | 17d | 1 | 1.42mi |
| 2140 Rider Rain Ln Apopka, FL | 4.0 | 2.5 | 2000 | $2,600 | $1.30 | 4d | 1 | 1.42mi |
Listing history 4 events
-
2026-06-18days on market $5,000 Active 3 DOM
-
2026-06-17days on market $5,000 Active 2 DOM
-
2026-06-15remarks 294-char remark
-
2026-06-15$5,000 Active 1 DOM
ⓘ Source: listings_history table (triggers on properties + properties_extension) + one-shot
backfill from property_details.listing_events for pre-trigger history.
Climate risk First Street
- Flood 1/10 Low FEMA zone X (unshaded) · 0% chance over 30 yrs
- Wildfire 4/10 Moderate
- Heat 9/10 Extreme 7 d/yr ≥108°F today · 24 d/yr by 30 yrs out
- Wind 9/10 Extreme 99% chance of damaging wind over 30 yrs
- Air quality 1/10 Low 0 unhealthy d/yr today · 0 by 30 yrs out
Nearby sold comps map
Loading sold comps map…
Walkable amenities ~0.75 mi
Loading nearby amenities…
Taxation est. · year 1
- Rental income
- $31,119
- − Mortgage interest
- −$280
- − Property taxes
- −$75
- − Insurance
- −$25
- − Repairs & maintenance
- −$2,490
- − Management
- −$2,490
- − Depreciation
- −$145
- Taxable income
- $25,615
- Est. tax owed @ 24.0%
- −$6,148
- After-tax cash flow
- $18,022/yr
For passive investors: Depreciation is non-cash, so a rental often shows a tax loss while cash-flowing — sheltering income. Rental losses are passive: they offset passive income freely, and up to $25,000/yr can offset ordinary (W-2) income if you actively participate and your MAGI is under $100k (phasing out to $0 by $150k); unused losses carry forward. On sale, claimed depreciation is recaptured at up to 25%, and gains may owe capital-gains tax (a 1031 exchange can defer both). Figures are a year-1 estimate at your 24.0% rate — not tax advice; consult a CPA.
Schools (NCES district)
- District
- Orange
- NCES district ID
- 1201440
- Math proficiency
- 46% ▼ -9.00%
- Reading proficiency
- 51% ▼ -2.00%
- Median HH income
- $49,350
- Composite
- 41.47/100
- National rank
- #3461
- State rank
- #43 of 73 in FL
Livability — South Apopka
- Score
- 67/100
- State rank
- #578
- US rank
- #10996
Category grades
Schools grade is shown separately in the Schools card above.
Census & demographics
- Census place
- South Apopka, FL
- County
- Orange County · 1,471,359 people
- Metro
- Orlando-Kissimmee-Sanford, FL
- Population (ZIP)
- 59,269
- Household income
- $72,880
- Rent vs Own
- Severe rent burden
- 2191.0
Population outlook (Orange County) Hauer SSP2
- Today (2025)
- 1,618,226 people
- By 2030
- 1,787,404 · +10.5%
- By 2040
- 2,125,621 · +31.4%
- By 2050
- 2,454,016 · +51.6%
- By 2075
- 3,173,711 · +96.1%
- By 2100
- 3,607,781 · +122.9%
Race, ethnicity, and origin ACS 2023
- Neighborhood character
- Highly diverse neighborhood (Simpson 0.71)
- Race & ethnicity
- White 35% Hispanic / Latino 30% Black 28% Two or more races 16% Asian 3%
- Hispanic origin (detail)
- Mexican 6% Puerto Rican 12% Cuban 3% Dominican 2%
- Common ancestry
- Hispanic 4% Romanian 1% Italian 1%
- Foreign-born
- 18% · Canada, Jamaica, Vietnam
- Languages at home
- 71% English-only · Spanish 22% French/Haitian/Cajun 3% Other Indo-European 1%
Political lean MEDSL · Orange
- 2024 margin
- D (+13.6) · D 56.1% · R 42.5% · Other 1.3%
- 2008→2024 swing
- -5.0pp toward R · 2008: 18.6pp · 2024: 13.6pp
- All cycles
- 2024: D+13.6 2020: D+23.1 2016: D+24.6 2012: D+18.2 2008: D+18.6
Not yet ingested
- Civics
- —
Market trends
- HPI YoY
- ▼ -206.30%
- Current HPI
- 319.2139
- Rent YoY
- ▼ -2.75%
- Metro
- Orlando-Kissimmee-Sanford, FL
- State GDP YoY
- ▲ 3.28%
- F500 in state
- 36
Industry mix (Fortune 500 HQ in FL)
| Industry | F500 HQs | Revenue |
|---|---|---|
| Industrial Technology | 2 | $29B |
|
||
| Insurance | 2 | $17B |
|
||
| Retail | 1 | $60B |
|
||
| Technology Distribution | 1 | $58B |
|
||
| Homebuilding | 1 | $35B |
|
||
| Technology Manufacturing | 1 | $35B |
|
||
Price history
-97.8% since first listed4 events — show timeline
- 2026-06-15 Listed $5,000 HAOR as distributed by MLS GRID
- 2016-03-31 Listing Removed — Stellar MLS as Distributed by MLS Grid
- 2016-03-31 Listed $225,349 Stellar MLS as Distributed by MLS Grid
- 2016-03-29 Sold (MLS) $225,349 Stellar MLS as Distributed by MLS Grid
Property tax history
+31.8%/yrLatest (2025): $3,761 · +5.5% YoY. Source: county tax records.
Cash-flow waterfall
monthlySold comps — $/sqft
last 12 mo · ≤1 miLoading sold comps…