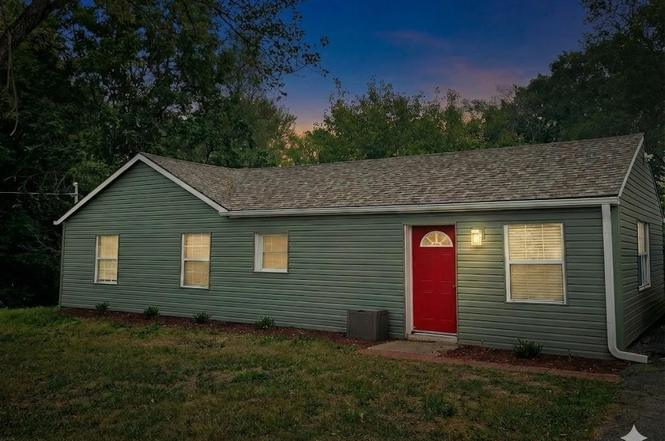
701 N Allen Rd · Independence, MO
Flood risk 1/10 · Minimal
- FEMA flood zone
- X (unshaded)
- Chance of flooding over 30 yrs
- 0.0%
- Est. flood insurance / yr
- $473 – $860
Fire risk 1/10 · Minimal
- Est. fire insurance / yr
- $1,054 – $1,958
Heat risk 4/10 · Minor
- Hot days now (above 107°F)
- 7 days/yr
- Hot days in 30 yrs
- 15 days/yr
Wind risk 2/10 · Minimal
- Chance of severe wind over 30 yrs
- —
Air-quality risk 3/10 · Minor
- Unhealthy air days now
- 3 days/yr
- Unhealthy air days in 30 yrs
- 3 days/yr
Risk factors via First Street. Map © Google.
Why this score? — see what drove the C- grade
The composite is a weighted blend of 9 inputs, each scored 0–100. Each bar is that input's sub-score; the figure is the points it added to the 100-point composite (weight × sub-score).
- Cash flow +18.0/30.0
- ARV discount +13.9/15.0
- DSCR +5.7/10.0
- 1% rule +4.2/10.0
- Livability +4.1/5.0
- Rent growth +3.4/5.0
- Schools +3.0/10.0
- Condition / age +2.5/5.0
- Appreciation +0.0/10.0
$184,900
🖨 Deal sheet 📄 Offer letter ✓ Due diligence
Listing remarks
Modern Ranch with Interior and Exterior Renovation - 3 Bedrooms and 2 Bathrooms on 0.65 Acres This move in ready ranch combines modern updates with mechanical reliability. Situated on an oversized lot, the home has undergone a thorough interior and exterior refresh that offers rare acreage with contemporary style. The living space features a neutral palette with new padded luxury vinyl plank flooring, new plush carpeting, new brushed nickel hardware, and updated lighting throughout. The kitchen includes stainless steel appliances and ample cabinetry for easy organization. Both bathrooms feature spa inspired dual shower heads while the primary suite includes new tile work and brushed nick
Key facts
- 0.63 acre lot
- Built 1939
- Listed 42 days
Property features AI
Finance
- Other: Living area approximately 1,120 (assessor); Below-grade finished area reported as estimated; Not in flood plain; Lot size ~27,378 square feet
Exterior
- Parking: Off-street parking
- Utilities: Public water; Septic tank
- Home design: Single family residence (ranch floor plan); Residential property
- Construction: Vinyl siding; Composition roof
- Exterior features: Acreage lot
Interior
- Bedrooms: 3 bedrooms, all on the first floor with carpet
- Flooring: Carpet in all bedrooms
- Bathrooms: 2 full bathrooms, both on the first floor
- Heating & cooling: Natural gas heating; Electric cooling
- Interior features: Ceiling fans; Walk-in closet(s)
- Laundry & utility: Utility room on the first floor; Basement includes sump pump and walk-out access
Neighborhood map
What this means for you Summary
Snapshot
- This is a 4-bed/2.0-bath single-family listed at $185k.
Deal economics
- At list price, monthly cash flow is $161 ($2k/yr) — positive.
- The deal already cash-flows at list — no discount required.
- To meet the 1% rule (rent ≥ 1% of price), the offer needs to be $170k (8.0% below list).
- Recommended offer: $170k (8.0% below list) — sets the bar for 1% rule.
- Cap rate 7.3% vs local median 5.0% in Independence — top-decile yield for the area; either an underpriced asset or a hidden risk that comps aren't pricing in. Stress-test before assuming the spread holds.
Location & tenants
- Location reads 82/100 on livability (#10 in MO, #1,296 nationally) — a professional / high-income tenant draw. Strengths: amenities A+, commute A+, cost of living A+; Watch: schools C-, employment D+, crime F.
- Fort Osage R-I (rural): math 28% / reading 39% proficiency, ranked #213 of 324 in MO (top 66%) — families likely to look elsewhere, expect single-tenant / working-renter base with shorter leases.
- Market conditions: Rents rising (+3.8%/yr); 125 active listings in the ZIP; 5 comparable units currently listed for rent nearby; rentals leasing fast (median 2d on market — plan ~1-2 weeks tenant-placement turnaround); 4,002 units permitted in Jackson County in 2024 (2,271 in 5+ unit buildings).
- This rent runs 42% of the median local income ($49k/yr) — at the standard rent-burdened threshold; future hikes will face affordability resistance.
Forward outlook
- Local home prices are declining (-3.0%/yr); year-one equity from $1k of loan paydown is wiped out by about $6k of value loss. Plan a longer hold.
- Jackson County population projected at +4% by 2050 — modest demand growth; plan on rents tracking national, not racing it.
Negotiation context
- It's been on market 42 days — a 3% lower offer ($179k) is reasonable based on typical stale-listing flexibility.
- 7 sale attempts since 21y ago with the ask held roughly flat each time — persistent listings suggest the price (not the market) is what's stuck; bring a comps-based counter.
Risks & watch-outs
- Watch-outs: built in 1939 — expect roof / HVAC / electrical / plumbing capex.
Questions for the listing agent
- It's been on market 42 days. Have you received any prior offers? Is the seller open to a 8% concession, seller financing, or rate buy-down credit?
- Built in 1939 — when were the roof, HVAC, electrical panel, plumbing, and water heater last replaced?
- Is there a deadline driving the sale (1031 exchange, divorce, estate, relocation)? That informs how much negotiation room exists.
- Crime grade is F in this area — have there been break-ins, vandalism, or insurance claims at this property in the last 3 years? What carrier currently insures it and at what premium?
- What's the average days-on-market for RENTAL listings here right now (not sales)? A rising rental-DOM trend means longer vacancies and softer asking-rent achievability than the comps imply.
- What's the recent tenant-quality profile in this submarket — average credit score on applications, eviction rate, late-payment / NSF rate, and stable-employment percentage? A property-management company in the area should have these aggregated.
- How much new for-sale + rental construction is in the pipeline within 1–3 miles? Heavy new supply typically softens prices + rents 12–24 months out; constrained supply supports both.
Investment metrics
- 1% rule
- 0.92% ✗
- Cap rate
- 7.34%
- Cash-on-cash
- 3.72%
- DSCR
- 1.17
- GRM
- 9.1
CMA / ARV
- ARV (median comp)
- $215,508
- List price
- $184,900
- Delta
- -14.20%
- Verdict
- UNDERPRICED
- Comps
- 20 within 1.0 mi
Show comp detail 6 sales within ~0.75 mi
| Address | Dist | Beds/Ba | Sqft | Sold | Price | $/sf | Match |
|---|---|---|---|---|---|---|---|
| 16104 E Cogan Ln | 0.33mi | 3/2.0 (-1) | 1,162 (+4%) | 8mo | $255,000 | $219 | 67 |
| 103 N Cogan Ln | 0.66mi | 3/1.5 (-1) | 1,104 (-1%) | 16mo | $102,960 | $93 | 46 |
| 1609 N Howard Dr | 0.71mi | 3/1.5 (-1) | 1,002 (-10%) | 7mo | $210,000 | $210 | 37 |
| 14806 E Mayes Rd | 0.63mi | 3/2.0 (-1) | 1,027 (-8%) | 20mo | $200,000 | $195 | 35 |
| 124 N Peck Dr | 0.74mi | 4/1.0 | 1,248 (+11%) | 12mo | $149,000 | $119 | 32 |
| 105 S Ward Rd | 0.72mi | 3/1.0 (-1) | 1,040 (-7%) | 22mo | $170,000 | $163 | 27 |
Match score weights: distance 35% · size 25% · config 20% · recency 20%. Top-matched comps best support the ARV.
Projected returns pro-forma
-3.0% appreciation · 3.79% rent growth · sell at horizon
- IRR
- -9.6%
- Equity multiple
- 0.64×
- Total profit
- $-18,398
- Equity at exit
- $27,569
- IRR
- 0.7%
- Equity multiple
- 1.05×
- Total profit
- $2,709
- Equity at exit
- $15,987
Cash invested: $51,772 (down + closing). Projections, not guarantees.
Landlord ↔ Tenant lean methodology
- Overall (STATE)
- 81 Strongly Landlord-Friendly
- State Missouri
- 81 Strongly Landlord-Friendly · R+10
- County
- — inherits STATE
- City
- — inherits STATE
ZIP-level market 64050
- Home prices YoY
- -15.5%
- Rents YoY
- 3.8%
- Active inventory
- 125
- Price-to-rent
- 9.1×
Monthly cashflow live
- Estimated rent
- $1,701 high interval (Pro) →
- Mortgage (P&I)
- −$970
- Tax from tax record
- −$137 /mo · $1,640/yr
- Insurance
- −$77
- HOA
- −$0
- Vacancy / Maint / Mgmt
- −$357
- Net cashflow
- $161
Break-even live
UW: 25.0% down · 7.5% · 30yr · 1.5% tax · 5.0% vac · 8.0% maint · 8.0% mgmt
Financing live
Cash to close
- Down payment
- $46,225
- Closing costs
- $5,547
- Reserves months
- —
- Total cash needed
- —
Loan-product check · same deal, 3 products live
Conventional
25% down · 7.5% · 30yr
- Down + closing
- —
- Monthly P&I
- —
- Monthly cashflow
- —
- DSCR
- —
- Eligible?
- —
Personal DTI + credit; lowest rate.
DSCR
20% down · 8.5% · 30yr
- Down + closing
- —
- Monthly P&I
- —
- Monthly cashflow
- —
- DSCR
- —
- Eligible?
- —
No personal income docs; deal must DSCR.
Hard money
10% down · 12.0% · 12mo
- Down + closing
- —
- Monthly P&I
- —
- Monthly cashflow
- —
- DSCR
- —
- Eligible?
- —
Short-term bridge; refi at stabilization.
Rent comps 5 comps
| Address | Beds | Baths | Sqft | Rent | $/sqft | DOM | Units | Dist |
|---|---|---|---|---|---|---|---|---|
| 16005 E Cogan Ln Independence, MO | 4.0 | 2.0 | 1080 | $1,851 | $1.71 | 1d | 1 | 0.34mi |
| 17004 E 3rd Ter N Independence, MO | 3.0 | 1.5 | 1486 | $1,495 | $1.01 | 1d | 1 | 0.90mi |
| 111 N Gilbert St Independence, MO | 3.0 | 1.0 | 1328 | $1,511 | $1.14 | 1d | 1 | 0.98mi |
| 1021 N Kiger Rd Independence, MO | 3.0 | 2.0 | 1200 | $1,500 | $1.25 | 17d | 1 | 1.16mi |
| 1612 N Dodgion Ave Independence, MO | 3.0 | 1.0 | 1000 | $1,345 | $1.34 | 43d | 1 | 1.26mi |
Listing history 35 events
-
2026-06-17status $184,900 Pending 42 DOM
-
2026-06-17days on market $184,900 Active Under Contract 42 DOM
-
2026-06-16days on market $184,900 Active Under Contract 41 DOM
-
2026-06-15days on market $184,900 Active Under Contract 40 DOM
-
2026-06-13days on market $184,900 Active Under Contract 38 DOM
-
2026-06-09days on market $184,900 Active Under Contract 34 DOM
-
2026-06-08days on market $184,900 Active Under Contract 33 DOM
-
2026-06-07days on market $184,900 Active Under Contract 32 DOM
-
2026-06-03days on market $184,900 Active Under Contract 28 DOM
-
2026-06-02days on market $184,900 Active Under Contract 27 DOM
-
2026-06-01days on market $184,900 Active Under Contract 26 DOM
-
2026-05-31days on market $184,900 Active Under Contract 25 DOM
-
2026-05-14price $184,900 1451-char remark
-
2026-05-07$189,500 Active 1451-char remark
-
2026-05-06historical $189,500 1451-char remark
-
2026-03-06historical
-
2026-02-28status Pending
-
2026-02-26$184,900 Active
-
2026-02-19historical
-
2025-12-29historical
-
2025-12-22status Pending
-
2025-12-21$184,900 Active
-
2025-12-13historical
-
2017-10-20historical
-
2017-08-18historical Contingent - Accepting Backup Offers
-
2017-07-26price $58,500
-
2017-07-26$585,000 Active
-
2010-04-23historical
-
2010-02-22$134,900
-
2008-09-05soldstatus
-
2008-06-24$28,900
-
2006-01-09soldstatus
-
2005-12-06soldstatus
-
2005-08-13$120,000
-
1997-03-19soldstatus
ⓘ Source: listings_history table (triggers on properties + properties_extension) + one-shot
backfill from property_details.listing_events for pre-trigger history.
Tax reassessment forecast MO · Resets to sale price
- Current annual tax
- $1,640 · $137/mo
- Projected year-2 tax
- $1,794 · $149/mo
- Expected delta
- +$153/yr (+$13/mo · 9.3%)
ⓘ Screening estimate from a state-policy table — verify with the county assessor before closing.
Climate risk First Street
- Flood 1/10 Low FEMA zone X (unshaded) · 0% chance over 30 yrs
- Wildfire 1/10 Low
- Heat 4/10 Moderate 7 d/yr ≥107°F today · 15 d/yr by 30 yrs out
- Wind 2/10 Low
- Air quality 3/10 Moderate 3 unhealthy d/yr today · 3 by 30 yrs out
Nearby sold comps map
Loading sold comps map…
Walkable amenities ~0.75 mi
Loading nearby amenities…
Taxation est. · year 1
- Rental income
- $20,416
- − Mortgage interest
- −$10,357
- − Property taxes
- −$1,640
- − Insurance
- −$924
- − Repairs & maintenance
- −$1,633
- − Management
- −$1,633
- − Depreciation
- −$5,379
- Taxable loss
- −$1,152
- Est. tax savings @ 24.0%
- +$276
- After-tax cash flow
- $2,205/yr
For passive investors: Depreciation is non-cash, so a rental often shows a tax loss while cash-flowing — sheltering income. Rental losses are passive: they offset passive income freely, and up to $25,000/yr can offset ordinary (W-2) income if you actively participate and your MAGI is under $100k (phasing out to $0 by $150k); unused losses carry forward. On sale, claimed depreciation is recaptured at up to 25%, and gains may owe capital-gains tax (a 1031 exchange can defer both). Figures are a year-1 estimate at your 24.0% rate — not tax advice; consult a CPA.
Schools (NCES district)
- District
- Fort Osage R-I
- NCES district ID
- 2912290
- Math proficiency
- 28% ▼ -7.00%
- Reading proficiency
- 39% ▼ -5.00%
- Median HH income
- $57,441
- Composite
- 29.78/100
- National rank
- #6428
- State rank
- #213 of 324 in MO
Livability — Independence
- Score
- 82/100
- State rank
- #10
- US rank
- #1296
Category grades
Schools grade is shown separately in the Schools card above.
Census & demographics
- Census place
- Independence, MO
- County
- Jackson County · 687,798 people
- City population
- 117,675
- Metro
- Kansas City, MO-KS
- Population (ZIP)
- 21,079
- Household income
- $48,834
- Rent vs Own
- Severe rent burden
- 972.0
Population outlook (Jackson County) Hauer SSP2
- Today (2025)
- 719,589 people
- By 2030
- 731,456 · +1.6%
- By 2040
- 746,689 · +3.8%
- By 2050
- 749,289 · +4.1%
- By 2075
- 736,227 · +2.3%
- By 2100
- 668,210 · -7.1%
Race, ethnicity, and origin ACS 2023
- Neighborhood character
- Predominantly White (72%)
- Race & ethnicity
- White 72% Hispanic / Latino 11% Two or more races 9% Black 7% Pacific Islander 1%
- Hispanic origin (detail)
- Mexican 8%
- Common ancestry
- Italian 4% Serbian 2% Lithuanian 1%
- Foreign-born
- 5% · Canada
- Languages at home
- 91% English-only · Spanish 7% Other Asian/Pacific 1%
Political lean MEDSL · Jackson
- 2024 margin
- D (+19.3) · D 58.9% · R 39.5% · Other 1.6%
- 2008→2024 swing
- -6.1pp toward R · 2008: 25.4pp · 2024: 19.3pp
- All cycles
- 2024: D+19.3 2020: D+22.0 2016: D+16.6 2012: D+19.0 2008: D+25.4
Not yet ingested
- Civics
- —
Market trends
- HPI YoY
- ▼ -56.24%
- Current HPI
- 305.796
- Rent YoY
- ▲ 3.79%
- Metro
- Kansas City, MO-KS
- State GDP YoY
- ▲ 1.84%
- F500 in state
- 20
Industry mix (Fortune 500 HQ in MO)
| Industry | F500 HQs | Revenue |
|---|---|---|
| Healthcare | 1 | $163B |
|
||
| Insurance | 1 | $21B |
|
||
| Industrial Technology | 1 | $17B |
|
||
| Retail | 1 | $16B |
|
||
| Industrial Distribution | 1 | $10B |
|
||
| Utilities | 1 | $9B |
|
||
Price history
+54.1% since first listed25 events — show timeline
- 2026-06-17 Pending — Heartland MLS as Distributed by MLS Grid
- 2026-05-22 Contingent — Heartland MLS as Distributed by MLS Grid
- 2026-05-14 Price Changed $184,900 Heartland MLS as Distributed by MLS Grid
- 2026-05-07 Listed $189,500 Heartland MLS as Distributed by MLS Grid
- 2026-05-06 Coming Soon $189,500 Heartland MLS as Distributed by MLS Grid
- 2026-03-06 Listing Removed — Heartland MLS as Distributed by MLS Grid
- 2026-02-28 Pending — Heartland MLS as Distributed by MLS Grid
- 2026-02-26 Listed $184,900 Heartland MLS as Distributed by MLS Grid
- 2026-02-19 Coming Soon — Heartland MLS as Distributed by MLS Grid
- 2025-12-29 Listing Removed — Heartland MLS as Distributed by MLS Grid
- 2025-12-22 Pending — Heartland MLS as Distributed by MLS Grid
- 2025-12-21 Listed $184,900 Heartland MLS as Distributed by MLS Grid
- 2025-12-13 Coming Soon — Heartland MLS as Distributed by MLS Grid
- 2017-10-20 Listing Removed — Heartland MLS as Distributed by MLS Grid
- 2017-08-18 Contingent — Heartland MLS as Distributed by MLS Grid
- 2017-07-26 Price Changed $58,500 Heartland MLS as Distributed by MLS Grid
- 2017-07-26 Listed $585,000 Heartland MLS as Distributed by MLS Grid
- 2010-04-23 Listing Removed — Heartland MLS as Distributed by MLS Grid
- 2010-02-22 Listed $134,900 Heartland MLS as Distributed by MLS Grid
- 2008-09-05 Sold (MLS) — Heartland MLS as Distributed by MLS Grid
- 2008-06-24 Listed $28,900 Heartland MLS as Distributed by MLS Grid
- 2006-01-09 Sold (Public Records) — Public Records
- 2005-12-06 Sold (MLS) — Heartland MLS as Distributed by MLS Grid
- 2005-08-13 Listed $120,000 Heartland MLS as Distributed by MLS Grid
- 1997-03-19 Sold (Public Records) — Public Records
Property tax history
+6.2%/yrLatest (2025): $1,640 · -43.3% YoY. Source: county tax records.
Cash-flow waterfall
monthlySold comps — $/sqft
last 12 mo · ≤1 miLoading sold comps…