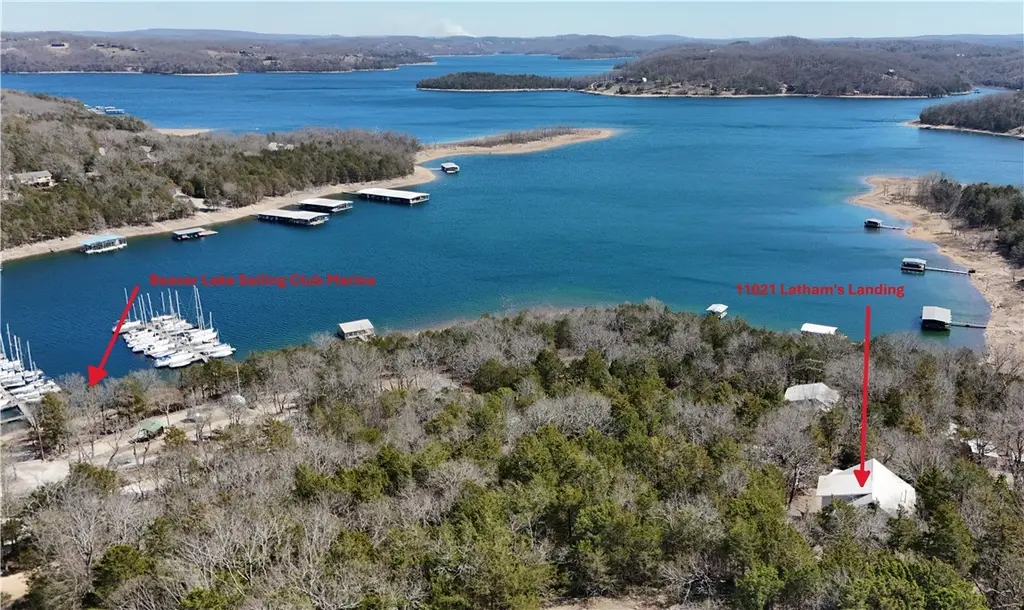
11021 Lathams Landing Rd · Lost Bridge Village, AR
Flood risk 1/10 · Minimal
- FEMA flood zone
- X (unshaded)
- Chance of flooding over 30 yrs
- 0.0%
- Est. flood insurance / yr
- $507 – $1,088
Fire risk 3/10 · Minor
- Est. fire insurance / yr
- $1,499 – $2,785
Heat risk 4/10 · Minor
- Hot days now (above 105°F)
- 7 days/yr
- Hot days in 30 yrs
- 21 days/yr
Wind risk 2/10 · Minimal
- Chance of severe wind over 30 yrs
- 2.0%
Air-quality risk 1/10 · Minimal
- Unhealthy air days now
- 0 days/yr
- Unhealthy air days in 30 yrs
- 0 days/yr
Risk factors via First Street. Map © Google.
Why this score? — see what drove the B grade
The composite is a weighted blend of 9 inputs, each scored 0–100. Each bar is that input's sub-score; the figure is the points it added to the 100-point composite (weight × sub-score).
- Cash flow +23.3/30.0
- ARV discount +15.0/15.0
- Appreciation +8.8/10.0
- DSCR +7.5/10.0
- 1% rule +5.0/10.0
- Schools +3.9/10.0
- Livability +2.9/5.0
- Rent growth +2.5/5.0
- Condition / age +2.5/5.0
$349,500
🖨 Deal sheet (PDF) 📄 Offer letter ✓ Due diligence
Listing remarks
Welcome to a great opportunity to build out your ideal home on Beaver Lake. Situated on 1.12 acres, the house is set into the hillside to take advantage of the lake views. The large wood deck offers a comfortable place to enjoy the surroundings. Main level features an oversized living area with cathedral ceiling, kitchen and dining area, primary suite, and unfinished half bath. Upper level offers two large bedrooms with a shared full bath. Below the main level (Below Grade ADU) is a separate living space with its own kitchen, full bath, and two bunk rooms—well-suited for a rec room or added guest quarters. The home is partially finished and will require completion of items including t
Key facts
- 1.12 acres
- Below grade adu
- Large wood deck
Tags
Property features AI
Finance
- Financial info: Annual tax amount available
- HOA & community: Association fees billed monthly; Community near a lake and close to a state park
Exterior
- Parking: Attached garage with workshop space; 2 covered spaces
- Utilities: Electricity available; Septic available (septic tank); Water available: public and well
- Home design: 3 stories; Garage apartment; Fixer condition
- Construction: Frame construction with vinyl siding; Metal roof; Built as a resale property (less than 25 years old); Foundation: crawlspace, slab, and stone elements; Home warranty included
- Exterior features: Covered deck; Gravel and unpaved (dirt) driveway; Views toward Beaver Lake; Wooded lot with hardwood trees; Rolling, sloped terrain; Not in subdivision; outside city limits
Interior
- Kitchen: Electric cooktop; Electric oven; Dishwasher; Refrigerator
- Bedrooms: Garage apartment (room type)
- Flooring: Carpet; Tile; Wood
- Bathrooms: 2 full bathrooms; 1 half bathroom
- Heating & cooling: Ductless cooling; Ductless heating; Electric heating; Wood stove
- Interior features: Cathedral ceilings; Finished basement; Crawl space; See remarks for additional window features
- Laundry & utility: Washer hookup; Dryer hookup; Electric water heater
Neighborhood map
What this means for you Summary
Snapshot
- This is a 3-bed/2.5-bath single-family listed at $350k.
Deal economics
- At list price, monthly cash flow is $637 ($8k/yr) — positive.
- The deal already cash-flows at list — no discount required.
- To meet the 1% rule (rent ≥ 1% of price), the offer needs to be $348k (0.3% below list).
- Recommended offer: $329k (6.0% below list) — sets the bar for market timing.
- Cap rate 8.5% vs local median 2.8% in Lost Bridge Village — top-decile yield for the area; either an underpriced asset or a hidden risk that comps aren't pricing in. Stress-test before assuming the spread holds.
Location & tenants
- Location reads 57/100 on livability (#348 in AR) — a working-class tenant base; expect higher turnover. Strengths: housing A+, crime B+, employment B; Watch: cost of living C-, schools F, amenities F.
- Rogers School District (urban): math 45% / reading 45% proficiency, ranked #31 of 238 in AR (top 13%) — families likely to look elsewhere, expect single-tenant / working-renter base with shorter leases.
- Market conditions: 130 active listings in the ZIP; 2 comparable units currently listed for rent nearby; 4,359 units permitted in Benton County in 2024 (402 in 5+ unit buildings).
Forward outlook
- In year one you build about $29k of equity ($2k loan paydown + $27k appreciation (7.6% local appreciation)).
- Benton County population projected at +56% by 2050 — long-run rental-demand tailwind backs the buy-and-hold thesis.
- At projected returns (7.6% appreciation + 3.0% rent growth), your $98k cash investment doubles in ~3 years — after that, you're playing with house money.
- By year 2, paydown + projected appreciation supports a ~$46k cash-out refi (75% LTV) — recoverable capital for the next deal without selling this one.
Negotiation context
- It's been on market 61 days — a 6% lower offer ($329k) is reasonable based on typical stale-listing flexibility.
Questions for the listing agent
- It's been on market 61 days. Have you received any prior offers? Is the seller open to a 6% concession, seller financing, or rate buy-down credit?
- Why hasn't it sold? Are there any deal-killer items the seller is aware of (foundation, flood, title, zoning, code violations)?
- Is there a deadline driving the sale (1031 exchange, divorce, estate, relocation)? That informs how much negotiation room exists.
- Schools are F-rated, which usually means shorter tenancies and higher turnover. Who's the typical renter profile here, and what's been the actual vacancy rate?
- What's the average days-on-market for RENTAL listings here right now (not sales)? A rising rental-DOM trend means longer vacancies and softer asking-rent achievability than the comps imply.
- What's the recent tenant-quality profile in this submarket — average credit score on applications, eviction rate, late-payment / NSF rate, and stable-employment percentage? A property-management company in the area should have these aggregated.
- How much new for-sale + rental construction is in the pipeline within 1–3 miles? Heavy new supply typically softens prices + rents 12–24 months out; constrained supply supports both.
Investment metrics
- 1% rule
- 1.00% ✗
- Cap rate
- 8.48%
- Cash-on-cash
- 7.81%
- DSCR
- 1.35
- GRM
- 8.4
CMA / ARV
- ARV (on-the-fly)
- $579,740
- Comps found
- 3
Show comp detail 3 sales within ~0.75 mi
| Address | Dist | Beds/Ba | Sqft | Sold | Price | $/sf | Match |
|---|---|---|---|---|---|---|---|
| 11418 Country Club Dr | 0.70mi | 3/2.0 | 2,004 (-1%) | 6mo | $495,000 | $247 | 59 |
| 11435 Oak Leaf Cir | 0.63mi | 3/2.5 | 2,140 (+6%) | 22mo | $615,000 | $287 | 42 |
| 21393 Black Oak Dr | 0.68mi | 4/2.5 (+1) | 2,240 (+11%) | 13mo | $880,000 | $393 | 34 |
Match score weights: distance 35% · size 25% · config 20% · recency 20%. Top-matched comps best support the ARV.
Projected returns pro-forma
7.61% appreciation · 3.0% rent growth · sell at horizon
- IRR
- 25.2%
- Equity multiple
- 2.80×
- Total profit
- $175,663
- Equity at exit
- $256,246
- IRR
- 22.9%
- Equity multiple
- 5.90×
- Total profit
- $479,180
- Equity at exit
- $500,041
Cash invested: $97,860 (down + closing). Projections, not guarantees.
Landlord ↔ Tenant lean methodology
- Overall (STATE)
- 92 Strongly Landlord-Friendly
- State Arkansas
- 92 Strongly Landlord-Friendly · R+14
- County
- — inherits STATE
- City
- — inherits STATE
ZIP-level market 72732
- Home prices YoY
- 2.1%
- Active inventory
- 130
- Price-to-rent
- 8.4×
Monthly cashflow live
- Estimated rent
- $3,485 medium interval (Pro) →
- Mortgage (P&I)
- −$1,833
- Tax from tax record
- −$138 /mo · $1,656/yr
- Insurance
- −$146
- HOA
- −$0
- Vacancy / Maint / Mgmt
- −$732
- Net cashflow
- $637
Break-even live
Sensitivity live
| Price | -10% $834 | -5% $735 | +0% $637 | +5% $538 | +10% $439 |
|---|---|---|---|---|---|
| Rent | -10% $361 | -5% $499 | +0% $637 | +5% $774 | +10% $912 |
| Rate | -1.0pp $813 | -0.5pp $725 | base $637 | +0.5pp $546 | +1.0pp $454 |
UW: 25.0% down · 7.5% · 30yr · 1.5% tax · 5.0% vac · 8.0% maint · 8.0% mgmt
Financing live
Cash to close
- Down payment
- $87,375
- Closing costs
- $10,485
- Reserves months
- —
- Total cash needed
- —
Loan-product check · same deal, 3 products live
Conventional
25% down · 7.5% · 30yr
- Down + closing
- —
- Monthly P&I
- —
- Monthly cashflow
- —
- DSCR
- —
- Eligible?
- —
Personal DTI + credit; lowest rate.
DSCR
20% down · 8.5% · 30yr
- Down + closing
- —
- Monthly P&I
- —
- Monthly cashflow
- —
- DSCR
- —
- Eligible?
- —
No personal income docs; deal must DSCR.
Hard money
10% down · 12.0% · 12mo
- Down + closing
- —
- Monthly P&I
- —
- Monthly cashflow
- —
- DSCR
- —
- Eligible?
- —
Short-term bridge; refi at stabilization.
Rent comps 2 comps
| Address | Beds | Baths | Sqft | Rent | $/sqft | DOM | Units | Dist |
|---|---|---|---|---|---|---|---|---|
| 10800 Red Bluff Rd Garfield, AR | 2.0 | 2.0 | 1500 | $2,250 | $1.50 | 24d | 1 | 1.09mi |
| 12310 Slate Gap Rd Unit 1221931P Garfield, AR | 4.0 | 2.5 | 2798 | $5,184 | $1.85 | 14d | 1 | 1.45mi |
Listing history 19 events
-
2026-06-21days on market $349,500 Active 61 DOM
-
2026-06-18days on market $349,500 Active 58 DOM
-
2026-06-17days on market $349,500 Active 57 DOM
-
2026-06-16days on market $349,500 Active 56 DOM
-
2026-06-15days on market $349,500 Active 55 DOM
-
2026-06-14days on market $349,500 Active 53 DOM
-
2026-06-13days on market $349,500 Active 52 DOM
-
2026-06-10days on market $349,500 Active 50 DOM
-
2026-06-09days on market $349,500 Active 49 DOM
-
2026-06-08days on market $349,500 Active 48 DOM
-
2026-06-07days on market $349,500 Active 47 DOM
-
2026-06-05days on market $349,500 Active 44 DOM
-
2026-06-03days on market $349,500 Active 43 DOM
-
2026-06-02days on market $349,500 Active 42 DOM
-
2026-06-01days on market $349,500 Active 41 DOM
-
2026-05-31days on market $349,500 Active 40 DOM
-
2026-05-31days on market $349,500 Active 39 DOM
-
2026-04-21$349,500 Active
-
2025-07-25price $415,000
ⓘ Source: listings_history table (triggers on properties + properties_extension) + one-shot
backfill from property_details.listing_events for pre-trigger history.
Tax reassessment forecast AR · Resets to sale price
- Current annual tax
- $1,656 · $138/mo
- Projected year-2 tax
- $2,237 · $186/mo
- Expected delta
- +$581/yr (+$48/mo · 35.1%)
ⓘ Screening estimate from a state-policy table — verify with the county assessor before closing.
Climate risk First Street
- Flood 1/10 Low FEMA zone X (unshaded) · 0% chance over 30 yrs
- Wildfire 3/10 Moderate
- Heat 4/10 Moderate 7 d/yr ≥105°F today · 21 d/yr by 30 yrs out
- Wind 2/10 Low 2% chance of damaging wind over 30 yrs
- Air quality 1/10 Low 0 unhealthy d/yr today · 0 by 30 yrs out
Nearby sold comps map
Loading sold comps map…
Walkable amenities ~0.75 mi
Loading nearby amenities…
Taxation est. · year 1
- Rental income
- $41,818
- − Mortgage interest
- −$19,577
- − Property taxes
- −$1,656
- − Insurance
- −$1,748
- − Repairs & maintenance
- −$3,345
- − Management
- −$3,345
- − Depreciation
- −$10,167
- Taxable income
- $1,979
- Est. tax owed @ 24.0%
- −$475
- After-tax cash flow
- $7,164/yr
For passive investors: Depreciation is non-cash, so a rental often shows a tax loss while cash-flowing — sheltering income. Rental losses are passive: they offset passive income freely, and up to $25,000/yr can offset ordinary (W-2) income if you actively participate and your MAGI is under $100k (phasing out to $0 by $150k); unused losses carry forward. On sale, claimed depreciation is recaptured at up to 25%, and gains may owe capital-gains tax (a 1031 exchange can defer both). Figures are a year-1 estimate at your 24.0% rate — not tax advice; consult a CPA.
Schools (NCES district)
- District
- Rogers School District
- NCES district ID
- 0511970
- Math proficiency
- 45% ▼ -9.00%
- Reading proficiency
- 45% ▼ -9.00%
- Median HH income
- $51,712
- Composite
- 38.81/100
- National rank
- #4113
- State rank
- #31 of 238 in AR
Livability — Lost Bridge Village
- Score
- 57/100
- State rank
- #348
- US rank
- #21912
Category grades
Schools grade is shown separately in the Schools card above.
Census & demographics
- Census place
- Lost Bridge Village, AR
- Population (ZIP)
- 5,493
Population outlook (Benton County) Hauer SSP2
- Today (2025)
- 318,683 people
- By 2030
- 353,481 · +10.9%
- By 2040
- 425,280 · +33.4%
- By 2050
- 497,239 · +56.0%
- By 2075
- 662,114 · +107.8%
- By 2100
- 776,431 · +143.6%
Race, ethnicity, and origin ACS 2023
- Neighborhood character
- Diverse neighborhood (Simpson 0.56)
- Race & ethnicity
- White 65% Two or more races 27% Hispanic / Latino 11% Native American 1%
- Hispanic origin (detail)
- Mexican 7%
- Common ancestry
- Italian 3% Danish 2% Lithuanian 1%
- Foreign-born
- 3% · Canada
- Languages at home
- 97% English-only · Spanish 3%
Political lean MEDSL · Benton
- 2024 margin
- Strong R (+27.0) · D 35.2% · R 62.1% · Other 2.7%
- 2008→2024 swing
- +9.6pp toward D · 2008: -36.5pp · 2024: -27.0pp
- All cycles
- 2024: R+27.0 2020: R+26.4 2016: R+34.9 2012: R+40.4 2008: R+36.5
Not yet ingested
- Civics
- —
Market trends
- HPI YoY
- ▲ 7.61%
- Current HPI
- 368.3932
- Rent YoY
- —
- Metro
- —
- State GDP YoY
- ▲ 3.80%
- F500 in state
- 10
Industry mix (Fortune 500 HQ in AR)
| Industry | F500 HQs | Revenue |
|---|---|---|
| Retail | 1 | $681B |
|
||
| Food / Agriculture | 1 | $53B |
|
||
| Retail / Energy | 1 | $22B |
|
||
| Transportation / Logistics | 1 | $12B |
|
||
| Energy | 1 | $4B |
|
||
Price history
-15.8% since first listed2 events — show timeline
- 2026-04-21 Listed $349,500 NWARMLS
- 2025-07-25 Price Changed $415,000 NWARMLS
Property tax history
+4.2%/yrLatest (2025): $1,656 · +62.1% YoY. Source: county tax records.
Cash-flow waterfall
monthlySold comps — $/sqft
last 12 mo · ≤1 miLoading sold comps…