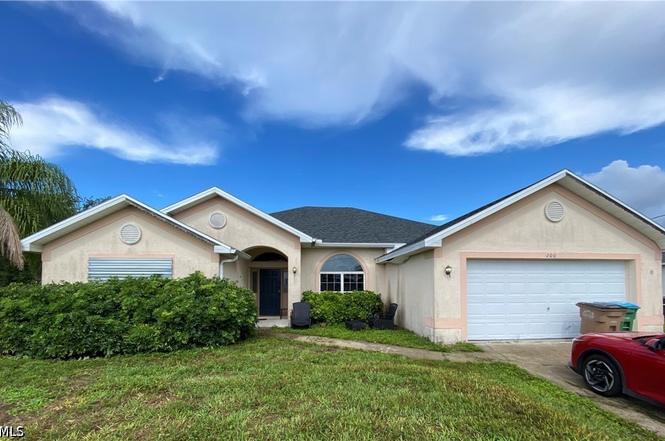
100 NW 28th Ct · Cape Coral, FL
Flood risk 9/10 · Severe
- FEMA flood zone
- AE
- Chance of flooding over 30 yrs
- 0.99%
- Est. flood insurance / yr
- $1,737 – $8,500
Fire risk 1/10 · Minimal
- Est. fire insurance / yr
- $947 – $1,759
Heat risk 10/10 · Severe
- Hot days now (above 107°F)
- 7 days/yr
- Hot days in 30 yrs
- 30 days/yr
Wind risk 10/10 · Severe
- Chance of severe wind over 30 yrs
- 99.0%
Air-quality risk 2/10 · Minimal
- Unhealthy air days now
- 1 days/yr
- Unhealthy air days in 30 yrs
- 1 days/yr
Risk factors via First Street. Map © Google.
Why this score? — see what drove the C- grade
The composite is a weighted blend of 9 inputs, each scored 0–100. Each bar is that input's sub-score; the figure is the points it added to the 100-point composite (weight × sub-score).
- Cash flow +20.4/30.0
- ARV discount +7.5/15.0
- 1% rule +6.7/10.0
- DSCR +6.5/10.0
- Schools +4.1/10.0
- Livability +3.9/5.0
- Condition / age +2.5/5.0
- Rent growth +1.1/5.0
- Appreciation +0.0/10.0
$235,000
🖨 Deal sheet 📄 Offer letter ✓ Due diligence
Listing remarks MLS
This is a Fannie Mae HomePath property approved for Homepath Renovation Mortgage financing. Fannie Mae is offering a 3.5% incentive for buyers who purchase and close on a Fannie Mae-owned home between January 28 and April 30, 2010. See attached doucments for details. This extremely very well kept and almost new 2006 built home is perfectly situated on a large 1/3+ acre corner lot. The home boasts an expansive floor plan with a formal dining room, a lovely kitchen with cherry wood cabinets, a separate breakfast nook directly off the kitchen, a spacious family room, 4 large bedrooms and two baths. The master bath includes his & her sinks, a walk-in shower, garden tub and large walk-in closet. The guest bath also includes his & her sinks and a large vanity. There is plenty of room for a large pool off the screened lanai or a great yard for pets and children to play!
Key facts
- Custom pool
- Triple lot
- Hvac system
Tags
Property features AI
Finance
- Other: Lot is oversized with multiple lots; Lot dimensions approximately 61 x 180 x 167 x 125; Lot faces west exposure; Zoned R1; Irrigation from well; Lot size approximately 0.35 acres
- HOA & community: Non-gated community; No association fee
Exterior
- Parking: Attached 2-car garage
- Utilities: Well water; Septic tank; Cable available
- Home design: Single-story; Entry level: 1; Faces east; Resale property
- Construction: Block, concrete and stucco construction; Shingle roof; Built on foundation (resale)
- Exterior features: Patio; Open porch
Interior
- Kitchen: Dishwasher; Microwave; Range; Refrigerator; Eat-in kitchen; Breakfast bar
- Bedrooms: Includes den; Includes guest quarters; Great room included
- Flooring: Tile; Vinyl
- Bathrooms: 2 full bathrooms
- Heating & cooling: Central heating (electric); Central air conditioning; Ceiling fan(s)
- Interior features: Breakfast bar; Bathtub; Cathedral ceiling(s); Dual sinks; Entrance foyer; Eat-in kitchen; Separate shower; Cable TV; Walk-in closet(s); Split bedrooms; Sliding windows; Shutters; Unfurnished
- Laundry & utility: Laundry inside
Neighborhood map
What this means for you Summary
Snapshot
- This is a 3-bed/2.0-bath single-family listed at $235k.
Deal economics
- At list price, monthly cash flow is $-119 ($-1k/yr) — negative.
- To cash-flow at today's rent, offer at most $214k (9.0% below list).
- Meets the 1% rule at list price ($3k rent vs $235k).
- Recommended offer: $214k (9.0% below list) — sets the bar for cash-flow.
- Cap rate 7.9% vs local median 3.1% in Cape Coral — top-decile yield for the area; either an underpriced asset or a hidden risk that comps aren't pricing in. Stress-test before assuming the spread holds.
Location & tenants
- Location reads 77/100 on livability (#208 in FL, #3,098 nationally) — a middle-class / working-renter tenant base. Strengths: housing A+, health & safety A+, amenities B+; Watch: commute F.
- Lee (suburban): math 47% / reading 50% proficiency, ranked #42 of 73 in FL (top 58%) — families likely to look elsewhere, expect single-tenant / working-renter base with shorter leases.
- Market conditions: Rents falling (-5.5%/yr); 2652 active listings in the ZIP; 40 comparable units currently listed for rent nearby; rentals at typical pace (median 24d on market — plan ~3-4 weeks tenant-placement turnaround); solid renter incomes; 15,411 units permitted in Lee County in 2024 (4,686 in 5+ unit buildings).
- This rent runs 36% of the median local income ($91k/yr) — at the standard rent-burdened threshold; future hikes will face affordability resistance.
Forward outlook
- Local home prices are declining (-3.0%/yr); year-one equity from $2k of loan paydown is wiped out by about $7k of value loss. Plan a longer hold.
- Lee County population projected at +44% by 2050 — long-run rental-demand tailwind backs the buy-and-hold thesis.
Negotiation context
- Only 3 days on market — expect competitive offers; lowballing is unlikely to land.
- Current owner paid $126k; list at $235k implies a 86% gain — meaningful room to come down on a strong offer.
Risks & watch-outs
- Watch-outs: property tax is 2.7% of price; flood insurance adds $427/mo.
- Climate carrying-cost: in FEMA flood zone AE (mandatory federal flood insurance); severe wind risk, 99% chance of damaging wind over 30y; extreme-heat days projected 7→30/yr by 2055 (HVAC capex compounding) — expect insurance premiums to compound above CPI over the hold.
Questions for the listing agent
- What do current leases actually rent for vs. the listed asking? Can we see a recent rent roll and the last 12 months of T-12 income?
- Property tax is high relative to price — has the assessment been appealed recently, and will the sale trigger a re-assessment?
- What's the actual annual flood-insurance premium (NFIP or private), and is the property in a SFHA with mandatory coverage?
- Is there a deadline driving the sale (1031 exchange, divorce, estate, relocation)? That informs how much negotiation room exists.
- Schools are B-rated — typically a magnet for longer-tenancy family renters. What's the average tenant stay here, and is there a school-zone premium baked into asking?
- What's the average days-on-market for RENTAL listings here right now (not sales)? A rising rental-DOM trend means longer vacancies and softer asking-rent achievability than the comps imply.
- What's the recent tenant-quality profile in this submarket — average credit score on applications, eviction rate, late-payment / NSF rate, and stable-employment percentage? A property-management company in the area should have these aggregated.
- How much new for-sale + rental construction is in the pipeline within 1–3 miles? Heavy new supply typically softens prices + rents 12–24 months out; constrained supply supports both.
Investment metrics
- 1% rule
- 1.17% ✓
- Cap rate
- 7.86%
- Cash-on-cash
- 5.60%
- DSCR
- 1.25
- GRM
- 7.1
CMA / ARV
- ARV (on-the-fly)
- $491,841
- Comps found
- 10
Show comp detail 10 sales within ~0.75 mi
| Address | Dist | Beds/Ba | Sqft | Sold | Price | $/sf | Match |
|---|---|---|---|---|---|---|---|
| 3107 NW Embers Ter | 0.26mi | 4/3.0 (+1) | 2,352 (+1%) | 22mo | $459,700 | $195 | 59 |
| 2610 SW Embers Ter | 0.40mi | 4/3.0 (+1) | 2,076 (-11%) | 2mo | $489,990 | $236 | 52 |
| 307 NW 27th Ave | 0.41mi | 4/2.0 (+1) | 2,246 (-4%) | 24mo | $465,000 | $207 | 50 |
| 2437 NW Embers Ter | 0.52mi | 4/3.0 (+1) | 2,428 (+4%) | 18mo | $400,000 | $165 | 44 |
| 2508 SW 1st St | 0.55mi | 4/2.5 (+1) | 2,012 (-14%) | 4mo | $410,000 | $204 | 42 |
| 208 SW 24th Pl | 0.71mi | 3/2.0 | 2,017 (-14%) | 12mo | $345,450 | $171 | 35 |
| 2809 NW 6th Ter | 0.74mi | 4/2.0 (+1) | 2,006 (-14%) | 5mo | $435,000 | $217 | 33 |
| 222 SW 25th Ave | 0.69mi | 4/3.0 (+1) | 2,010 (-14%) | 7mo | $597,500 | $297 | 30 |
| 212 NW 24th Pl | 0.58mi | 3/3.0 | 1,988 (-15%) | 23mo | $420,000 | $211 | 25 |
| 334 SW 25th Pl | 0.72mi | 4/3.0 (+1) | 2,002 (-14%) | 22mo | $620,000 | $310 | 16 |
Match score weights: distance 35% · size 25% · config 20% · recency 20%. Top-matched comps best support the ARV.
Projected returns pro-forma
-3.0% appreciation · 0.0% rent growth · sell at horizon
- IRR
- -24.7%
- Equity multiple
- 0.19×
- Total profit
- $-53,284
- Equity at exit
- $35,039
- IRR
- -42.2%
- Equity multiple
- -0.30×
- Total profit
- $-85,464
- Equity at exit
- $20,319
Cash invested: $65,800 (down + closing). Projections, not guarantees.
Landlord ↔ Tenant lean methodology
- Overall (STATE)
- 87 Strongly Landlord-Friendly
- State Florida
- 87 Strongly Landlord-Friendly · R+3
- County
- — inherits STATE
- City
- — inherits STATE
ZIP-level market 33993
- Home prices YoY
- -14.1%
- Rents YoY
- -5.5%
- Active inventory
- 2652
- Price-to-rent
- 7.1×
Monthly cashflow live
- Estimated rent
- $2,746 high interval (Pro) →
- Mortgage (P&I)
- −$1,232
- Tax from tax record
- −$532 /mo · $6,382/yr
- Insurance
- −$98
- Flood insurance flood zone
- −$427 /mo · $5,118/yr
- HOA
- −$0
- Vacancy / Maint / Mgmt
- −$577
- Net cashflow
- $-119
Break-even live
UW: 25.0% down · 7.5% · 30yr · 1.5% tax · 5.0% vac · 8.0% maint · 8.0% mgmt
Financing live
Cash to close
- Down payment
- $58,750
- Closing costs
- $7,050
- Reserves months
- —
- Total cash needed
- —
Loan-product check · same deal, 3 products live
Conventional
25% down · 7.5% · 30yr
- Down + closing
- —
- Monthly P&I
- —
- Monthly cashflow
- —
- DSCR
- —
- Eligible?
- —
Personal DTI + credit; lowest rate.
DSCR
20% down · 8.5% · 30yr
- Down + closing
- —
- Monthly P&I
- —
- Monthly cashflow
- —
- DSCR
- —
- Eligible?
- —
No personal income docs; deal must DSCR.
Hard money
10% down · 12.0% · 12mo
- Down + closing
- —
- Monthly P&I
- —
- Monthly cashflow
- —
- DSCR
- —
- Eligible?
- —
Short-term bridge; refi at stabilization.
Rent comps 40 comps
| Address | Beds | Baths | Sqft | Rent | $/sqft | DOM | Units | Dist |
|---|---|---|---|---|---|---|---|---|
| 2835 NW Embers Ter Cape Coral, FL | 3.0 | 2.0 | 1667 | $2,250 | $1.35 | 14d | 1 | 0.04mi |
| 2716 NW Embers Ter Cape Coral, FL | 4.0 | 3.0 | 1765 | $3,000 | $1.70 | 23d | 1 | 0.19mi |
| 2725 SW Embers Ter Cape Coral, FL | 3.0 | 2.0 | 1970 | $2,100 | $1.07 | 3d | 1 | 0.24mi |
| 2637 NW 1st St Cape Coral, FL | 3.0 | 2.0 | 1968 | $2,475 | $1.26 | 23d | 1 | 0.27mi |
| 2837 NW 3rd St Cape Coral, FL | 3.0 | 3.0 | 1700 | $3,500 | $2.06 | 23d | 1 | 0.28mi |
| 2837 NW 3rd St Cape Coral, FL | 3.0 | 3.0 | 1700 | $3,500 | $2.06 | 21d | 1 | 0.28mi |
| 174 Shadroe Cove Cir #1004 Cape Coral, FL | 3.0 | 2.5 | 2374 | $3,200 | $1.35 | 23d | 1 | 0.49mi |
| 2507 Embers Pkwy W Cape Coral, FL | 3.0 | 2.0 | 1777 | $2,450 | $1.38 | 23d | 1 | 0.50mi |
| 3227 Embers Pkwy W Cape Coral, FL | 4.0 | 3.0 | 2403 | $5,000 | $2.08 | 3d | 1 | 0.52mi |
| 2447 SW Embers Ter Cape Coral, FL | 3.0 | 3.0 | 1870 | $2,100 | $1.12 | 16d | 1 | 0.55mi |
| 2710 NW 5th Ter Cape Coral, FL | 4.0 | 2.0 | 1830 | $1,925 | $1.05 | 16d | 1 | 0.61mi |
| 17 El Dorado Blvd N Cape Coral, FL | 3.0 | 2.0 | 1779 | $2,200 | $1.24 | 23d | 1 | 0.67mi |
| 212 SW 25th Ave Cape Coral, FL | 4.0 | 2.0 | 1828 | $1,850 | $1.01 | 23d | 1 | 0.67mi |
| 3404 NW 1st Ter Cape Coral, FL | 4.0 | 4.0 | 2613 | $3,500 | $1.34 | 14d | 1 | 0.68mi |
| 221 SW 25th Ave Cape Coral, FL | 4.0 | 2.5 | 1871 | $2,600 | $1.39 | 2d | 1 | 0.72mi |
| 13 SW 34th Pl Cape Coral, FL | 4.0 | 3.0 | 2306 | $2,700 | $1.17 | 3d | 1 | 0.73mi |
| 512 NW 25th Ave Cape Coral, FL | 3.0 | 2.0 | 1702 | $2,100 | $1.23 | 11d | 1 | 0.77mi |
| 3322 NW 5th Ter Cape Coral, FL | 3.0 | 2.0 | 1666 | $5,000 | $3.00 | 23d | 1 | 0.83mi |
| 326 SW 24th Pl Cape Coral, FL | 3.0 | 2.0 | 1747 | $1,795 | $1.03 | 23d | 1 | 0.85mi |
| 2239 SW 2nd Ln Cape Coral, FL | 3.0 | 2.5 | 2362 | $2,200 | $0.93 | 23d | 1 | 0.87mi |
| 217 NW 36th Ave Cape Coral, FL | 3.0 | 2.0 | 1885 | $4,000 | $2.12 | 14d | 1 | 0.87mi |
| 2519 NW 7th St Cape Coral, FL | 3.0 | 2.0 | 2017 | $2,296 | $1.14 | 3d | 1 | 0.92mi |
| 233 NW 22nd Pl Cape Coral, FL | 4.0 | 3.0 | 1665 | $2,200 | $1.32 | 23d | 1 | 0.95mi |
| 2251 SW 4th St Cape Coral, FL | 3.0 | 2.0 | 1806 | $1,595 | $0.88 | 10d | 1 | 0.96mi |
| 421 NW 36th Ave Cape Coral, FL | 4.0 | 2.0 | 2230 | $1,900 | $0.85 | 2d | 1 | 0.97mi |
| 2435 NW 7th Ter Cape Coral, FL | 4.0 | 2.0 | 2638 | $2,495 | $0.95 | 23d | 1 | 1.01mi |
| 223 SW 22nd Ct Cape Coral, FL | 3.0 | 3.0 | 1910 | $3,500 | $1.83 | 23d | 1 | 1.03mi |
| 141 SW 37th Pl Cape Coral, FL | 3.0 | 2.0 | 2201 | $3,200 | $1.45 | 3d | 1 | 1.07mi |
| 2045 NW 3rd St Cape Coral, FL | 3.0 | 2.0 | 1656 | $2,095 | $1.27 | 10d | 1 | 1.09mi |
| 3527 SW 4th Ln Cape Coral, FL | 4.0 | 3.0 | 2010 | $3,700 | $1.84 | 23d | 1 | 1.09mi |
| 2465 NW 9th St Cape Coral, FL | 4.0 | 3.0 | 2020 | $2,595 | $1.28 | 23d | 1 | 1.12mi |
| 121 NW 38th Ave Cape Coral, FL | 3.0 | 3.0 | 1957 | $3,995 | $2.04 | 16d | 1 | 1.13mi |
| 3804 Embers Pkwy W Cape Coral, FL | 3.0 | 3.0 | 1906 | $4,500 | $2.36 | 23d | 1 | 1.16mi |
| 426 NW 37th Pl Cape Coral, FL | 3.0 | 2.0 | 1739 | $5,250 | $3.02 | 23d | 1 | 1.18mi |
| 2032 NW 5th St Cape Coral, FL | 3.0 | 2.0 | 1946 | $2,200 | $1.13 | 23d | 1 | 1.20mi |
| 1900 NW Embers Ter Cape Coral, FL | 4.0 | 3.0 | 2009 | $2,900 | $1.44 | 23d | 1 | 1.27mi |
| 2043 NW 6th Ter Cape Coral, FL | 4.0 | 2.0 | 1712 | $2,999 | $1.75 | 23d | 1 | 1.29mi |
| 1827 Embers Pkwy W Cape Coral, FL | 4.0 | 3.0 | 1807 | $2,300 | $1.27 | 3d | 1 | 1.32mi |
| 1827 Embers Pkwy W Cape Coral, FL | 4.0 | 3.0 | 1807 | $2,500 | $1.38 | 14d | 1 | 1.32mi |
| 2701 NW 11th St Cape Coral, FL | 3.0 | 2.0 | 1627 | $3,000 | $1.84 | 23d | 1 | 1.34mi |
Listing history 4 events
-
2026-06-18days on market $235,000 Active 3 DOM
-
2026-06-17days on market $235,000 Active 2 DOM
-
2026-06-15remarks 684-char remark
-
2026-06-15$235,000 Active 1 DOM
ⓘ Source: listings_history table (triggers on properties + properties_extension) + one-shot
backfill from property_details.listing_events for pre-trigger history.
Tax reassessment forecast FL · Resets to sale price
- Current annual tax
- $6,382 · $532/mo
- Projected year-2 tax
- $6,382 · $532/mo
- Expected delta
- $0/yr ($0/mo · 0.0%)
ⓘ Screening estimate from a state-policy table — verify with the county assessor before closing.
Climate risk First Street
- Flood 9/10 Extreme FEMA zone AE · 99% chance over 30 yrs
- Wildfire 1/10 Low
- Heat 10/10 Extreme 7 d/yr ≥107°F today · 30 d/yr by 30 yrs out
- Wind 10/10 Extreme 99% chance of damaging wind over 30 yrs
- Air quality 2/10 Low 1 unhealthy d/yr today · 1 by 30 yrs out
Nearby sold comps map
Loading sold comps map…
Walkable amenities ~0.75 mi
Loading nearby amenities…
Taxation est. · year 1
- Rental income
- $32,950
- − Mortgage interest
- −$13,164
- − Property taxes
- −$6,382
- − Insurance
- −$6,294
- − Repairs & maintenance
- −$2,636
- − Management
- −$2,636
- − Depreciation
- −$6,836
- Taxable loss
- −$4,997
- Est. tax savings @ 24.0%
- +$1,199
- After-tax cash flow
- $-234/yr
For passive investors: Depreciation is non-cash, so a rental often shows a tax loss while cash-flowing — sheltering income. Rental losses are passive: they offset passive income freely, and up to $25,000/yr can offset ordinary (W-2) income if you actively participate and your MAGI is under $100k (phasing out to $0 by $150k); unused losses carry forward. On sale, claimed depreciation is recaptured at up to 25%, and gains may owe capital-gains tax (a 1031 exchange can defer both). Figures are a year-1 estimate at your 24.0% rate — not tax advice; consult a CPA.
Schools (NCES district)
- District
- Lee
- NCES district ID
- 1201080
- Math proficiency
- 47% ▼ -11.00%
- Reading proficiency
- 50% ▼ -4.00%
- Median HH income
- $49,518
- Composite
- 41.49/100
- National rank
- #3458
- State rank
- #42 of 73 in FL
Livability — Cape Coral
- Score
- 77/100
- State rank
- #208
- US rank
- #3098
Category grades
Schools grade is shown separately in the Schools card above.
Census & demographics
- Census place
- Cape Coral, FL
- County
- Lee County · 788,662 people
- City population
- 217,388
- Metro
- Cape Coral-Fort Myers, FL
- Population (ZIP)
- 35,580
- Household income
- $90,577
- Rent vs Own
- Severe rent burden
- 286.0
Population outlook (Lee County) Hauer SSP2
- Today (2025)
- 871,946 people
- By 2030
- 955,468 · +9.6%
- By 2040
- 1,113,587 · +27.7%
- By 2050
- 1,256,891 · +44.1%
- By 2075
- 1,560,270 · +78.9%
- By 2100
- 1,726,848 · +98.0%
Race, ethnicity, and origin ACS 2023
- Neighborhood character
- Diverse neighborhood (Simpson 0.58)
- Race & ethnicity
- White 57% Hispanic / Latino 30% Two or more races 21% Black 7% Asian 2%
- Hispanic origin (detail)
- Mexican 2% Puerto Rican 6% Cuban 17% Dominican 1%
- Common ancestry
- Romanian 2% Hispanic 2% Lithuanian 2%
- Foreign-born
- 21% · Canada, Jamaica, China
- Languages at home
- 73% English-only · Spanish 24% French/Haitian/Cajun 1% Russian/Polish/Slavic 1%
Political lean MEDSL · Lee
- 2024 margin
- Strong R (+28.4) · D 35.5% · R 63.9%
- 2008→2024 swing
- -18.0pp toward R · 2008: -10.4pp · 2024: -28.4pp
- All cycles
- 2024: R+28.4 2020: R+19.2 2016: R+20.4 2012: R+16.6 2008: R+10.4
Not yet ingested
- Civics
- —
Market trends
- HPI YoY
- ▼ -55.34%
- Current HPI
- 337.0575
- Rent YoY
- ▼ -5.51%
- Metro
- Cape Coral-Fort Myers, FL
- State GDP YoY
- ▲ 3.28%
- F500 in state
- 36
Industry mix (Fortune 500 HQ in FL)
| Industry | F500 HQs | Revenue |
|---|---|---|
| Industrial Technology | 2 | $29B |
|
||
| Insurance | 2 | $17B |
|
||
| Retail | 1 | $60B |
|
||
| Technology Distribution | 1 | $58B |
|
||
| Homebuilding | 1 | $35B |
|
||
| Technology Manufacturing | 1 | $35B |
|
||
Price history
+1466.7% since first listed5 events — show timeline
- 2026-06-15 Listed $235,000 FORTMLS
- 2013-09-17 Price Changed $119,900 FORTMLS
- 2010-04-22 Sold (MLS) $126,500 FORTMLS
- 2004-10-12 Sold (Public Records) $43,800 Public Records
- 1990-07-19 Sold (Public Records) $15,000 Public Records
Property tax history
+12.8%/yrLatest (2025): $6,382 · +3.1% YoY. Source: county tax records.
Cash-flow waterfall
monthlySold comps — $/sqft
last 12 mo · ≤1 miLoading sold comps…