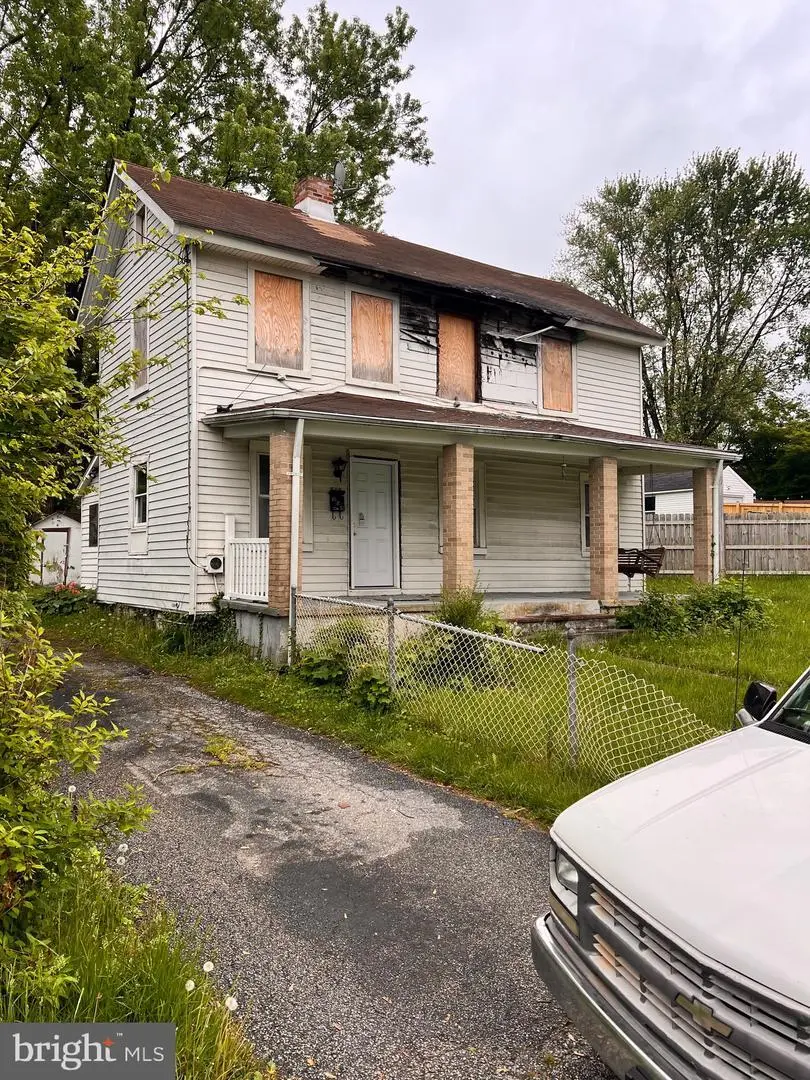
518 Ingleside Ave · Catonsville, MD
Flood risk 8/10 · Major
- FEMA flood zone
- A
- Chance of flooding over 30 yrs
- 0.99%
- Est. flood insurance / yr
- $1,009 – $1,996
Fire risk 2/10 · Minimal
- Est. fire insurance / yr
- $755 – $1,403
Heat risk 6/10 · Moderate
- Hot days now (above 103°F)
- 7 days/yr
- Hot days in 30 yrs
- 15 days/yr
Wind risk 4/10 · Minor
- Chance of severe wind over 30 yrs
- 18.0%
Air-quality risk 3/10 · Minor
- Unhealthy air days now
- 3 days/yr
- Unhealthy air days in 30 yrs
- 4 days/yr
Risk factors via First Street. Map © Google.
Why this score? — see what drove the B- grade
The composite is a weighted blend of 9 inputs, each scored 0–100. Each bar is that input's sub-score; the figure is the points it added to the 100-point composite (weight × sub-score).
- Cash flow +30.0/30.0
- DSCR +10.0/10.0
- 1% rule +9.1/10.0
- ARV discount +7.5/15.0
- Livability +4.0/5.0
- Rent growth +3.0/5.0
- Condition / age +2.5/5.0
- Schools +2.3/10.0
- Appreciation +0.0/10.0
$144,900
🖨 Deal sheet 📄 Offer letter ✓ Due diligence
Listing remarks MLS
INVESTOR ALERT!! Home has fire damage, priced to sell! Cash or Hard Money only. Buyer pays all closing costs including TT & Rs. . Seller strongly prefers the use of New World Title of Lutherville (Mobile closing included in fee)
Key facts
- 5,576 sq ft lot
- Built 1820
- Listed 167 days
Neighborhood map
What this means for you Summary
Snapshot
- This is a 3-bed/1.0-bath single-family listed at $145k.
Deal economics
- At list price, monthly cash flow is $533 ($6k/yr) — positive.
- The deal already cash-flows at list — no discount required.
- Meets the 1% rule at list price ($2k rent vs $145k).
- Recommended offer: $128k (12.0% below list) — sets the bar for market timing.
- Cap rate 11.7% vs local median 3.4% in Catonsville — top-decile yield for the area; either an underpriced asset or a hidden risk that comps aren't pricing in. Stress-test before assuming the spread holds.
Location & tenants
- Location reads 81/100 on livability (#43 in MD, #1,586 nationally) — a professional / high-income tenant draw. Strengths: commute A+, employment A+, housing A+; Watch: crime D, cost of living D.
- Baltimore County Public Schools (suburban): math 15% / reading 34% proficiency, ranked #11 of 24 in MD (top 46%) — low school quality limits family demand, transient renter base, plan for 1-2y turnover.
- Market conditions: Rents rising (+1.9%/yr); 144 active listings in the ZIP; 23 comparable units currently listed for rent nearby; rentals at typical pace (median 18d on market — plan ~3-4 weeks tenant-placement turnaround); high-income renter base; 1,511 units permitted in Baltimore County in 2024 (643 in 5+ unit buildings).
Forward outlook
- Local home prices are declining (-3.0%/yr); year-one equity from $1k of loan paydown is wiped out by about $4k of value loss. Plan a longer hold.
- Baltimore County population projected at +12% by 2050 — modest demand growth; plan on rents tracking national, not racing it.
- At projected returns (-3.0% appreciation + 1.9% rent growth), your $41k cash investment doubles in ~9 years — after that, you're playing with house money.
Negotiation context
- It's been on market 167 days — a 12% lower offer ($128k) is reasonable based on typical stale-listing flexibility.
- 5 sale attempts; this cycle's ask has dropped $20k (12%) from the opening price — seller is motivated, your offer sets the floor, not the list.
- Current owner paid $45k; list at $145k implies a 222% gain — meaningful room to come down on a strong offer.
Risks & watch-outs
- Watch-outs: flood insurance adds $125/mo; built in 1820 — expect roof / HVAC / electrical / plumbing capex.
- Climate carrying-cost: in FEMA flood zone A (mandatory federal flood insurance); extreme-heat days projected 7→15/yr by 2055 (HVAC capex compounding) — expect insurance premiums to compound above CPI over the hold.
Questions for the listing agent
- It's been on market 167 days. Have you received any prior offers? Is the seller open to a 12% concession, seller financing, or rate buy-down credit?
- Built in 1820 — when were the roof, HVAC, electrical panel, plumbing, and water heater last replaced?
- What's the actual annual flood-insurance premium (NFIP or private), and is the property in a SFHA with mandatory coverage?
- Why hasn't it sold? Are there any deal-killer items the seller is aware of (foundation, flood, title, zoning, code violations)?
- Is there a deadline driving the sale (1031 exchange, divorce, estate, relocation)? That informs how much negotiation room exists.
- Crime grade is D in this area — have there been break-ins, vandalism, or insurance claims at this property in the last 3 years? What carrier currently insures it and at what premium?
- What's the average days-on-market for RENTAL listings here right now (not sales)? A rising rental-DOM trend means longer vacancies and softer asking-rent achievability than the comps imply.
- What's the recent tenant-quality profile in this submarket — average credit score on applications, eviction rate, late-payment / NSF rate, and stable-employment percentage? A property-management company in the area should have these aggregated.
- How much new for-sale + rental construction is in the pipeline within 1–3 miles? Heavy new supply typically softens prices + rents 12–24 months out; constrained supply supports both.
Investment metrics
- 1% rule
- 1.41% ✓
- Cap rate
- 11.74%
- Cash-on-cash
- 19.46%
- DSCR
- 1.87
- GRM
- 5.9
CMA / ARV
- ARV (median comp)
- $368,483
- List price
- $144,900
- Delta
- -59.32%
- Verdict
- UNDERPRICED
- Comps
- 20 within 1.0 mi
Show comp detail 5 sales within ~0.75 mi
| Address | Dist | Beds/Ba | Sqft | Sold | Price | $/sf | Match |
|---|---|---|---|---|---|---|---|
| 423 Ingleside Ave | 0.15mi | 3/2.5 | 1,152 (+5%) | 8mo | $365,000 | $317 | 72 |
| 14 Glenwood Ave | 0.53mi | 3/1.5 | 1,152 (+5%) | 3mo | $405,000 | $352 | 62 |
| 19 Delrey Ave | 0.43mi | 2/1.0 (-1) | 1,136 (+4%) | 10mo | $360,000 | $317 | 61 |
| 520 Kent Ave | 0.24mi | 3/2.0 | 1,142 (+4%) | 23mo | $280,000 | $245 | 59 |
| 520 Winters Ln | 0.74mi | 2/2.0 (-1) | 1,134 (+4%) | 14mo | $226,100 | $199 | 39 |
Match score weights: distance 35% · size 25% · config 20% · recency 20%. Top-matched comps best support the ARV.
Projected returns pro-forma
-3.0% appreciation · 1.87% rent growth · sell at horizon
- IRR
- 5.3%
- Equity multiple
- 1.20×
- Total profit
- $8,222
- Equity at exit
- $21,605
- IRR
- 13.6%
- Equity multiple
- 2.03×
- Total profit
- $41,938
- Equity at exit
- $12,528
Cash invested: $40,572 (down + closing). Projections, not guarantees.
Landlord ↔ Tenant lean methodology
- Overall (STATE)
- 27 Tenant-Leaning
- State Maryland
- 27 Tenant-Leaning · D+14
- County
- — inherits STATE
- City
- — inherits STATE
ZIP-level market 21228
- Rents YoY
- 1.9%
- Active inventory
- 144
- Price-to-rent
- 5.9×
Monthly cashflow live
- Estimated rent
- $2,048 high interval (Pro) →
- Mortgage (P&I)
- −$760
- Tax from tax record
- −$140 /mo · $1,681/yr
- Insurance
- −$60
- Flood insurance flood zone
- −$125 /mo · $1,502/yr
- HOA
- −$0
- Vacancy / Maint / Mgmt
- −$430
- Net cashflow
- $533
Break-even live
UW: 25.0% down · 7.5% · 30yr · 1.5% tax · 5.0% vac · 8.0% maint · 8.0% mgmt
Financing live
Cash to close
- Down payment
- $36,225
- Closing costs
- $4,347
- Reserves months
- —
- Total cash needed
- —
Loan-product check · same deal, 3 products live
Conventional
25% down · 7.5% · 30yr
- Down + closing
- —
- Monthly P&I
- —
- Monthly cashflow
- —
- DSCR
- —
- Eligible?
- —
Personal DTI + credit; lowest rate.
DSCR
20% down · 8.5% · 30yr
- Down + closing
- —
- Monthly P&I
- —
- Monthly cashflow
- —
- DSCR
- —
- Eligible?
- —
No personal income docs; deal must DSCR.
Hard money
10% down · 12.0% · 12mo
- Down + closing
- —
- Monthly P&I
- —
- Monthly cashflow
- —
- DSCR
- —
- Eligible?
- —
Short-term bridge; refi at stabilization.
Rent comps 23 comps
| Address | Beds | Baths | Sqft | Rent | $/sqft | DOM | Units | Dist |
|---|---|---|---|---|---|---|---|---|
| 417 Wheaton Pl Catonsville, MD | 2.0 | 1.0 | 1200 | $2,169 | $1.81 | 2d | 1 | 0.10mi |
| 311 Harlem Ln Catonsville, MD | 3.0 | 2.0 | 1152 | $2,300 | $2.00 | 4d | 1 | 0.31mi |
| 407 Cedar Run Pl Catonsville, MD | 2.0 | 1.0 | 544 | $1,546 | $2.84 | 20d | 1 | 0.57mi |
| 408 Shade Tree Pl Catonsville, MD | 1.0–2.0 | 1.0–2.0 | 805 | $1,812 | $2.25 | 4d | 1 | 0.64mi |
| 410 Winters Ln Catonsville, MD | 2.0 | 2.0 | 1296 | $2,000 | $1.54 | 4d | 1 | 0.65mi |
| 39 Bloomsbury Ave Unit 1 Catonsville, MD | 2.0 | 1.0 | 1100 | $1,800 | $1.64 | 43d | 1 | 0.75mi |
| 351 Suter Rd Catonsville, MD | 2.0 | 1.0 | 753 | $1,570 | $2.09 | 2d | 21 | 0.75mi |
| 51 Briarwood Rd Catonsville, MD | 3.0 | 1.0 | 1200 | $2,100 | $1.75 | 43d | 1 | 0.82mi |
| 1200 Alexander Ave Catonsville, MD | 3.0 | 2.5 | 1215 | $2,400 | $1.98 | 43d | 1 | 0.94mi |
| 945 Saint Agnes Ln Gwynn Oak, MD | 4.0 | 2.0 | 1500 | $1,985 | $1.32 | 17d | 1 | 1.03mi |
| 930 Masefield Rd Unit 1 Woodlawn, MD | 3.0 | 1.5 | 1080 | $2,650 | $2.45 | 2d | 1 | 1.06mi |
| 6300 Mount Ridge Rd Unit A Catonsville, MD | 2.0 | 1.0 | 1100 | $1,750 | $1.59 | 43d | 1 | 1.07mi |
| 201 S Symington Ave Catonsville, MD | 1.0–2.0 | 1.0 | 788 | $1,519 | $1.93 | 1d | 13 | 1.12mi |
| 28 Montrose Manor Ct Catonsville, MD | 2.0 | 1.0 | 965 | $2,379 | $2.47 | 2d | 3 | 1.24mi |
| 603 Braeside Rd Baltimore, MD | 3.0 | 2.0 | 1416 | $2,400 | $1.69 | 43d | 1 | 1.24mi |
| 220 Stonecroft Rd Unit 232-I Baltimore, MD | 2.0 | 1.5 | 900 | $1,295 | $1.44 | 17d | 1 | 1.28mi |
| 220 Stonecroft Rd Unit 230-D Baltimore, MD | 2.0 | 1.5 | 900 | $1,395 | $1.55 | 21d | 1 | 1.28mi |
| 1314 Dorchester Ave Unit B, UPPER LEVEL ONLY Baltimore, MD | 3.0 | 1.0 | 800 | $1,350 | $1.69 | 43d | 1 | 1.29mi |
| 1530 Kirkwood Rd Gwynn Oak, MD | 3.0 | 1.5 | 1424 | $2,100 | $1.47 | 10d | 1 | 1.29mi |
| 5364 Jamestowne Ct Baltimore, MD | 3.0 | 1.0–1.5 | 787 | $1,905 | $2.42 | 4d | 13 | 1.33mi |
| 131 N Bend Rd Unit 131-1B Baltimore, MD | 2.0 | 1.5 | 910 | $1,225 | $1.35 | 21d | 1 | 1.44mi |
| 238 Oglethorpe Rd Catonsville, MD | 2.0 | 1.0 | 968 | $1,650 | $1.70 | 4d | 1 | 1.46mi |
| 1661 N Forest Park Ave Gwynn Oak, MD | 2.0 | 1.0 | 790 | $1,625 | $2.06 | 23d | 1 | 1.49mi |
Listing history 28 events
-
2026-06-18days on market $144,900 Active 167 DOM
-
2026-06-17price $144,900 Active 166 DOM
-
2026-06-17days on market $149,900 Active 166 DOM
-
2026-06-16days on market $149,900 Active 165 DOM
-
2026-06-15days on market $149,900 Active 164 DOM
-
2026-06-13days on market $149,900 Active 162 DOM
-
2026-06-09days on market $149,900 Active 158 DOM
-
2026-06-08days on market $149,900 Active 157 DOM
-
2026-06-07pricedays on market $149,900 Active 156 DOM
-
2026-06-04days on market $154,900 Active 153 DOM
-
2026-06-03days on market $154,900 Active 152 DOM
-
2026-06-02days on market $154,900 Active 151 DOM
-
2026-06-01days on market $154,900 Active 150 DOM
-
2026-05-31days on market $154,900 Active 149 DOM
-
2026-04-04price $154,900 232-char remark
Show marketing remark (232 chars)
INVESTOR ALERT!! Home has fire damage, priced to sell! Cash or Hard Money only. Buyer pays all closing costs including TT & Rs. . Seller strongly prefers the use of New World Title of Lutherville (Mobile closing included in fee)
-
2026-01-15price $159,900 232-char remark
Show marketing remark (232 chars)
INVESTOR ALERT!! Home has fire damage, priced to sell! Cash or Hard Money only. Buyer pays all closing costs including TT & Rs. . Seller strongly prefers the use of New World Title of Lutherville (Mobile closing included in fee)
-
2026-01-02$164,900 Active 232-char remark
Show marketing remark (232 chars)
INVESTOR ALERT!! Home has fire damage, priced to sell! Cash or Hard Money only. Buyer pays all closing costs including TT & Rs. . Seller strongly prefers the use of New World Title of Lutherville (Mobile closing included in fee)
-
2025-12-31historical
-
2025-10-25price $169,900
-
2025-08-27status Active
-
2025-08-27status Pending
-
2025-08-17status Active
-
2025-08-13price $174,900
-
2025-08-13historical
-
2025-08-11status Active
-
2025-08-04historical
-
2025-06-12$179,990 Active
-
1984-11-20soldstatus $45,000
ⓘ Source: listings_history table (triggers on properties + properties_extension) + one-shot
backfill from property_details.listing_events for pre-trigger history.
Tax reassessment forecast MD · Partial reset (capped growth)
- Current annual tax
- $1,681 · $140/mo
- Projected year-2 tax
- $1,681 · $140/mo
- Expected delta
- $0/yr ($0/mo · 0.0%)
ⓘ Screening estimate from a state-policy table — verify with the county assessor before closing.
Climate risk First Street
- Flood 8/10 Severe FEMA zone A · 99% chance over 30 yrs
- Wildfire 2/10 Low
- Heat 6/10 Major 7 d/yr ≥103°F today · 15 d/yr by 30 yrs out
- Wind 4/10 Moderate 18% chance of damaging wind over 30 yrs
- Air quality 3/10 Moderate 3 unhealthy d/yr today · 4 by 30 yrs out
Nearby sold comps map
Loading sold comps map…
Walkable amenities ~0.75 mi
Loading nearby amenities…
Taxation est. · year 1
- Rental income
- $24,580
- − Mortgage interest
- −$8,117
- − Property taxes
- −$1,681
- − Insurance
- −$2,227
- − Repairs & maintenance
- −$1,966
- − Management
- −$1,966
- − Depreciation
- −$4,215
- Taxable income
- $4,407
- Est. tax owed @ 24.0%
- −$1,058
- After-tax cash flow
- $5,334/yr
For passive investors: Depreciation is non-cash, so a rental often shows a tax loss while cash-flowing — sheltering income. Rental losses are passive: they offset passive income freely, and up to $25,000/yr can offset ordinary (W-2) income if you actively participate and your MAGI is under $100k (phasing out to $0 by $150k); unused losses carry forward. On sale, claimed depreciation is recaptured at up to 25%, and gains may owe capital-gains tax (a 1031 exchange can defer both). Figures are a year-1 estimate at your 24.0% rate — not tax advice; consult a CPA.
Schools (NCES district)
- District
- Baltimore County Public Schools
- NCES district ID
- 2400120
- Math proficiency
- 15% ▼ -16.00%
- Reading proficiency
- 34% ▼ -5.00%
- Median HH income
- $66,746
- Composite
- 23.17/100
- National rank
- #7948
- State rank
- #11 of 24 in MD
Livability — Catonsville
- Score
- 81/100
- State rank
- #43
- US rank
- #1586
Category grades
Schools grade is shown separately in the Schools card above.
Census & demographics
- Census place
- Catonsville, MD
- County
- Baltimore County · 769,527 people
- City population
- 50,492
- Metro
- Baltimore-Columbia-Towson, MD
- Population (ZIP)
- 50,492
- Household income
- $112,656
- Rent vs Own
- Severe rent burden
- 1820.0
Population outlook (Baltimore County) Hauer SSP2
- Today (2025)
- 885,518 people
- By 2030
- 909,272 · +2.7%
- By 2040
- 951,547 · +7.5%
- By 2050
- 990,955 · +11.9%
- By 2075
- 1,086,411 · +22.7%
- By 2100
- 1,135,078 · +28.2%
Race, ethnicity, and origin ACS 2023
- Neighborhood character
- Diverse neighborhood (Simpson 0.64)
- Race & ethnicity
- White 55% Black 18% Asian 14% Hispanic / Latino 7% Two or more races 7%
- Hispanic origin (detail)
- Mexican 1%
- Common ancestry
- Romanian 3% Italian 2% Slovak 2%
- Foreign-born
- 16% · Canada, Philippines, Vietnam
- Languages at home
- 81% English-only · Other Indo-European 7% Spanish 5% Other Asian/Pacific 2%
Political lean MEDSL · Baltimore
- 2024 margin
- Strong D (+24.5) · D 61.0% · R 36.5% · Other 2.5%
- 2008→2024 swing
- +9.9pp toward D · 2008: 14.6pp · 2024: 24.5pp
- All cycles
- 2024: D+24.5 2020: D+27.0 2016: D+17.4 2012: D+16.4 2008: D+14.6
Not yet ingested
- Civics
- —
Market trends
- HPI YoY
- ▼ -370.51%
- Current HPI
- 282.1593
- Rent YoY
- ▲ 1.87%
- Metro
- Baltimore-Columbia-Towson, MD
- State GDP YoY
- ▲ 2.97%
- F500 in state
- 12
Industry mix (Fortune 500 HQ in MD)
| Industry | F500 HQs | Revenue |
|---|---|---|
| Aerospace / Defense | 1 | $71B |
|
||
| Utilities | 1 | $25B |
|
||
| Hotels | 1 | $24B |
|
||
| Consumer Goods | 1 | $7B |
|
||
| Real Estate | 1 | $6B |
|
||
| Chemicals | 1 | $2B |
|
||
Price history
+244.2% since first listed14 events — show timeline
- 2026-04-04 Price Changed $154,900 BRIGHT MLS
- 2026-01-15 Price Changed $159,900 BRIGHT MLS
- 2026-01-02 Listed $164,900 BRIGHT MLS
- 2025-12-31 Listing Removed — BRIGHT MLS
- 2025-10-25 Price Changed $169,900 BRIGHT MLS
- 2025-08-27 Relisted — BRIGHT MLS
- 2025-08-27 Pending — BRIGHT MLS
- 2025-08-17 Relisted — BRIGHT MLS
- 2025-08-13 Price Changed $174,900 BRIGHT MLS
- 2025-08-13 Listing Removed — BRIGHT MLS
- 2025-08-11 Relisted — BRIGHT MLS
- 2025-08-04 Listing Removed — BRIGHT MLS
- 2025-06-12 Listed $179,990 BRIGHT MLS
- 1984-11-20 Sold (Public Records) $45,000 Public Records
Property tax history
+0.4%/yrLatest (2025): $1,681 · -75.0% YoY. Source: county tax records.
Cash-flow waterfall
monthlySold comps — $/sqft
last 12 mo · ≤1 miLoading sold comps…