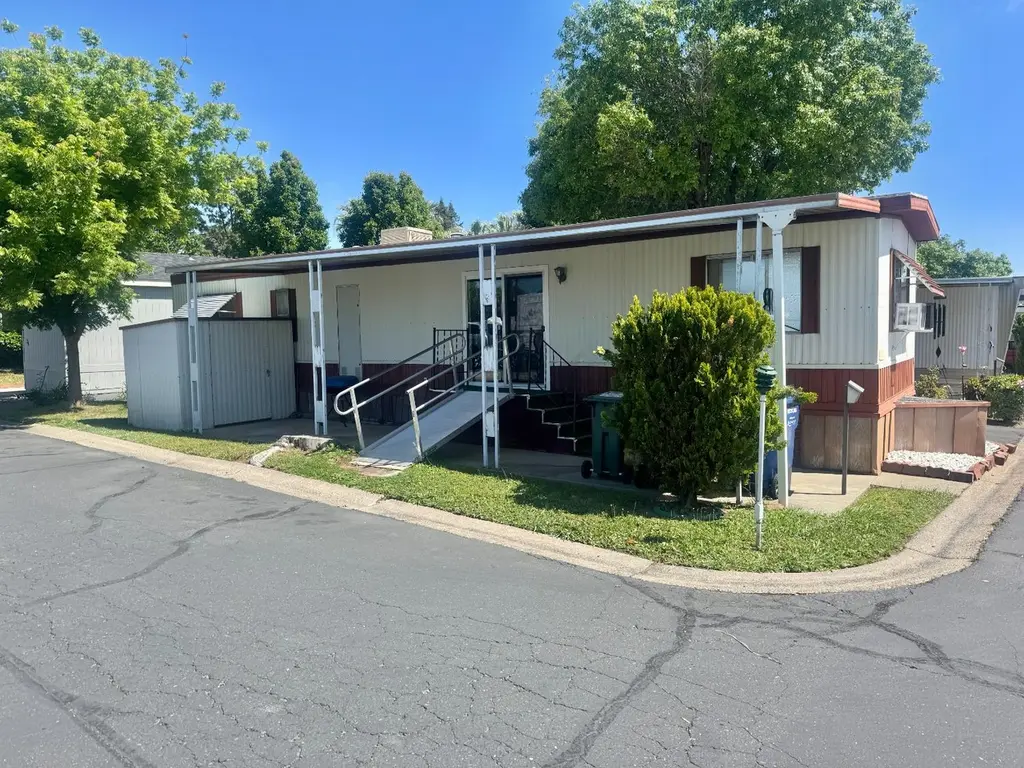
4724 Madison Ave #35 · North Highlands, CA
Flood risk 1/10 · Minimal
- FEMA flood zone
- X (unshaded)
- Chance of flooding over 30 yrs
- 0.0%
- Est. flood insurance / yr
- $507 – $1,088
Fire risk 1/10 · Minimal
- Est. fire insurance / yr
- $659 – $1,223
Heat risk 7/10 · Major
- Hot days now (above 102°F)
- 7 days/yr
- Hot days in 30 yrs
- 16 days/yr
Wind risk 1/10 · Minimal
- Chance of severe wind over 30 yrs
- —
Air-quality risk 10/10 · Severe
- Unhealthy air days now
- 34 days/yr
- Unhealthy air days in 30 yrs
- 38 days/yr
Risk factors via First Street. Map © Google.
Why this score? — see what drove the B- grade
The composite is a weighted blend of 9 inputs, each scored 0–100. Each bar is that input's sub-score; the figure is the points it added to the 100-point composite (weight × sub-score).
- Cash flow +30.0/30.0
- 1% rule +10.0/10.0
- DSCR +10.0/10.0
- ARV discount +6.5/15.0
- Condition / age +3.8/5.0
- Schools +3.1/10.0
- Livability +3.1/5.0
- Rent growth +2.2/5.0
- Appreciation +0.0/10.0
$55,000
🖨 Deal sheet 📄 Offer letter ✓ Due diligence
Listing remarks
Welcome to this inviting mobile home located in the desirable Mark J community, offering a unique blend of manufactured homes and luxury RVs. Situated just off Madison Avenue, this home provides convenient access to shopping, dining, and Hwy 80, making everyday living easy and connected. Set on a peaceful corner lot, this property is one of only eight mobile homes in the community, offering a sense of privacy and exclusivity. Inside, you'll find a bright and comfortable living room featuring a sliding glass door that opens to a covered deck with stairs and a rampperfect for relaxing or enjoying outdoor space. The open-concept kitchen flows seamlessly into the living area, creating a functio
Key facts
- Covered deck
- Open-concept kitchen
- Washer and dryer
Tags
Property features AI
Finance
- Financial info: Land lease amount listed as $1,200 (land lease status: No)
- HOA & community: No association
Exterior
- Parking: Attached covered parking (no garage)
- Utilities: Individual electric meter; Individual gas meter; Public water; Public sewer
- Home design: Manufactured in park, single wide; Built in 1976
- Construction: Metal construction elements (skirt) and metal roof; Manufactured home (Sahara)
- Exterior features: Corner lot; Metal roof; Metal skirting; Single-wide manufactured home in a park (Sahara make)
Interior
- Kitchen: Free standing gas range; Free standing refrigerator; Breakfast area and space for dining
- Bedrooms: One bedroom
- Flooring: Laminate flooring
- Bathrooms: One full bathroom with tub/shower over
- Heating & cooling: Central heating; Evaporative cooler and window unit(s) for cooling
- Interior features: Porch steps and covered porch with porch ramp; Covered patio; Attached deck off the living area; Breakfast nook / breakfast area with synthetic counters; Pets allowed (cats and dogs)
- Laundry & utility: Stacked washer and dryer included inside the home; 220V outlet in laundry area
Neighborhood map
What this means for you Summary
Snapshot
- This is a 1-bed/1.0-bath manufactured listed at $55k. Condition is rated good.
Deal economics
- At list price, monthly cash flow is $793 ($10k/yr) — positive.
- The deal already cash-flows at list — no discount required.
- Meets the 1% rule at list price ($1k rent vs $55k).
- Recommended offer: $54k (1.5% below list) — sets the bar for market timing.
- Cap rate 23.6% vs local median 4.1% in North Highlands — top-decile yield for the area; either an underpriced asset or a hidden risk that comps aren't pricing in. Stress-test before assuming the spread holds.
Location & tenants
- Location reads 61/100 on livability (#523 in CA) — a middle-class / working-renter tenant base. Strengths: housing A+; Watch: employment C-, schools D, crime F.
- Twin Rivers Unified (suburban): math 29% / reading 37% proficiency, ranked #970 of 1,400 in CA (top 69%) — families likely to look elsewhere, expect single-tenant / working-renter base with shorter leases; 76% free/reduced lunch — lower-income household profile, screen leases tightly.
- Market conditions: Rents soft (-1.1%/yr); 83 active listings in the ZIP; 27 comparable units currently listed for rent nearby; rentals leasing fast (median 2d on market — plan ~1-2 weeks tenant-placement turnaround); 6,825 units permitted in Sacramento County in 2024 (1,752 in 5+ unit buildings).
Forward outlook
- Local home prices are declining (-3.0%/yr); year-one equity from $380 of loan paydown is wiped out by about $2k of value loss. Plan a longer hold.
- Sacramento County population projected at +17% by 2050 — long-run rental-demand tailwind backs the buy-and-hold thesis.
- At projected returns (-3.0% appreciation + 0.0% rent growth), your $15k cash investment doubles in ~2 years — after that, you're playing with house money.
Negotiation context
- It's been on market 29 days — a 2% lower offer ($54k) is reasonable based on typical stale-listing flexibility.
Risks & watch-outs
- Climate carrying-cost: extreme-heat days projected 7→16/yr by 2055 (HVAC capex compounding) — expect insurance premiums to compound above CPI over the hold.
Questions for the listing agent
- Built in 1976 — when were the roof, HVAC, electrical panel, plumbing, and water heater last replaced?
- Is there a deadline driving the sale (1031 exchange, divorce, estate, relocation)? That informs how much negotiation room exists.
- Schools are D-rated, which usually means shorter tenancies and higher turnover. Who's the typical renter profile here, and what's been the actual vacancy rate?
- Crime grade is F in this area — have there been break-ins, vandalism, or insurance claims at this property in the last 3 years? What carrier currently insures it and at what premium?
- What's the average days-on-market for RENTAL listings here right now (not sales)? A rising rental-DOM trend means longer vacancies and softer asking-rent achievability than the comps imply.
- What's the recent tenant-quality profile in this submarket — average credit score on applications, eviction rate, late-payment / NSF rate, and stable-employment percentage? A property-management company in the area should have these aggregated.
- How much new for-sale + rental construction is in the pipeline within 1–3 miles? Heavy new supply typically softens prices + rents 12–24 months out; constrained supply supports both.
Investment metrics
- 1% rule
- 2.70% ✓
- Cap rate
- 23.60%
- Cash-on-cash
- 61.81%
- DSCR
- 3.75
- GRM
- 3.1
CMA / ARV
- ARV (median comp)
- $53,755
- List price
- $55,000
- Delta
- 2.32%
- Verdict
- FAIR
- Comps
- 8 within 1.0 mi
Show comp detail 1 sale within ~0.75 mi
| Address | Dist | Beds/Ba | Sqft | Sold | Price | $/sf | Match |
|---|---|---|---|---|---|---|---|
| 5000 Auburn Blvd #21 | 0.40mi | 2/1.0 (+1) | 600 (0%) | 11mo | $55,000 | $92 | 67 |
Match score weights: distance 35% · size 25% · config 20% · recency 20%. Top-matched comps best support the ARV.
Projected returns pro-forma
-3.0% appreciation · 0.0% rent growth · sell at horizon
- IRR
- 57.3%
- Equity multiple
- 3.42×
- Total profit
- $37,277
- Equity at exit
- $8,201
- IRR
- 61.1%
- Equity multiple
- 6.25×
- Total profit
- $80,782
- Equity at exit
- $4,755
Cash invested: $15,400 (down + closing). Projections, not guarantees.
Landlord ↔ Tenant lean methodology
- Overall (STATE)
- 18 Strongly Tenant-Friendly
- State California
- 18 Strongly Tenant-Friendly · D+13
- County
- — inherits STATE
- City
- — inherits STATE
ZIP-level market 95841
- Rents YoY
- -1.1%
- Active inventory
- 83
- Price-to-rent
- 3.1×
Monthly cashflow live
- Estimated rent
- $1,485 high interval (Pro) →
- Mortgage (P&I)
- −$288
- Tax est. 1.5%
- −$69 /mo · $825/yr
- Insurance
- −$23
- HOA
- −$0
- Vacancy / Maint / Mgmt
- −$312
- Net cashflow
- $793
Break-even live
UW: 25.0% down · 7.5% · 30yr · 1.5% tax · 5.0% vac · 8.0% maint · 8.0% mgmt
Financing live
Cash to close
- Down payment
- $13,750
- Closing costs
- $1,650
- Reserves months
- —
- Total cash needed
- —
Loan-product check · same deal, 3 products live
Conventional
25% down · 7.5% · 30yr
- Down + closing
- —
- Monthly P&I
- —
- Monthly cashflow
- —
- DSCR
- —
- Eligible?
- —
Personal DTI + credit; lowest rate.
DSCR
20% down · 8.5% · 30yr
- Down + closing
- —
- Monthly P&I
- —
- Monthly cashflow
- —
- DSCR
- —
- Eligible?
- —
No personal income docs; deal must DSCR.
Hard money
10% down · 12.0% · 12mo
- Down + closing
- —
- Monthly P&I
- —
- Monthly cashflow
- —
- DSCR
- —
- Eligible?
- —
Short-term bridge; refi at stabilization.
Rent comps 27 comps
| Address | Beds | Baths | Sqft | Rent | $/sqft | DOM | Units | Dist |
|---|---|---|---|---|---|---|---|---|
| 4728 Amber Ln Sacramento, CA | 2.0 | 1.0 | 730 | $1,900 | $2.60 | 19d | 1 | 0.17mi |
| 5415 College Oak Dr Sacramento, CA | 1.0–2.0 | 1.0–2.0 | 850 | $1,450 | $1.71 | 1d | 3 | 0.35mi |
| 4901 Little Oak Ln Sacramento, CA | 1.0–3.0 | 1.0–2.0 | 915 | $1,249 | $1.37 | 1d | 7 | 0.40mi |
| 4909 Date Ave Sacramento, CA | 1.0–2.0 | 1.0 | 737 | $1,500 | $2.03 | 43d | 1 | 0.42mi |
| 5443 College Oak Dr Sacramento, CA | 1.0–2.0 | 1.0–2.0 | 821 | $1,575 | $1.92 | 43d | 3 | 0.43mi |
| 4841 Myrtle Ave Sacramento, CA | 1.0 | 1.0 | 600 | $1,350 | $2.25 | 1d | 1 | 0.45mi |
| 4930 College Oak Dr Sacramento, CA | 1.0 | 1.0 | 670 | $1,450 | $2.16 | 1d | 1 | 0.46mi |
| 5341 Walnut Ave Sacramento, CA | 1.0–2.0 | 1.0 | 750 | $1,495 | $1.99 | 1d | 6 | 0.47mi |
| 4806 Myrtle Ave Sacramento, CA | 1.0 | 1.0 | 650 | $1,338 | $2.06 | 43d | 1 | 0.54mi |
| 5119 Hillsdale Blvd Sacramento, CA | 1.0 | 1.0 | 592 | $1,250 | $2.11 | 1d | 1 | 0.63mi |
| 5500 Foothill Garden Ct Sacramento, CA | 1.0 | 1.0 | 750 | $1,472 | $1.96 | 1d | 2 | 0.73mi |
| 4661 Orange Grove Ave Sacramento, CA | 1.0–2.0 | 1.0 | 700 | $1,295 | $1.85 | 23d | 2 | 0.74mi |
| 5226 Hemlock St #35 Sacramento, CA | 1.0 | 1.0 | 682 | $1,650 | $2.42 | 23d | 1 | 0.74mi |
| 5322 Hemlock St Sacramento, CA | 1.0–2.0 | 1.0 | 800 | $1,375 | $1.72 | 1d | 2 | 0.81mi |
| 4215 Palm Ave Sacramento, CA | 1.0–2.0 | 1.0–2.0 | 775 | $1,390 | $1.79 | 1d | 3 | 0.90mi |
| 5425 Garfield Ave Sacramento, CA | 1.0–2.0 | 1.0–2.0 | 787 | $1,299 | $1.65 | 20d | 5 | 0.91mi |
| 5800 Hamilton St Sacramento, CA | 1.0–2.0 | 1.0–2.0 | 823 | $1,465 | $1.78 | 1d | 4 | 0.95mi |
| 5520 Harrison St North Highlands, CA | 2.0 | 1.0 | 735 | $1,478 | $2.01 | 7d | 1 | 0.97mi |
| 5416 Jackson St North Highlands, CA | 1.0–2.0 | 1.0–2.0 | 720 | $1,550 | $2.15 | 1d | 30 | 1.06mi |
| 3800 Madison Ave North Highlands, CA | 2.0 | 1.0 | 524 | $1,350 | $2.58 | 1d | 7 | 1.19mi |
| 5061 Shell St North Highlands, CA | 2.0 | 1.0 | 750 | $2,000 | $2.67 | 1d | 1 | 1.23mi |
| 5501 Keoncrest Cir Unit 1 Sacramento, CA | 2.0 | 1.0 | 750 | $1,300 | $1.73 | 1d | 1 | 1.25mi |
| 5244 Hackberry Ln Sacramento, CA | 2.0 | 1.0 | 712 | $1,712 | $2.41 | 43d | 1 | 1.27mi |
| 5755 Callie Ln Sacramento, CA | 1.0–2.0 | 1.0–2.0 | 723 | $1,600 | $2.21 | 3d | 13 | 1.27mi |
| 4930 Polk St North Highlands, CA | 2.0–3.0 | 1.0–2.0 | 938 | $1,795 | $1.91 | 1d | 3 | 1.31mi |
| 3669 Myrtle Ave North Highlands, CA | 1.0 | 1.0 | 620 | $1,245 | $2.01 | 1d | 2 | 1.43mi |
| 4729 Manzanita Ave Carmichael, CA | 1.0–2.0 | 1.0 | 709 | $1,465 | $2.06 | 4d | 4 | 1.49mi |
Listing history 13 events
-
2026-06-18days on market $55,000 Active 29 DOM
-
2026-06-17days on market $55,000 Active 28 DOM
-
2026-06-16days on market $55,000 Active 27 DOM
-
2026-06-15days on market $55,000 Active 26 DOM
-
2026-06-13days on market $55,000 Active 24 DOM
-
2026-06-13days on market $55,000 Active 23 DOM
-
2026-06-09days on market $55,000 Active 20 DOM
-
2026-06-08days on market $55,000 Active 19 DOM
-
2026-06-07days on market $55,000 Active 18 DOM
-
2026-06-03days on market $55,000 Active 14 DOM
-
2026-06-02days on market $55,000 Active 13 DOM
-
2026-06-01days on market $55,000 Active 12 DOM
-
2026-05-31days on market $55,000 Active 11 DOM
ⓘ Source: listings_history table (triggers on properties + properties_extension) + one-shot
backfill from property_details.listing_events for pre-trigger history.
Climate risk First Street
- Flood 1/10 Low FEMA zone X (unshaded) · 0% chance over 30 yrs
- Wildfire 1/10 Low
- Heat 7/10 Severe 7 d/yr ≥102°F today · 16 d/yr by 30 yrs out
- Wind 1/10 Low
- Air quality 10/10 Extreme 34 unhealthy d/yr today · 38 by 30 yrs out
Nearby sold comps map
Loading sold comps map…
Walkable amenities ~0.75 mi
Loading nearby amenities…
Taxation est. · year 1
- Rental income
- $17,822
- − Mortgage interest
- −$3,081
- − Property taxes
- −$825
- − Insurance
- −$275
- − Repairs & maintenance
- −$1,426
- − Management
- −$1,426
- − Depreciation
- −$1,600
- Taxable income
- $9,190
- Est. tax owed @ 24.0%
- −$2,206
- After-tax cash flow
- $7,313/yr
For passive investors: Depreciation is non-cash, so a rental often shows a tax loss while cash-flowing — sheltering income. Rental losses are passive: they offset passive income freely, and up to $25,000/yr can offset ordinary (W-2) income if you actively participate and your MAGI is under $100k (phasing out to $0 by $150k); unused losses carry forward. On sale, claimed depreciation is recaptured at up to 25%, and gains may owe capital-gains tax (a 1031 exchange can defer both). Figures are a year-1 estimate at your 24.0% rate — not tax advice; consult a CPA.
Condition & rehab AI · 13 photos
This mobile home is in good condition with a good condition score of 75. It has a cosmetic rehab level and requires minor repairs and maintenance. The highest-ROI updates are painting the exterior siding and replacing the bathroom wallpaper to enhance both resale and rental value.
Repairs flagged
- Minor Bathroom wallpaper — Dated wallpaper can be easily replaced with modern options.
Value-add opportunities
- Both Paint exterior siding — Enhances curb appeal and property value.
- Both Replace bathroom wallpaper — Modernizes the space and improves aesthetics.
Renovation cost estimate screening
| Repair item | Severity | Est. cost |
|---|---|---|
| Bathroom wallpaper · Dated wallpaper can be easily replaced with modern options. | Minor | $500–3,000 |
| Total estimated repair cost · 1 items | $500–3,000 |
Value-add ROI direction
- Both Paint exterior siding — Enhances curb appeal and property value. ↑
- Both Replace bathroom wallpaper — Modernizes the space and improves aesthetics. ↑
ⓘ Cost ranges are severity-bucket heuristics (US national rule-of-thumb). Get contractor quotes + a written scope before underwriting a rehab budget.
Schools (NCES district)
- District
- Twin Rivers Unified
- NCES district ID
- 0601332
- Math proficiency
- 29% ▲ 2.00%
- Reading proficiency
- 37% ▲ 2.00%
- Median HH income
- $42,481
- Composite
- 30.67/100
- National rank
- #11437
- State rank
- #970 of 1400 in CA
Livability — North Highlands
- Score
- 61/100
- State rank
- #523
- US rank
- #17613
Category grades
Schools grade is shown separately in the Schools card above.
Census & demographics
- Census place
- North Highlands, CA
- County
- Sacramento County · 1,539,646 people
- City population
- 56,900
- Metro
- Sacramento-Roseville-Folsom, CA
- Population (ZIP)
- 20,500
- Household income
- $61,054
- Rent vs Own
- Severe rent burden
- 1353.0
Population outlook (Sacramento County) Hauer SSP2
- Today (2025)
- 1,660,763 people
- By 2030
- 1,732,990 · +4.3%
- By 2040
- 1,855,755 · +11.7%
- By 2050
- 1,941,335 · +16.9%
- By 2075
- 2,046,162 · +23.2%
- By 2100
- 1,961,444 · +18.1%
Race, ethnicity, and origin ACS 2023
- Neighborhood character
- Diverse neighborhood (Simpson 0.59)
- Race & ethnicity
- White 61% Hispanic / Latino 17% Two or more races 13% Black 9% Asian 6%
- Hispanic origin (detail)
- Mexican 13%
- Common ancestry
- Subsaharan African 5% Scotch-Irish 4% Lithuanian 2%
- Foreign-born
- 24% · Canada, China, Vietnam
- Languages at home
- 70% English-only · Russian/Polish/Slavic 11% Spanish 7% Other Indo-European 5%
Political lean MEDSL · Sacramento
- 2024 margin
- D (+19.7) · D 58.1% · R 38.4% · Other 3.5%
- 2008→2024 swing
- +0.7pp no change · 2008: 19.0pp · 2024: 19.7pp
- All cycles
- 2024: D+19.7 2020: D+25.3 2016: D+23.7 2012: D+16.3 2008: D+19.0
Not yet ingested
- Civics
- —
Market trends
- HPI YoY
- ▼ -227.82%
- Current HPI
- 369.8991
- Rent YoY
- ▼ -1.08%
- Metro
- Sacramento-Roseville-Folsom, CA
- State GDP YoY
- ▲ 3.21%
- F500 in state
- 116
Industry mix (Fortune 500 HQ in CA)
| Industry | F500 HQs | Revenue |
|---|---|---|
| Technology | 27 | $1,492B |
|
||
| Financial Services | 3 | $174B |
|
||
| Retail | 3 | $44B |
|
||
| Insurance | 3 | $26B |
|
||
| Media / Entertainment | 2 | $115B |
|
||
| Pharmaceuticals / Biotech | 2 | $62B |
|
||
Cash-flow waterfall
monthlySold comps — $/sqft
last 12 mo · ≤1 miLoading sold comps…