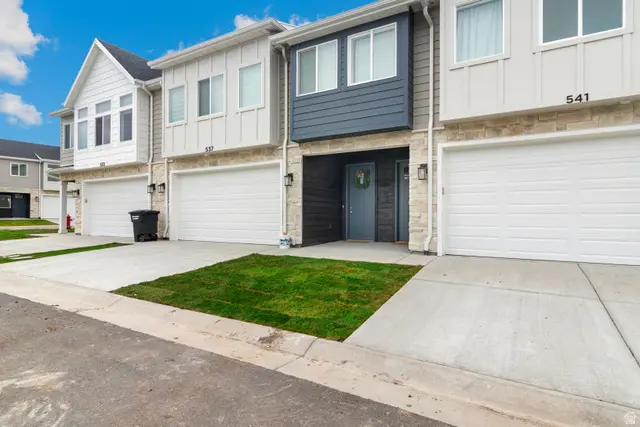
537 N Blue St · Garden City, UT
Flood risk No data
- FEMA flood zone
- —
- Chance of flooding over 30 yrs
- —
- Est. flood insurance / yr
- —
Fire risk No data
- Est. fire insurance / yr
- —
Heat risk No data
- Hot days now (above threshold)
- —
- Hot days in 30 yrs
- —
Wind risk No data
- Chance of severe wind over 30 yrs
- —
Air-quality risk No data
- Unhealthy air days now
- —
- Unhealthy air days in 30 yrs
- —
Risk factors via First Street. Map © Google.
Why this score? — see what drove the B+ grade
The composite is a weighted blend of 9 inputs, each scored 0–100. Each bar is that input's sub-score; the figure is the points it added to the 100-point composite (weight × sub-score).
- Cash flow +30.0/30.0
- 1% rule +10.0/10.0
- DSCR +10.0/10.0
- ARV discount +7.5/15.0
- Appreciation +7.1/10.0
- Condition / age +4.8/5.0
- Schools +4.5/10.0
- Livability +3.2/5.0
- Rent growth +2.5/5.0
$72,250
🖨 Deal sheet 📄 Offer letter ✓ Due diligence
Listing remarks
Welcome to Blue Bear Lake Townhome A Fractional Ownership Vacation Home. Experience the benefits of 1/8 ownership at Blue Bear Lake Townhome, giving you 45 nights per year in this stunning 3-bedroom, 3-bathroom retreat. Located in Garden City, UT, and just minutes from Bear Lake Marina, this 2,075-square-foot townhome offers breathtaking views of Bear Lake's sparkling waters and the surrounding mountains. Designed for family fun and relaxation, the fully equipped home includes game tables for indoor entertainment, while its close proximity to the lake provides endless opportunities for outdoor activities like swimming, boating, and more. Whether you're seeking a peaceful beach day or an ad
Key facts
- Breathtaking views
- $200 HOA
- 2 garage spots
Tags
Property features AI
Finance
- HOA & community: Homeowners association with a $200 monthly fee; Association covers electricity, insurance, and grounds maintenance; Association amenities include picnic area and snow removal
Exterior
- Utilities: Natural gas connected; Electricity connected; Water connected; Sewer connected
- Home design: Townhouse / row-mid style; Built and currently standing; Fractional ownership
- Construction: Above-grade finished area approximately 2065
- Exterior features: Full landscaping; Zoned for single-family use with short-term rentals allowed
Interior
- Bedrooms: Primary bedroom on the 1st floor; 1 main-level bedroom
- Bathrooms: 1 full bathroom; 2 three-quarter bathrooms
- Heating & cooling: Forced air heating; Central air conditioning
- Interior features: Accessible hallway(s); No basement; Total of 11 rooms
Neighborhood map
What this means for you Summary
Snapshot
- This is a 3-bed/3.0-bath townhouse listed at $72k. Condition is rated excellent.
Deal economics
- At list price, monthly cash flow is $388 ($5k/yr) — positive.
- The deal already cash-flows at list — no discount required.
- Meets the 1% rule at list price ($1k rent vs $72k).
Location & tenants
- Location reads 65/100 on livability (#156 in UT) — a middle-class / working-renter tenant base. Strengths: housing A-, crime B, cost of living B; Watch: employment C-, amenities F, commute F.
- Rich District (rural): math 51% / reading 55% proficiency, ranked #16 of 80 in UT (top 20%) — acceptable for families but not a draw, mixed tenant base, ~2y average lease.
- Zoned schools: North Rich School (math 64% / reading 54%, grade B-, #59 of 585 statewide, top 10%, 113 students, 37% FRL); Rich Middle School (math 52% / reading 57%, grade B-, #13 of 138 statewide, top 9%, 123 students, 33% FRL); Rich High (math 30% / reading 50%, grade F, #63 of 171 statewide, top 37%, 156 students, 30% FRL).
- Market conditions: 480 active listings in the ZIP; 97 units permitted in Rich County in 2024 (19 in 5+ unit buildings).
Forward outlook
- In year one you build about $4k of equity ($500 loan paydown + $3k appreciation (4.3% local appreciation)).
- Rich County population projected to shrink 8% by 2050 — rents likely to lag national; underwrite the cash flow, not the appreciation.
- At projected returns (4.3% appreciation + 3.0% rent growth), your $20k cash investment doubles in ~3 years — after that, you're playing with house money.
- By year 9, paydown + projected appreciation supports a ~$31k cash-out refi (75% LTV) — recoverable capital for the next deal without selling this one.
Negotiation context
- Only 14 days on market — expect competitive offers; lowballing is unlikely to land.
- 2 sale attempts; this cycle's ask has dropped $68k (48%) from the opening price — seller is motivated, your offer sets the floor, not the list.
Questions for the listing agent
- What does the HOA fee cover, when was the last increase, and are there any pending special assessments or reserve-fund shortfalls?
- Is there a deadline driving the sale (1031 exchange, divorce, estate, relocation)? That informs how much negotiation room exists.
- What's the average days-on-market for RENTAL listings here right now (not sales)? A rising rental-DOM trend means longer vacancies and softer asking-rent achievability than the comps imply.
- What's the recent tenant-quality profile in this submarket — average credit score on applications, eviction rate, late-payment / NSF rate, and stable-employment percentage? A property-management company in the area should have these aggregated.
- How much new for-sale + rental construction is in the pipeline within 1–3 miles? Heavy new supply typically softens prices + rents 12–24 months out; constrained supply supports both.
Investment metrics
- 1% rule
- 1.90% ✓
- Cap rate
- 12.73%
- Cash-on-cash
- 23.01%
- DSCR
- 2.02
- GRM
- 4.4
CMA / ARV
No comps found within radius.
Projected returns pro-forma
4.28% appreciation · 3.0% rent growth · sell at horizon
- IRR
- 31.7%
- Equity multiple
- 2.91×
- Total profit
- $38,581
- Equity at exit
- $37,839
- IRR
- 30.9%
- Equity multiple
- 5.80×
- Total profit
- $97,061
- Equity at exit
- $62,872
Cash invested: $20,230 (down + closing). Projections, not guarantees.
Landlord ↔ Tenant lean methodology
- Overall (STATE)
- 86 Strongly Landlord-Friendly
- State Utah
- 86 Strongly Landlord-Friendly · R+15
- County
- — inherits STATE
- City
- — inherits STATE
ZIP-level market 84028
- Home prices YoY
- 1.2%
- Active inventory
- 480
- Price-to-rent
- 4.4×
Monthly cashflow live
- Estimated rent
- $1,376 medium interval (Pro) →
- Mortgage (P&I)
- −$379
- Tax est. 1.5%
- −$90 /mo · $1,084/yr
- Insurance
- −$30
- HOA
- −$200
- Vacancy / Maint / Mgmt
- −$289
- Net cashflow
- $388
Break-even live
UW: 25.0% down · 7.5% · 30yr · 1.5% tax · 5.0% vac · 8.0% maint · 8.0% mgmt
Financing live
Cash to close
- Down payment
- $18,062
- Closing costs
- $2,168
- Reserves months
- —
- Total cash needed
- —
Loan-product check · same deal, 3 products live
Conventional
25% down · 7.5% · 30yr
- Down + closing
- —
- Monthly P&I
- —
- Monthly cashflow
- —
- DSCR
- —
- Eligible?
- —
Personal DTI + credit; lowest rate.
DSCR
20% down · 8.5% · 30yr
- Down + closing
- —
- Monthly P&I
- —
- Monthly cashflow
- —
- DSCR
- —
- Eligible?
- —
No personal income docs; deal must DSCR.
Hard money
10% down · 12.0% · 12mo
- Down + closing
- —
- Monthly P&I
- —
- Monthly cashflow
- —
- DSCR
- —
- Eligible?
- —
Short-term bridge; refi at stabilization.
HOA detail
- Monthly dues
- $200 · $2,400/yr
- Likely covers
- water
Listing history 24 events
-
2026-06-19days on market $72,250 Active 14 DOM
-
2026-06-18days on market $72,250 Active 13 DOM
-
2026-06-17days on market $72,250 Active 12 DOM
-
2026-06-16days on market $72,250 Active 11 DOM
-
2026-06-15days on market $72,250 Active 10 DOM
-
2026-06-14days on market $72,250 Active 8 DOM
-
2026-06-13days on market $72,250 Active 7 DOM
-
2026-06-10days on market $72,250 Active 5 DOM
-
2026-06-09days on market $72,250 Active 4 DOM
-
2026-06-08days on market $72,250 Active 3 DOM
-
2026-06-07remarks 699-char remark
-
2026-06-07pricedays on market $72,250 Active 2 DOM
-
2026-06-03days on market $140,000 Active 90 DOM
-
2026-06-02days on market $140,000 Active 89 DOM
-
2026-06-01days on market $140,000 Active 88 DOM
-
2026-05-31days on market $140,000 Active 87 DOM
-
2026-05-30days on market $140,000 Active 86 DOM
-
2026-03-05$140,000 Active
-
2026-01-01historical
-
2025-11-05price $65,000
-
2025-10-07price $135,000
-
2025-08-18price $67,499
-
2025-07-14price $67,500
-
2025-06-03$69,500 Active
ⓘ Source: listings_history table (triggers on properties + properties_extension) + one-shot
backfill from property_details.listing_events for pre-trigger history.
Nearby sold comps map
Loading sold comps map…
Walkable amenities ~0.75 mi
Loading nearby amenities…
Taxation est. · year 1
- Rental income
- $16,514
- − Mortgage interest
- −$4,047
- − Property taxes
- −$1,084
- − Insurance
- −$361
- − Repairs & maintenance
- −$1,321
- − Management
- −$1,321
- − HOA
- −$2,400
- − Depreciation
- −$2,102
- Taxable income
- $3,878
- Est. tax owed @ 24.0%
- −$931
- After-tax cash flow
- $3,724/yr
For passive investors: Depreciation is non-cash, so a rental often shows a tax loss while cash-flowing — sheltering income. Rental losses are passive: they offset passive income freely, and up to $25,000/yr can offset ordinary (W-2) income if you actively participate and your MAGI is under $100k (phasing out to $0 by $150k); unused losses carry forward. On sale, claimed depreciation is recaptured at up to 25%, and gains may owe capital-gains tax (a 1031 exchange can defer both). Figures are a year-1 estimate at your 24.0% rate — not tax advice; consult a CPA.
Condition & rehab AI · 14 photos
This townhouse is in excellent condition with no visible repairs or maintenance needed. It is move-in ready and would benefit from a fresh coat of paint and some landscaping to further enhance its curb appeal.
Value-add opportunities
- Both Painting the exterior siding and repainting the interior walls — Painting the exterior and interior will enhance the curb appeal and interior aesthetics, making the property more attractive to potential buyers and renters.
- Both Landscaping the front yard — Landscaping the front yard will improve the curb appeal and make the property more inviting for potential buyers and renters.
Renovation cost estimate screening
Value-add ROI direction
- Both Painting the exterior siding and repainting the interior walls — Painting the exterior and interior will enhance the curb appeal and interior aesthetics, making the property more attractive to potential buyers and renters. ↑
- Both Landscaping the front yard — Landscaping the front yard will improve the curb appeal and make the property more inviting for potential buyers and renters. ↑
ⓘ Cost ranges are severity-bucket heuristics (US national rule-of-thumb). Get contractor quotes + a written scope before underwriting a rehab budget.
Schools (NCES district)
- District
- Rich District
- NCES district ID
- 4900840
- Math proficiency
- 51% ▼ -3.00%
- Reading proficiency
- 55% ▲ 1.00%
- Median HH income
- $51,144
- Composite
- 45.37/100
- National rank
- #2633
- State rank
- #16 of 80 in UT
Livability — Garden City
- Score
- 65/100
- State rank
- #156
- US rank
- #12941
Category grades
Schools grade is shown separately in the Schools card above.
Census & demographics
- Census place
- Garden City, UT
- Population (ZIP)
- 667
Population outlook (Rich County) Hauer SSP2
- Today (2025)
- 2,278 people
- By 2030
- 2,241 · -1.6%
- By 2040
- 2,142 · -6.0%
- By 2050
- 2,085 · -8.5%
- By 2075
- 1,814 · -20.4%
- By 2100
- 1,530 · -32.8%
Race, ethnicity, and origin ACS 2023
- Neighborhood character
- Predominantly White (76%)
- Race & ethnicity
- White 76% Hispanic / Latino 17% Two or more races 8%
- Hispanic origin (detail)
- Mexican 16%
- Common ancestry
- Italian 17% Portuguese 2% Slovak 1%
- Foreign-born
- 14% · Canada
- Languages at home
- 80% English-only · Spanish 18% German/W. Germanic 1%
Political lean MEDSL · Rich
- 2024 margin
- Solid R (+68.9) · D 14.8% · R 83.7% · Other 1.5%
- 2008→2024 swing
- -1.6pp toward R · 2008: -67.3pp · 2024: -68.9pp
- All cycles
- 2024: R+68.9 2020: R+71.7 2016: R+62.2 2012: R+82.5 2008: R+67.3
Not yet ingested
- Civics
- —
Market trends
- HPI YoY
- ▲ 4.28%
- Current HPI
- 347.1291
- Rent YoY
- —
- Metro
- —
- State GDP YoY
- ▲ 3.54%
- F500 in state
- 2
Industry mix (Fortune 500 HQ in UT)
| Industry | F500 HQs | Revenue |
|---|---|---|
| Financial Services | 1 | $3B |
|
||
Price history
+101.4% since first listed7 events — show timeline
- 2026-03-05 Listed $140,000 WFRMLS
- 2026-01-01 Listing Removed — WFRMLS
- 2025-11-05 Price Changed $65,000 WFRMLS
- 2025-10-07 Price Changed $135,000 WFRMLS
- 2025-08-18 Price Changed $67,499 WFRMLS
- 2025-07-14 Price Changed $67,500 WFRMLS
- 2025-06-03 Listed $69,500 WFRMLS
Cash-flow waterfall
monthlySold comps — $/sqft
last 12 mo · ≤1 miLoading sold comps…