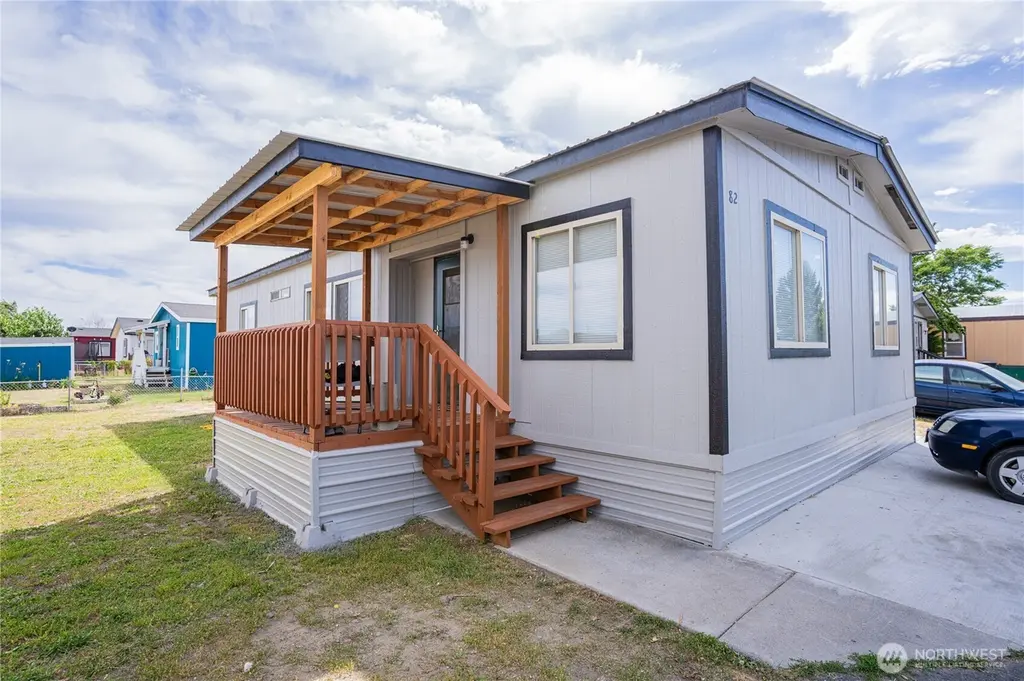
4000 Longview St NE #82 · Moses Lake, WA
Flood risk 1/10 · Minimal
- FEMA flood zone
- X (unshaded)
- Chance of flooding over 30 yrs
- 0.0%
- Est. flood insurance / yr
- $507 – $1,088
Fire risk 3/10 · Minor
- Est. fire insurance / yr
- $604 – $1,122
Heat risk 4/10 · Minor
- Hot days now (above 96°F)
- 7 days/yr
- Hot days in 30 yrs
- 16 days/yr
Wind risk 1/10 · Minimal
- Chance of severe wind over 30 yrs
- —
Air-quality risk 7/10 · Major
- Unhealthy air days now
- 12 days/yr
- Unhealthy air days in 30 yrs
- 14 days/yr
Risk factors via First Street. Map © Google.
Why this score? — see what drove the B+ grade
The composite is a weighted blend of 9 inputs, each scored 0–100. Each bar is that input's sub-score; the figure is the points it added to the 100-point composite (weight × sub-score).
- Cash flow +30.0/30.0
- ARV discount +15.0/15.0
- 1% rule +10.0/10.0
- DSCR +10.0/10.0
- Schools +3.9/10.0
- Livability +3.8/5.0
- Condition / age +2.5/5.0
- Rent growth +2.1/5.0
- Appreciation +0.0/10.0
$79,999
🖨 Deal sheet 📄 Offer letter ✓ Due diligence
Listing remarks
Beautifully updated 3 bed 2 bath home in Desert Oasis Park. Home features all new flooring, paint inside and out, kitchen, covered patio and more. Bathroom off primary bedroom, separate utility room. Open concept kitchen and living area. Metal roof. Jump on this deal before it's gone! Call today to schedule a showing. Lot rent includes WSG and is approx $574.33/mo depending on buyers credit. Pets are allowed, however there are size/breed restrictions. park application and approval needed before accepting offer.
Key facts
- Open concept kitchen
- Metal roof
- Updated paint
Tags
Neighborhood map
What this means for you Summary
Snapshot
- This is a 3-bed/2.0-bath manufactured listed at $80k.
Deal economics
- At list price, monthly cash flow is $881 ($11k/yr) — positive.
- The deal already cash-flows at list — no discount required.
- Meets the 1% rule at list price ($2k rent vs $80k).
- Recommended offer: $70k (12.0% below list) — sets the bar for market timing.
- Cap rate 19.5% vs local median 3.3% in Moses Lake — top-decile yield for the area; either an underpriced asset or a hidden risk that comps aren't pricing in. Stress-test before assuming the spread holds.
Location & tenants
- Location reads 75/100 on livability (#170 in WA, #4,228 nationally) — a middle-class / working-renter tenant base. Strengths: housing A+, health & safety A+, amenities A-; Watch: employment C-, schools D+, crime F.
- Moses Lake School District (town): math 38% / reading 48% proficiency, ranked #198 of 291 in WA (top 68%) — families likely to look elsewhere, expect single-tenant / working-renter base with shorter leases.
- Market conditions: Rents soft (-1.7%/yr); 585 active listings in the ZIP; 12 comparable units currently listed for rent nearby; rentals lingering (median 44d on market — plan ~5-8 weeks vacancy on turnover, expect pricing pressure); 100% of comp listings sitting > 30 days — soft ceiling on asking rent; 559 units permitted in Grant County in 2024 (35 in 5+ unit buildings).
Forward outlook
- Local home prices are declining (-3.0%/yr); year-one equity from $553 of loan paydown is wiped out by about $2k of value loss. Plan a longer hold.
- Grant County population projected at +16% by 2050 — long-run rental-demand tailwind backs the buy-and-hold thesis.
- At projected returns (-3.0% appreciation + 0.0% rent growth), your $22k cash investment doubles in ~3 years — after that, you're playing with house money.
Negotiation context
- It's been on market 323 days — a 12% lower offer ($70k) is reasonable based on typical stale-listing flexibility.
- 3 sale attempts; this cycle's ask has dropped $40k (33%) from the opening price — seller is motivated, your offer sets the floor, not the list.
Questions for the listing agent
- It's been on market 323 days. Have you received any prior offers? Is the seller open to a 12% concession, seller financing, or rate buy-down credit?
- Built in 1978 — when were the roof, HVAC, electrical panel, plumbing, and water heater last replaced?
- Why hasn't it sold? Are there any deal-killer items the seller is aware of (foundation, flood, title, zoning, code violations)?
- Is there a deadline driving the sale (1031 exchange, divorce, estate, relocation)? That informs how much negotiation room exists.
- Schools are D-rated, which usually means shorter tenancies and higher turnover. Who's the typical renter profile here, and what's been the actual vacancy rate?
- Crime grade is F in this area — have there been break-ins, vandalism, or insurance claims at this property in the last 3 years? What carrier currently insures it and at what premium?
- What's the average days-on-market for RENTAL listings here right now (not sales)? A rising rental-DOM trend means longer vacancies and softer asking-rent achievability than the comps imply.
- What's the recent tenant-quality profile in this submarket — average credit score on applications, eviction rate, late-payment / NSF rate, and stable-employment percentage? A property-management company in the area should have these aggregated.
- How much new for-sale + rental construction is in the pipeline within 1–3 miles? Heavy new supply typically softens prices + rents 12–24 months out; constrained supply supports both.
Investment metrics
- 1% rule
- 2.22% ✓
- Cap rate
- 19.51%
- Cash-on-cash
- 47.19%
- DSCR
- 3.10
- GRM
- 3.8
CMA / ARV
- ARV (median comp)
- $110,000
- List price
- $79,999
- Delta
- -27.27%
- Verdict
- UNDERPRICED
- Comps
- 2 within 1.0 mi
Show comp detail 6 sales within ~0.75 mi
| Address | Dist | Beds/Ba | Sqft | Sold | Price | $/sf | Match |
|---|---|---|---|---|---|---|---|
| 4000 Longview St NE #42 | 0.09mi | 3/2.0 | 1,456 (+6%) | 3mo | $105,000 | $72 | 84 |
| 4000 Longview St NE #65 | 0.09mi | 3/2.0 | 1,456 (+6%) | 19mo | $116,950 | $80 | 70 |
| 4000 Longview St NE #68 | 0.07mi | 4/2.0 (+1) | 1,536 (+12%) | 12mo | $130,000 | $85 | 62 |
| 900 N Grape Dr #16 | 0.75mi | 3/2.0 | 1,344 (-2%) | 17mo | $78,000 | $58 | 47 |
| 900 N Grape Dr Unit 67-B | 0.75mi | 3/2.0 | 1,216 (-12%) | 1mo | $115,000 | $95 | 45 |
| 900 N Grape Dr #66 | 0.68mi | 3/2.0 | 1,296 (-6%) | 21mo | $108,000 | $83 | 41 |
Match score weights: distance 35% · size 25% · config 20% · recency 20%. Top-matched comps best support the ARV.
Projected returns pro-forma
-3.0% appreciation · 0.0% rent growth · sell at horizon
- IRR
- 41.2%
- Equity multiple
- 2.69×
- Total profit
- $37,940
- Equity at exit
- $11,928
- IRR
- 46.0%
- Equity multiple
- 4.80×
- Total profit
- $85,190
- Equity at exit
- $6,917
Cash invested: $22,400 (down + closing). Projections, not guarantees.
Landlord ↔ Tenant lean methodology
- Overall (STATE)
- 28 Tenant-Leaning
- State Washington
- 28 Tenant-Leaning · D+8
- County
- — inherits STATE
- City
- — inherits STATE
ZIP-level market 98837
- Rents YoY
- -1.7%
- Active inventory
- 585
- Price-to-rent
- 3.8×
Monthly cashflow live
- Estimated rent
- $1,777 high interval (Pro) →
- Mortgage (P&I)
- −$420
- Tax from tax record
- −$70 /mo · $837/yr
- Insurance
- −$33
- HOA
- −$0
- Vacancy / Maint / Mgmt
- −$373
- Net cashflow
- $881
Break-even live
UW: 25.0% down · 7.5% · 30yr · 1.5% tax · 5.0% vac · 8.0% maint · 8.0% mgmt
Financing live
Cash to close
- Down payment
- $20,000
- Closing costs
- $2,400
- Reserves months
- —
- Total cash needed
- —
Loan-product check · same deal, 3 products live
Conventional
25% down · 7.5% · 30yr
- Down + closing
- —
- Monthly P&I
- —
- Monthly cashflow
- —
- DSCR
- —
- Eligible?
- —
Personal DTI + credit; lowest rate.
DSCR
20% down · 8.5% · 30yr
- Down + closing
- —
- Monthly P&I
- —
- Monthly cashflow
- —
- DSCR
- —
- Eligible?
- —
No personal income docs; deal must DSCR.
Hard money
10% down · 12.0% · 12mo
- Down + closing
- —
- Monthly P&I
- —
- Monthly cashflow
- —
- DSCR
- —
- Eligible?
- —
Short-term bridge; refi at stabilization.
Rent comps 12 comps
| Address | Beds | Baths | Sqft | Rent | $/sqft | DOM | Units | Dist |
|---|---|---|---|---|---|---|---|---|
| 4208 Stratford Rd NE Moses Lake, WA | 3.0 | 1.0 | 1440 | $1,495 | $1.04 | 43d | 1 | 0.19mi |
| 9436 Beacon Rd NE Moses Lake, WA | 2.0 | 1.0 | 1181 | $1,295 | $1.10 | 43d | 1 | 0.32mi |
| 1005 W Sequoia Rd Moses Lake, WA | 3.0 | 2.5 | 1743 | $2,095 | $1.20 | 43d | 1 | 0.52mi |
| 1013 W Maple Dr Moses Lake, WA | 3.0 | 2.0 | 1450 | $1,875 | $1.29 | 43d | 1 | 0.59mi |
| 1133 N Grape Dr Moses Lake, WA | 1.0–2.0 | 1.0–2.0 | 859 | $1,825 | $2.12 | 43d | 12 | 0.61mi |
| 1118 W Sequoia Rd Moses Lake, WA | 3.0 | 2.0 | 1235 | $2,000 | $1.62 | 43d | 1 | 0.63mi |
| 606 W Crest Dr Moses Lake, WA | 2.0 | 2.0 | 1200 | $1,800 | $1.50 | 43d | 1 | 0.70mi |
| 1903 Hickory Rd Moses Lake, WA | 3.0 | 2.5 | 1743 | $2,450 | $1.41 | 43d | 1 | 0.73mi |
| 1013 N Pierce Dr Apt B Moses Lake, WA | 3.0 | 2.0 | 1200 | $1,695 | $1.41 | 43d | 1 | 0.75mi |
| 422 N Washington St Moses Lake, WA | 3.0 | 2.0 | 1166 | $2,200 | $1.89 | 43d | 1 | 0.99mi |
| 4727 Owens Rd NE #24 Moses Lake, WA | 2.0 | 1.0 | 900 | $1,200 | $1.33 | 43d | 1 | 1.18mi |
| 215 N Wellington St Moses Lake, WA | 3.0 | 2.0 | 1550 | $2,200 | $1.42 | 43d | 1 | 1.35mi |
Listing history 32 events
-
2026-06-19days on market $79,999 Active 323 DOM
-
2026-06-18days on market $79,999 Active 322 DOM
-
2026-06-17days on market $79,999 Active 321 DOM
-
2026-06-16days on market $79,999 Active 320 DOM
-
2026-06-15days on market $79,999 Active 319 DOM
-
2026-06-14days on market $79,999 Active 317 DOM
-
2026-06-13remarks 516-char remark
-
2026-06-13days on market $79,999 Active 316 DOM
-
2026-06-10days on market $79,999 Active 314 DOM
-
2026-06-09days on market $79,999 Active 313 DOM
-
2026-06-08days on market $79,999 Active 312 DOM
-
2026-06-07days on market $79,999 Active 311 DOM
-
2026-06-05days on market $79,999 Active 308 DOM
-
2026-06-03days on market $79,999 Active 307 DOM
-
2026-06-02days on market $79,999 Active 306 DOM
-
2026-06-01days on market $79,999 Active 305 DOM
-
2026-05-31days on market $79,999 Active 304 DOM
-
2026-05-30days on market $79,999 Active 303 DOM
-
2026-05-19price $79,999
-
2026-05-10status Active
-
2026-04-28status Pending
-
2026-04-21price $81,999
-
2026-04-03price $86,999
-
2026-02-16price $88,999
-
2026-01-29price $89,999
-
2026-01-09price $94,999
-
2026-01-09status Active
-
2025-11-19price $99,999
-
2025-10-20price $104,999
-
2025-08-28price $109,999
-
2025-07-31price $114,999
-
2025-07-10$119,999 Active
ⓘ Source: listings_history table (triggers on properties + properties_extension) + one-shot
backfill from property_details.listing_events for pre-trigger history.
Tax reassessment forecast WA · Resets to sale price
- Current annual tax
- $837 · $70/mo
- Projected year-2 tax
- $837 · $70/mo
- Expected delta
- $0/yr ($0/mo · 0.0%)
ⓘ Screening estimate from a state-policy table — verify with the county assessor before closing.
Climate risk First Street
- Flood 1/10 Low FEMA zone X (unshaded) · 0% chance over 30 yrs
- Wildfire 3/10 Moderate
- Heat 4/10 Moderate 7 d/yr ≥96°F today · 16 d/yr by 30 yrs out
- Wind 1/10 Low
- Air quality 7/10 Severe 12 unhealthy d/yr today · 14 by 30 yrs out
Nearby sold comps map
Loading sold comps map…
Walkable amenities ~0.75 mi
Loading nearby amenities…
Taxation est. · year 1
- Rental income
- $21,319
- − Mortgage interest
- −$4,481
- − Property taxes
- −$837
- − Insurance
- −$400
- − Repairs & maintenance
- −$1,705
- − Management
- −$1,705
- − Depreciation
- −$2,327
- Taxable income
- $9,862
- Est. tax owed @ 24.0%
- −$2,367
- After-tax cash flow
- $8,203/yr
For passive investors: Depreciation is non-cash, so a rental often shows a tax loss while cash-flowing — sheltering income. Rental losses are passive: they offset passive income freely, and up to $25,000/yr can offset ordinary (W-2) income if you actively participate and your MAGI is under $100k (phasing out to $0 by $150k); unused losses carry forward. On sale, claimed depreciation is recaptured at up to 25%, and gains may owe capital-gains tax (a 1031 exchange can defer both). Figures are a year-1 estimate at your 24.0% rate — not tax advice; consult a CPA.
Schools (NCES district)
- District
- Moses Lake School District
- NCES district ID
- 5305220
- Math proficiency
- 38% ▬ 0.00%
- Reading proficiency
- 48% ▼ -1.00%
- Median HH income
- $49,033
- Composite
- 39.17/100
- National rank
- #8232
- State rank
- #198 of 291 in WA
Livability — Moses Lake
- Score
- 75/100
- State rank
- #170
- US rank
- #4228
Category grades
Schools grade is shown separately in the Schools card above.
Census & demographics
- Census place
- Moses Lake, WA
- County
- Grant County · 61,643 people
- City population
- 49,455
- Metro
- Moses Lake, WA
- Population (ZIP)
- 49,455
- Household income
- $74,586
- Rent vs Own
- Severe rent burden
- 1064.0
Population outlook (Grant County) Hauer SSP2
- Today (2025)
- 99,356 people
- By 2030
- 102,107 · +2.8%
- By 2040
- 108,318 · +9.0%
- By 2050
- 114,712 · +15.5%
- By 2075
- 131,376 · +32.2%
- By 2100
- 146,163 · +47.1%
Race, ethnicity, and origin ACS 2023
- Neighborhood character
- Diverse neighborhood (Simpson 0.55)
- Race & ethnicity
- White 58% Hispanic / Latino 33% Two or more races 15% Black 2% Asian 1%
- Hispanic origin (detail)
- Mexican 30%
- Common ancestry
- Portuguese 3% Subsaharan African 2% Lithuanian 2%
- Foreign-born
- 10% · Canada
- Languages at home
- 76% English-only · Spanish 21% Russian/Polish/Slavic 2%
Political lean MEDSL · Grant
- 2024 margin
- Solid R (+37.5) · D 30.0% · R 67.4% · Other 2.6%
- 2008→2024 swing
- -9.9pp toward R · 2008: -27.5pp · 2024: -37.5pp
- All cycles
- 2024: R+37.5 2020: R+34.4 2016: R+37.9 2012: R+32.6 2008: R+27.5
Not yet ingested
- Civics
- —
Market trends
- HPI YoY
- ▼ -384.29%
- Current HPI
- 208.4574
- Rent YoY
- ▼ -1.72%
- Metro
- Moses Lake, WA
- State GDP YoY
- ▲ 4.65%
- F500 in state
- 22
Industry mix (Fortune 500 HQ in WA)
| Industry | F500 HQs | Revenue |
|---|---|---|
| Retail | 2 | $269B |
|
||
| Technology / Retail | 1 | $638B |
|
||
| Technology | 1 | $245B |
|
||
| Telecommunications | 1 | $38B |
|
||
| Food / Beverage | 1 | $36B |
|
||
| Automotive / Trucks | 1 | $34B |
|
||
Price history
-33.3% since first listed14 events — show timeline
- 2026-05-19 Price Changed $79,999 NWMLS as Distributed by MLS Grid
- 2026-05-10 Relisted — NWMLS as Distributed by MLS Grid
- 2026-04-28 Pending — NWMLS as Distributed by MLS Grid
- 2026-04-21 Price Changed $81,999 NWMLS as Distributed by MLS Grid
- 2026-04-03 Price Changed $86,999 NWMLS as Distributed by MLS Grid
- 2026-02-16 Price Changed $88,999 NWMLS as Distributed by MLS Grid
- 2026-01-29 Price Changed $89,999 NWMLS as Distributed by MLS Grid
- 2026-01-09 Price Changed $94,999 NWMLS as Distributed by MLS Grid
- 2026-01-09 Relisted — NWMLS as Distributed by MLS Grid
- 2025-11-19 Price Changed $99,999 NWMLS as Distributed by MLS Grid
- 2025-10-20 Price Changed $104,999 NWMLS as Distributed by MLS Grid
- 2025-08-28 Price Changed $109,999 NWMLS as Distributed by MLS Grid
- 2025-07-31 Price Changed $114,999 NWMLS as Distributed by MLS Grid
- 2025-07-10 Listed $119,999 NWMLS as Distributed by MLS Grid
Property tax history
+2.3%/yrLatest (2026): $837 · +0.0% YoY. Source: county tax records.
Cash-flow waterfall
monthlySold comps — $/sqft
last 12 mo · ≤1 miLoading sold comps…