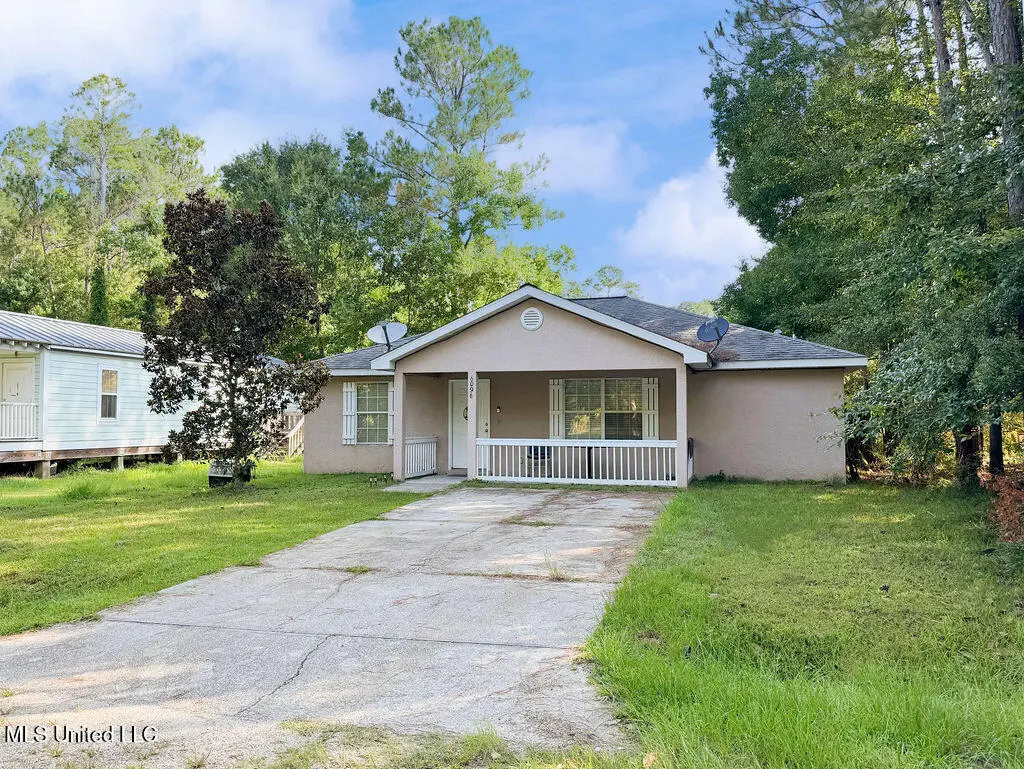
6096 W Chickasaw St · Waveland, MS
Flood risk 5/10 · Moderate
- FEMA flood zone
- AE
- Chance of flooding over 30 yrs
- 0.4%
- Est. flood insurance / yr
- $1,737 – $8,500
Fire risk 3/10 · Minor
- Est. fire insurance / yr
- $1,241 – $2,305
Heat risk 10/10 · Severe
- Hot days now (above 107°F)
- 7 days/yr
- Hot days in 30 yrs
- 21 days/yr
Wind risk 10/10 · Severe
- Chance of severe wind over 30 yrs
- 99.0%
Air-quality risk 1/10 · Minimal
- Unhealthy air days now
- 0 days/yr
- Unhealthy air days in 30 yrs
- 0 days/yr
Risk factors via First Street. Map © Google.
Why this score? — see what drove the C+ grade
The composite is a weighted blend of 9 inputs, each scored 0–100. Each bar is that input's sub-score; the figure is the points it added to the 100-point composite (weight × sub-score).
- Cash flow +27.7/30.0
- DSCR +9.7/10.0
- 1% rule +6.4/10.0
- ARV discount +6.1/15.0
- Schools +3.9/10.0
- Livability +3.1/5.0
- Rent growth +2.5/5.0
- Condition / age +2.5/5.0
- Appreciation +0.0/10.0
$125,900
🖨 Deal sheet 📄 Offer letter ✓ Due diligence
Listing remarks MLS
Neat and clean home! Offers 3b/2b with a nice open kitchen and living area with a big kitchen. A fenced back yard completes the picture. Great starter home or rental home.
Key facts
- 4,791 sq ft lot
- 2 parking spots
- Built 2008
Neighborhood map
What this means for you Summary
Snapshot
- This is a 3-bed/2.0-bath single-family listed at $126k.
Deal economics
- At list price, monthly cash flow is $-47 ($-566/yr) — negative.
- To cash-flow at today's rent, offer at most $118k (6.6% below list).
- Meets the 1% rule at list price ($1k rent vs $126k).
- Recommended offer: $111k (12.0% below list) — sets the bar for market timing.
- Cap rate 9.9% vs local median 2.5% in Waveland — top-decile yield for the area; either an underpriced asset or a hidden risk that comps aren't pricing in. Stress-test before assuming the spread holds.
Location & tenants
- Location reads 61/100 on livability (#199 in MS) — a middle-class / working-renter tenant base. Strengths: cost of living A+, housing A+, health & safety A+; Watch: schools F, amenities F, commute F.
- Hancock County School District (rural): math 47% / reading 44% proficiency, ranked #23 of 130 in MS (top 18%) — families likely to look elsewhere, expect single-tenant / working-renter base with shorter leases.
- Market conditions: 601 active listings in the ZIP; 6 comparable units currently listed for rent nearby; rentals lingering (median 44d on market — plan ~5-8 weeks vacancy on turnover, expect pricing pressure); 50% of comp listings sitting > 30 days — soft ceiling on asking rent; 248 units permitted in Hancock County in 2024 (0 in 5+ unit buildings).
Forward outlook
- Local home prices are declining (-3.0%/yr); year-one equity from $870 of loan paydown is wiped out by about $4k of value loss. Plan a longer hold.
- Hancock County population projected at +20% by 2050 — long-run rental-demand tailwind backs the buy-and-hold thesis.
Negotiation context
- It's been on market 337 days — a 12% lower offer ($111k) is reasonable based on typical stale-listing flexibility.
- 2 sale attempts since 4y ago with the ask held roughly flat each time — persistent listings suggest the price (not the market) is what's stuck; bring a comps-based counter.
Risks & watch-outs
- Watch-outs: flood insurance adds $427/mo.
- Climate carrying-cost: in FEMA flood zone AE (mandatory federal flood insurance); severe wind risk, 99% chance of damaging wind over 30y; extreme-heat days projected 7→21/yr by 2055 (HVAC capex compounding) — expect insurance premiums to compound above CPI over the hold.
Questions for the listing agent
- What do current leases actually rent for vs. the listed asking? Can we see a recent rent roll and the last 12 months of T-12 income?
- It's been on market 337 days. Have you received any prior offers? Is the seller open to a 12% concession, seller financing, or rate buy-down credit?
- What's the actual annual flood-insurance premium (NFIP or private), and is the property in a SFHA with mandatory coverage?
- Why hasn't it sold? Are there any deal-killer items the seller is aware of (foundation, flood, title, zoning, code violations)?
- Is there a deadline driving the sale (1031 exchange, divorce, estate, relocation)? That informs how much negotiation room exists.
- Schools are F-rated, which usually means shorter tenancies and higher turnover. Who's the typical renter profile here, and what's been the actual vacancy rate?
- What's the average days-on-market for RENTAL listings here right now (not sales)? A rising rental-DOM trend means longer vacancies and softer asking-rent achievability than the comps imply.
- What's the recent tenant-quality profile in this submarket — average credit score on applications, eviction rate, late-payment / NSF rate, and stable-employment percentage? A property-management company in the area should have these aggregated.
- How much new for-sale + rental construction is in the pipeline within 1–3 miles? Heavy new supply typically softens prices + rents 12–24 months out; constrained supply supports both.
Investment metrics
- 1% rule
- 1.14% ✓
- Cap rate
- 9.91%
- Cash-on-cash
- 12.91%
- DSCR
- 1.57
- GRM
- 7.3
CMA / ARV
- ARV (median comp)
- $122,046
- List price
- $125,900
- Delta
- 3.16%
- Verdict
- FAIR
- Comps
- 20 within 1.0 mi
Show comp detail 12 sales within ~0.75 mi
| Address | Dist | Beds/Ba | Sqft | Sold | Price | $/sf | Match |
|---|---|---|---|---|---|---|---|
| 6098 W Ridley St | 0.16mi | 3/2.0 | 1,320 (0%) | 1mo | $119,995 | $91 | 91 |
| 7051 George St | 0.19mi | 3/2.0 | 1,320 (0%) | 9mo | $109,900 | $83 | 84 |
| 6263 E Newton St | 0.45mi | 3/2.0 | 1,296 (-2%) | 1mo | $129,900 | $100 | 75 |
| 6182 W Jackson St | 0.52mi | 3/2.0 | 1,320 (0%) | 5mo | $105,300 | $80 | 72 |
| 7054 W Perry St | 0.51mi | 3/2.0 | 1,298 (-2%) | 6mo | $132,500 | $102 | 68 |
| 6141 W Jackson St | 0.52mi | 3/2.0 | 1,297 (-2%) | 6mo | $119,900 | $92 | 68 |
| 6125 E Madison St | 0.69mi | 3/2.0 | 1,320 (0%) | 4mo | $84,500 | $64 | 64 |
| 6201 E Jackson St | 0.65mi | 3/2.0 | 1,320 (0%) | 7mo | $129,995 | $98 | 64 |
| 6123 W Lamar St | 0.43mi | 4/2.0 (+1) | 1,398 (+6%) | 4mo | $124,900 | $89 | 62 |
| 6072 E Jones St | 0.48mi | 3/2.0 | 1,450 (+10%) | 0mo | $133,995 | $92 | 61 |
| 6101 E Quitman St | 0.71mi | 3/2.0 | 1,344 (+2%) | 6mo | $139,000 | $103 | 59 |
| 6195 E Jackson St | 0.66mi | 3/2.0 | 1,195 (-10%) | 4mo | $123,900 | $104 | 50 |
Match score weights: distance 35% · size 25% · config 20% · recency 20%. Top-matched comps best support the ARV.
Projected returns pro-forma
-3.0% appreciation · 3.0% rent growth · sell at horizon
- IRR
- -18.7%
- Equity multiple
- 0.34×
- Total profit
- $-23,194
- Equity at exit
- $18,772
- IRR
- -10.8%
- Equity multiple
- 0.34×
- Total profit
- $-23,208
- Equity at exit
- $10,886
Cash invested: $35,252 (down + closing). Projections, not guarantees.
Landlord ↔ Tenant lean methodology
- Overall (STATE)
- 90 Strongly Landlord-Friendly
- State Mississippi
- 90 Strongly Landlord-Friendly · R+11
- County
- — inherits STATE
- City
- — inherits STATE
ZIP-level market 39520
- Active inventory
- 601
- Price-to-rent
- 7.3×
Monthly cashflow live
- Estimated rent
- $1,432 high interval (Pro) →
- Mortgage (P&I)
- −$660
- Tax from tax record
- −$39 /mo · $473/yr
- Insurance
- −$52
- Flood insurance flood zone
- −$427 /mo · $5,118/yr
- HOA
- −$0
- Vacancy / Maint / Mgmt
- −$301
- Net cashflow
- $-47
Break-even live
UW: 25.0% down · 7.5% · 30yr · 1.5% tax · 5.0% vac · 8.0% maint · 8.0% mgmt
Financing live
Cash to close
- Down payment
- $31,475
- Closing costs
- $3,777
- Reserves months
- —
- Total cash needed
- —
Loan-product check · same deal, 3 products live
Conventional
25% down · 7.5% · 30yr
- Down + closing
- —
- Monthly P&I
- —
- Monthly cashflow
- —
- DSCR
- —
- Eligible?
- —
Personal DTI + credit; lowest rate.
DSCR
20% down · 8.5% · 30yr
- Down + closing
- —
- Monthly P&I
- —
- Monthly cashflow
- —
- DSCR
- —
- Eligible?
- —
No personal income docs; deal must DSCR.
Hard money
10% down · 12.0% · 12mo
- Down + closing
- —
- Monthly P&I
- —
- Monthly cashflow
- —
- DSCR
- —
- Eligible?
- —
Short-term bridge; refi at stabilization.
Rent comps 6 comps
| Address | Beds | Baths | Sqft | Rent | $/sqft | DOM | Units | Dist |
|---|---|---|---|---|---|---|---|---|
| 8016 Lowndes St Bay St Louis, MS | 3.0 | 2.0 | 1083 | $1,250 | $1.15 | 14d | 1 | 0.27mi |
| 6227 E Newton St Bay St Louis, MS | 3.0 | 2.0 | 1064 | $1,450 | $1.36 | 44d | 1 | 0.50mi |
| 6225 E Newton St Bay Saint Louis, MS | 3.0 | 2.0 | 1064 | $1,450 | $1.36 | 11d | 1 | 0.51mi |
| 6095 E Lamar St Bay Saint Louis, MS | 3.0 | 2.0 | 1392 | $1,645 | $1.18 | 44d | 1 | 0.79mi |
| 7132 Sunflower St Bay Saint Louis, MS | 3.0 | 2.0 | 933 | $1,400 | $1.50 | 12d | 1 | 0.83mi |
| 6004 E Jackson St Bay Saint Louis, MS | 3.0 | 2.0 | 1329 | $1,700 | $1.28 | 44d | 1 | 0.99mi |
Listing history 22 events
-
2026-06-18days on market $125,900 Active 337 DOM
-
2026-06-17days on market $125,900 Active 336 DOM
-
2026-06-16days on market $125,900 Active 335 DOM
-
2026-06-15days on market $125,900 Active 334 DOM
-
2026-06-14days on market $125,900 Active 332 DOM
-
2026-06-13days on market $125,900 Active 331 DOM
-
2026-06-10days on market $125,900 Active 329 DOM
-
2026-06-09days on market $125,900 Active 328 DOM
-
2026-06-08days on market $125,900 Active 327 DOM
-
2026-06-07days on market $125,900 Active 326 DOM
-
2026-06-05days on market $125,900 Active 323 DOM
-
2026-06-03days on market $125,900 Active 322 DOM
-
2026-06-02days on market $125,900 Active 321 DOM
-
2026-06-01days on market $125,900 Active 320 DOM
-
2026-05-31days on market $125,900 Active 319 DOM
-
2026-05-30days on market $125,900 Active 318 DOM
-
2025-08-23price $125,900 175-char remark
Show marketing remark (175 chars)
Neat and clean home! Offers 3b/2b with a nice open kitchen and living area with a big kitchen. A fenced back yard completes the picture. Great starter home or rental home.
-
2025-07-16$129,000 Active 175-char remark
Show marketing remark (175 chars)
Neat and clean home! Offers 3b/2b with a nice open kitchen and living area with a big kitchen. A fenced back yard completes the picture. Great starter home or rental home.
-
2022-12-08soldstatus
-
2022-10-11status Pending 119-char remark
Show marketing remark (119 chars)
Nice 3 bedroom, spacious home with open floor plan. This home has had a fresh coat of paint and waiting for new owners.
-
2022-05-16$99,900 Active 119-char remark
Show marketing remark (119 chars)
Nice 3 bedroom, spacious home with open floor plan. This home has had a fresh coat of paint and waiting for new owners.
-
2007-12-19soldstatus
ⓘ Source: listings_history table (triggers on properties + properties_extension) + one-shot
backfill from property_details.listing_events for pre-trigger history.
Tax reassessment forecast MS · Resets to sale price
- Current annual tax
- $473 · $39/mo
- Projected year-2 tax
- $995 · $83/mo
- Expected delta
- +$522/yr (+$44/mo · 110.5%)
ⓘ Screening estimate from a state-policy table — verify with the county assessor before closing.
Climate risk First Street
- Flood 5/10 Major FEMA zone AE · 40% chance over 30 yrs
- Wildfire 3/10 Moderate
- Heat 10/10 Extreme 7 d/yr ≥107°F today · 21 d/yr by 30 yrs out
- Wind 10/10 Extreme 99% chance of damaging wind over 30 yrs
- Air quality 1/10 Low 0 unhealthy d/yr today · 0 by 30 yrs out
Nearby sold comps map
Loading sold comps map…
Walkable amenities ~0.75 mi
Loading nearby amenities…
Taxation est. · year 1
- Rental income
- $17,186
- − Mortgage interest
- −$7,052
- − Property taxes
- −$473
- − Insurance
- −$5,748
- − Repairs & maintenance
- −$1,375
- − Management
- −$1,375
- − Depreciation
- −$3,663
- Taxable loss
- −$2,499
- Est. tax savings @ 24.0%
- +$600
- After-tax cash flow
- $34/yr
For passive investors: Depreciation is non-cash, so a rental often shows a tax loss while cash-flowing — sheltering income. Rental losses are passive: they offset passive income freely, and up to $25,000/yr can offset ordinary (W-2) income if you actively participate and your MAGI is under $100k (phasing out to $0 by $150k); unused losses carry forward. On sale, claimed depreciation is recaptured at up to 25%, and gains may owe capital-gains tax (a 1031 exchange can defer both). Figures are a year-1 estimate at your 24.0% rate — not tax advice; consult a CPA.
Schools (NCES district)
- District
- Hancock County School District
- NCES district ID
- 2801740
- Math proficiency
- 47% ▼ -11.00%
- Reading proficiency
- 44% ▼ -9.00%
- Median HH income
- $47,971
- Composite
- 38.88/100
- National rank
- #4099
- State rank
- #23 of 130 in MS
Livability — Waveland
- Score
- 61/100
- State rank
- #199
- US rank
- #18110
Category grades
Schools grade is shown separately in the Schools card above.
Census & demographics
- City population
- 6,249
- Population (ZIP)
- 15,471
Population outlook (Hancock County) Hauer SSP2
- Today (2025)
- 52,161 people
- By 2030
- 54,753 · +5.0%
- By 2040
- 59,242 · +13.6%
- By 2050
- 62,417 · +19.7%
- By 2075
- 68,168 · +30.7%
- By 2100
- 69,212 · +32.7%
Race, ethnicity, and origin ACS 2023
- Neighborhood character
- Predominantly White (80%)
- Race & ethnicity
- White 80% Black 11% Two or more races 6% Hispanic / Latino 3% Asian 1%
- Common ancestry
- Lithuanian 15% Romanian 2% Serbian 2%
- Foreign-born
- 3% · Canada, China
- Languages at home
- 96% English-only · Spanish 2% Chinese 1%
Political lean MEDSL · Hancock
- 2024 margin
- Solid R (+58.7) · D 20.1% · R 78.8% · Other 1.1%
- 2008→2024 swing
- -4.4pp toward R · 2008: -54.2pp · 2024: -58.7pp
- All cycles
- 2024: R+58.7 2020: R+55.5 2016: R+59.4 2012: R+52.8 2008: R+54.2
Not yet ingested
- Civics
- —
Market trends
- HPI YoY
- ▼ -169.80%
- Current HPI
- 227.2103
- Rent YoY
- —
- Metro
- —
- State GDP YoY
- —
- F500 in state
- 0
Price history
+26.0% since first listed6 events — show timeline
- 2025-08-23 Price Changed $125,900 MLSU
- 2025-07-16 Listed $129,000 MLSU
- 2022-12-08 Sold (Public Records) — Public Records
- 2022-10-11 Pending — MLSU
- 2022-05-16 Listed $99,900 MLSU
- 2007-12-19 Sold (Public Records) — Public Records
Property tax history
-3.1%/yrLatest (2025): $473 · -1.2% YoY. Source: county tax records.
Cash-flow waterfall
monthlySold comps — $/sqft
last 12 mo · ≤1 miLoading sold comps…