 Triplex
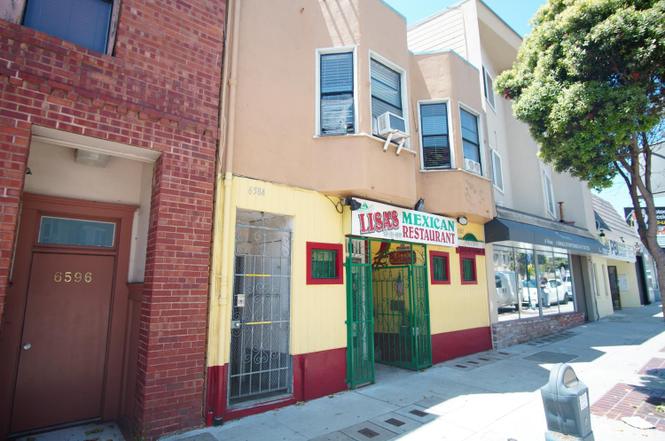
6582-6586 Mission St · Daly City, CA
Flood risk No data
- FEMA flood zone
- —
- Chance of flooding over 30 yrs
- —
- Est. flood insurance / yr
- —
Fire risk No data
- Est. fire insurance / yr
- —
Heat risk No data
- Hot days now (above threshold)
- —
- Hot days in 30 yrs
- —
Wind risk No data
- Chance of severe wind over 30 yrs
- —
Air-quality risk No data
- Unhealthy air days now
- —
- Unhealthy air days in 30 yrs
- —
Risk factors via First Street. Map © Google.
Why this score? — see what drove the C grade
The composite is a weighted blend of 9 inputs, each scored 0–100. Each bar is that input's sub-score; the figure is the points it added to the 100-point composite (weight × sub-score).
- Cash flow +19.6/30.0
- ARV discount +9.2/15.0
- DSCR +6.2/10.0
- Schools +5.6/10.0
- 1% rule +5.2/10.0
- Rent growth +4.3/5.0
- Livability +4.1/5.0
- Condition / age +2.5/5.0
- Appreciation +0.0/10.0
$939,000
🖨 Deal sheet 📄 Offer letter ✓ Due diligence
Multi-family units
County records classify this as Multi-Family (2-4 Unit). Listing-text estimate: 3 units. confirmed
Listing remarks MLS
This mixed use property is located on a commercial section of Mission Street (Daly City). Lisa's Restaurant is being operated on the ground floor. It is open 11:00a. m to 10:00p. m. , closed on Mondays. It has the use of the full basement for storage. The restaurant is leased through 7/31/17. The addendum to the lease allows for an increase in rent each year until the lease expires. Two studio apts. are located above the restaurant, both are tenant occupied. Trust Sale subject to court confirmation.
Key facts
- Steady rental income
- Cozy outdoor space
- 1,263 sq ft lot
Tags
Property features AI
Finance
- Financial info: Total of 3 units with 1 unit currently leased and 2 vacant
- HOA & community: No association fee
Exterior
- Home design: Residential income property; Mixed-use triplex; Built in 1948
- Construction: 1948 construction
- Exterior features: Lot features listed as 'Other'
Interior
- Bedrooms: Studio units (multiple)
- Interior features: Triplex with mixed-use designation; Front upper studio occupied by tenant; Rear upper studio available (vacant by end of December 2025)
Neighborhood map
What this means for you Summary
Snapshot
- This is a 3 × 2-bed/?-bath units multifamily listed at $939k.
Deal economics
- At list price, monthly cash flow is $1k ($13k/yr) — positive. Per door: $358/mo.
- The deal already cash-flows at list — no discount required.
- Meets the 1% rule at list price ($10k rent vs $939k).
- Recommended offer: $826k (12.0% below list) — sets the bar for market timing.
- Cap rate 7.7% vs local median 2.2% in Daly City — top-decile yield for the area; either an underpriced asset or a hidden risk that comps aren't pricing in. Stress-test before assuming the spread holds.
Location & tenants
- Location reads 82/100 on livability (#35 in CA, #1,221 nationally) — a professional / high-income tenant draw. Strengths: amenities A+, commute A+, employment A+; Watch: cost of living F.
- Jefferson Union High (suburban): math 50% / reading 75% proficiency, ranked #66 of 517 in CA (top 13%) — acceptable for families but not a draw, mixed tenant base, ~2y average lease.
- Market conditions: Rents rising fast (+7.1%/yr); 60 active listings in the ZIP; 1 comparable units currently listed for rent nearby; high-income renter base; 1,019 units permitted in San Mateo County in 2024 (484 in 5+ unit buildings).
- At $9,575/mo this rent would consume 93% of the median local household income ($123k/yr) (locally 1517% of renters already pay >50% of income on rent) — very limited rent-growth headroom before tenants either downsize or default.
Forward outlook
- Local home prices are declining (-3.0%/yr); year-one equity from $6k of loan paydown is wiped out by about $28k of value loss. Plan a longer hold.
- San Mateo County population projected at +24% by 2050 — long-run rental-demand tailwind backs the buy-and-hold thesis.
- At projected returns (-3.0% appreciation + 7.1% rent growth), your $263k cash investment doubles in ~10 years — after that, you're playing with house money.
Negotiation context
- It's been on market 162 days — a 12% lower offer ($826k) is reasonable based on typical stale-listing flexibility.
- 3 sale attempts since 13y ago with the ask held roughly flat each time — persistent listings suggest the price (not the market) is what's stuck; bring a comps-based counter.
- Current owner paid $750k; 25% above their basis — modest negotiation headroom, anchor on the comps not their cost.
Risks & watch-outs
- Watch-outs: built in 1948 — expect roof / HVAC / electrical / plumbing capex.
Questions for the listing agent
- It's been on market 162 days. Have you received any prior offers? Is the seller open to a 12% concession, seller financing, or rate buy-down credit?
- Can we see the unit-by-unit rent roll, current vacancy, and any below-market leases? What's the average tenancy length?
- What capital expenditures (roof, boiler, parking lot, exteriors) have been made in the last 5 years, and what's planned in the next 2?
- Built in 1948 — when were the roof, HVAC, electrical panel, plumbing, and water heater last replaced?
- Why hasn't it sold? Are there any deal-killer items the seller is aware of (foundation, flood, title, zoning, code violations)?
- Is there a deadline driving the sale (1031 exchange, divorce, estate, relocation)? That informs how much negotiation room exists.
- What's the average days-on-market for RENTAL listings here right now (not sales)? A rising rental-DOM trend means longer vacancies and softer asking-rent achievability than the comps imply.
- What's the recent tenant-quality profile in this submarket — average credit score on applications, eviction rate, late-payment / NSF rate, and stable-employment percentage? A property-management company in the area should have these aggregated.
- How much new apartment / multifamily construction is in the pipeline within 1–3 miles? Heavy new supply (>2% of stock underway) typically softens rents 12–24 months out; light construction supports rent growth.
Investment metrics
- 1% rule
- 1.02% ✓
- Cap rate
- 7.67%
- Cash-on-cash
- 4.91%
- DSCR
- 1.22
- GRM
- 8.2
CMA / ARV
- ARV (on-the-fly)
- $975,628
- Comps found
- 7
Show comp detail 7 sales within ~0.75 mi
| Address | Dist | Beds/Ba | Sqft | Sold | Price | $/sf | Match |
|---|---|---|---|---|---|---|---|
| 6454 Mission St | 0.08mi | 2/1.0 | 2,274 (-11%) | 23mo | $1,073,000 | $472 | 59 |
| 54 Garibaldi St | 0.68mi | 4/2.0 | 2,430 (-5%) | 4mo | $900,000 | $370 | 57 |
| 60 Garibaldi St | 0.68mi | 4/2.0 | 2,430 (-5%) | 9mo | $925,000 | $381 | 53 |
| 771 Templeton Ave | 0.64mi | 4/2.0 | 2,663 (+4%) | 22mo | $1,055,000 | $396 | 45 |
| 23 2nd Ave | 0.74mi | 3/3.0 | 2,750 (+8%) | 12mo | $875,000 | $318 | 43 |
| 143 Sickles Ave | 0.66mi | —/— | 2,208 (-14%) | 9mo | $1,180,000 | $534 | 39 |
| 180 School St | 0.73mi | 3/2.0 | 2,828 (+11%) | 17mo | $1,080,000 | $382 | 34 |
Match score weights: distance 35% · size 25% · config 20% · recency 20%. Top-matched comps best support the ARV.
Projected returns pro-forma
-3.0% appreciation · 7.1% rent growth · sell at horizon
- IRR
- -4.1%
- Equity multiple
- 0.84×
- Total profit
- $-42,417
- Equity at exit
- $140,008
- IRR
- 9.8%
- Equity multiple
- 1.90×
- Total profit
- $235,487
- Equity at exit
- $81,188
Cash invested: $262,920 (down + closing). Projections, not guarantees.
Landlord ↔ Tenant lean methodology
- Overall (STATE)
- 18 Strongly Tenant-Friendly
- State California
- 18 Strongly Tenant-Friendly · D+13
- County
- — inherits STATE
- City
- — inherits STATE
ZIP-level market 94014
- Rents YoY
- 7.1%
- Active inventory
- 60
- Price-to-rent
- 24.5×
Monthly cashflow live
- Estimated rent
- $9,575 high interval (Pro) →
- Mortgage (P&I)
- −$4,924
- Tax est. 1.5%
- −$1,174 /mo · $14,085/yr
- Insurance
- −$391
- HOA
- −$0
- Vacancy / Maint / Mgmt
- −$2,011
- Net cashflow
- $1,075
Break-even live
3-unit breakdown (identical units grouped — click to expand)
| Units | Beds | Baths | Est. rent |
|---|---|---|---|
| 3× units | 2 | — | $9,576 |
| #1 | 2 | — | $3,192 |
| #2 | 2 | — | $3,192 |
| #3 | 2 | — | $3,192 |
| Total (3 units) | $9,575 | ||
UW: 25.0% down · 7.5% · 30yr · 1.5% tax · 5.0% vac · 8.0% maint · 8.0% mgmt
Financing live
Cash to close
- Down payment
- $234,750
- Closing costs
- $28,170
- Reserves months
- —
- Total cash needed
- —
Loan-product check · same deal, 3 products live
Conventional
25% down · 7.5% · 30yr
- Down + closing
- —
- Monthly P&I
- —
- Monthly cashflow
- —
- DSCR
- —
- Eligible?
- —
Personal DTI + credit; lowest rate.
DSCR
20% down · 8.5% · 30yr
- Down + closing
- —
- Monthly P&I
- —
- Monthly cashflow
- —
- DSCR
- —
- Eligible?
- —
No personal income docs; deal must DSCR.
Hard money
10% down · 12.0% · 12mo
- Down + closing
- —
- Monthly P&I
- —
- Monthly cashflow
- —
- DSCR
- —
- Eligible?
- —
Short-term bridge; refi at stabilization.
Rent comps 1 comps
| Address | Beds | Baths | Sqft | Rent | $/sqft | DOM | Units | Dist |
|---|---|---|---|---|---|---|---|---|
| 875 Huron Ave San Francisco, CA | 2.0 | 1.0 | 2542 | $4,950 | $1.95 | 1d | 1 | 0.80mi |
Listing history 22 events
-
2026-06-18days on market $939,000 Active 162 DOM
-
2026-06-17days on market $939,000 Active 161 DOM
-
2026-06-16days on market $939,000 Active 160 DOM
-
2026-06-15days on market $939,000 Active 159 DOM
-
2026-06-13days on market $939,000 Active 157 DOM
-
2026-06-13days on market $939,000 Active 156 DOM
-
2026-06-09days on market $939,000 Active 153 DOM
-
2026-06-08days on market $939,000 Active 152 DOM
-
2026-06-07days on market $939,000 Active 151 DOM
-
2026-06-04days on market $939,000 Active 148 DOM
-
2026-06-03days on market $939,000 Active 147 DOM
-
2026-06-02days on market $939,000 Active 146 DOM
-
2026-06-01days on market $939,000 Active 145 DOM
-
2026-05-31days on market $939,000 Active 144 DOM
-
2026-02-02price $939,000
-
2026-01-24status Active
-
2026-01-17status Pending
-
2025-12-30$988,000 Active
-
2014-01-27soldstatus $750,000 Closed 505-char remark
Show marketing remark (505 chars)
This mixed use property is located on a commercial section of Mission Street (Daly City). Lisa's Restaurant is being operated on the ground floor. It is open 11:00a. m to 10:00p. m. , closed on Mondays. It has the use of the full basement for storage. The restaurant is leased through 7/31/17. The addendum to the lease allows for an increase in rent each year until the lease expires. Two studio apts. are located above the restaurant, both are tenant occupied. Trust Sale subject to court confirmation.
-
2013-12-10status Pending 505-char remark
Show marketing remark (505 chars)
This mixed use property is located on a commercial section of Mission Street (Daly City). Lisa's Restaurant is being operated on the ground floor. It is open 11:00a. m to 10:00p. m. , closed on Mondays. It has the use of the full basement for storage. The restaurant is leased through 7/31/17. The addendum to the lease allows for an increase in rent each year until the lease expires. Two studio apts. are located above the restaurant, both are tenant occupied. Trust Sale subject to court confirmation.
-
2013-11-19price $714,500 505-char remark
Show marketing remark (505 chars)
This mixed use property is located on a commercial section of Mission Street (Daly City). Lisa's Restaurant is being operated on the ground floor. It is open 11:00a. m to 10:00p. m. , closed on Mondays. It has the use of the full basement for storage. The restaurant is leased through 7/31/17. The addendum to the lease allows for an increase in rent each year until the lease expires. Two studio apts. are located above the restaurant, both are tenant occupied. Trust Sale subject to court confirmation.
-
2013-10-25$599,000 Active 505-char remark
Show marketing remark (505 chars)
This mixed use property is located on a commercial section of Mission Street (Daly City). Lisa's Restaurant is being operated on the ground floor. It is open 11:00a. m to 10:00p. m. , closed on Mondays. It has the use of the full basement for storage. The restaurant is leased through 7/31/17. The addendum to the lease allows for an increase in rent each year until the lease expires. Two studio apts. are located above the restaurant, both are tenant occupied. Trust Sale subject to court confirmation.
ⓘ Source: listings_history table (triggers on properties + properties_extension) + one-shot
backfill from property_details.listing_events for pre-trigger history.
Nearby sold comps map
Loading sold comps map…
Walkable amenities ~0.75 mi
Loading nearby amenities…
Taxation est. · year 1
- Rental income
- $114,900
- − Mortgage interest
- −$52,599
- − Property taxes
- −$14,085
- − Insurance
- −$4,695
- − Repairs & maintenance
- −$9,192
- − Management
- −$9,192
- − Depreciation
- −$27,316
- Taxable loss
- −$2,179
- Est. tax savings @ 24.0%
- +$523
- After-tax cash flow
- $13,423/yr
For passive investors: Depreciation is non-cash, so a rental often shows a tax loss while cash-flowing — sheltering income. Rental losses are passive: they offset passive income freely, and up to $25,000/yr can offset ordinary (W-2) income if you actively participate and your MAGI is under $100k (phasing out to $0 by $150k); unused losses carry forward. On sale, claimed depreciation is recaptured at up to 25%, and gains may owe capital-gains tax (a 1031 exchange can defer both). Figures are a year-1 estimate at your 24.0% rate — not tax advice; consult a CPA.
Schools (NCES district)
- District
- Jefferson Union High
- NCES district ID
- 0618930
- Math proficiency
- 50% ▲ 15.00%
- Reading proficiency
- 75% ▲ 19.00%
- Median HH income
- $82,212
- Composite
- 56.13/100
- National rank
- #1180
- State rank
- #66 of 517 in CA
Livability — Daly City
- Score
- 82/100
- State rank
- #35
- US rank
- #1221
Category grades
Schools grade is shown separately in the Schools card above.
Census & demographics
- Census place
- Daly City, CA
- County
- San Mateo County · 733,415 people
- City population
- 109,406
- Metro
- San Francisco-Oakland-Berkeley, CA
- Population (ZIP)
- 45,315
- Household income
- $122,966
- Rent vs Own
- Severe rent burden
- 1517.0
Population outlook (San Mateo County) Hauer SSP2
- Today (2025)
- 864,008 people
- By 2030
- 910,523 · +5.4%
- By 2040
- 997,285 · +15.4%
- By 2050
- 1,071,189 · +24.0%
- By 2075
- 1,197,206 · +38.6%
- By 2100
- 1,192,523 · +38.0%
Race, ethnicity, and origin ACS 2023
- Neighborhood character
- Diverse neighborhood (Simpson 0.61)
- Race & ethnicity
- Asian 54% Hispanic / Latino 30% Two or more races 11% White 9% Black 2% Native American 1%
- Hispanic origin (detail)
- Mexican 12%
- Common ancestry
- Lithuanian 1% Scotch-Irish 1%
- Foreign-born
- 54% · Canada, China, Vietnam
- Languages at home
- 34% English-only · Spanish 23% Tagalog/Filipino 20% Chinese 17%
Political lean MEDSL · San Mateo
- 2024 margin
- Solid D (+50.3) · D 73.5% · R 23.2% · Other 3.3%
- 2008→2024 swing
- +1.6pp toward D · 2008: 48.7pp · 2024: 50.3pp
- All cycles
- 2024: D+50.3 2020: D+57.7 2016: D+57.7 2012: D+44.8 2008: D+48.7
Not yet ingested
- Civics
- —
Market trends
- HPI YoY
- ▼ -1224.05%
- Current HPI
- 275.8666
- Rent YoY
- ▲ 7.10%
- Metro
- San Francisco-Oakland-Berkeley, CA
- State GDP YoY
- ▲ 3.21%
- F500 in state
- 116
Industry mix (Fortune 500 HQ in CA)
| Industry | F500 HQs | Revenue |
|---|---|---|
| Technology | 27 | $1,492B |
|
||
| Financial Services | 3 | $174B |
|
||
| Retail | 3 | $44B |
|
||
| Insurance | 3 | $26B |
|
||
| Media / Entertainment | 2 | $115B |
|
||
| Pharmaceuticals / Biotech | 2 | $62B |
|
||
Price history
+56.8% since first listed8 events — show timeline
- 2026-02-02 Price Changed $939,000 San Francisco MLS
- 2026-01-24 Relisted — San Francisco MLS
- 2026-01-17 Pending — San Francisco MLS
- 2025-12-30 Listed $988,000 San Francisco MLS
- 2014-01-27 Sold (MLS) $750,000 San Francisco MLS
- 2013-12-10 Pending — San Francisco MLS
- 2013-11-19 Price Changed $714,500 San Francisco MLS
- 2013-10-25 Listed $599,000 San Francisco MLS
Cash-flow waterfall
monthlySold comps — $/sqft
last 12 mo · ≤1 miLoading sold comps…