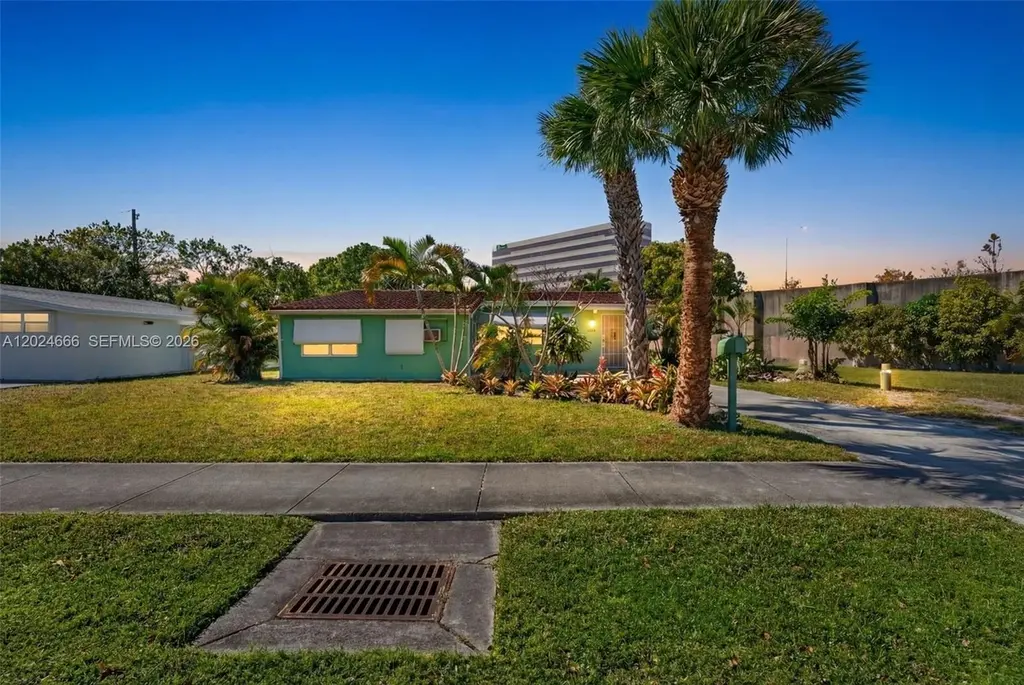
5931 NE 1st Ave · Oakland Park, FL
Flood risk 4/10 · Minor
- FEMA flood zone
- AH
- Chance of flooding over 30 yrs
- 0.22%
- Est. flood insurance / yr
- $1,142 – $2,507
Fire risk 1/10 · Minimal
- Est. fire insurance / yr
- $947 – $1,759
Heat risk 10/10 · Severe
- Hot days now (above 106°F)
- 7 days/yr
- Hot days in 30 yrs
- 26 days/yr
Wind risk 10/10 · Severe
- Chance of severe wind over 30 yrs
- 99.0%
Air-quality risk 2/10 · Minimal
- Unhealthy air days now
- 1 days/yr
- Unhealthy air days in 30 yrs
- 2 days/yr
Risk factors via First Street. Map © Google.
Why this score? — see what drove the B grade
The composite is a weighted blend of 9 inputs, each scored 0–100. Each bar is that input's sub-score; the figure is the points it added to the 100-point composite (weight × sub-score).
- Cash flow +27.3/30.0
- ARV discount +15.0/15.0
- DSCR +9.5/10.0
- 1% rule +6.2/10.0
- Schools +4.1/10.0
- Livability +3.9/5.0
- Rent growth +3.0/5.0
- Condition / age +2.5/5.0
- Appreciation +0.0/10.0
$325,000
🖨 Deal sheet (PDF) 📄 Offer letter ✓ Due diligence
Listing remarks
2/1 corner lot single-family home in need of TLC but has tons of potential. This property is situated on a corner lot and features a spacious backyard with plenty of room for outdoor entertaining, a pool or parking a boat. Barrel tile roof is only 10 years old. Electrical and AC system need to be replaced. Great opportunity for investors looking for a flip. Conveniently located near shopping, dining, major highways, and just minutes from the beach. Property has been appraised. CASH ONLY.
Key facts
- Spacious backyard
- Outdoor entertaining
- Barrel tile roof
Tags
Property features AI
Exterior
- Parking: Driveway
- Utilities: Public water; Public sewer
- Home design: Single-story; Faces east
- Construction: Block construction; Barrel roof; Effective year built
- Exterior features: Fenced yard; Patio
Interior
- Kitchen: Refrigerator
- Bedrooms: Bedroom on main level
- Flooring: Tile
- Bathrooms: 1 full bathroom
- Heating & cooling: Central heating; Central air conditioning
- Interior features: First-floor entry; Living/dining room; Bedroom on main level
- Laundry & utility: Washer hookup; Dryer hookup
Neighborhood map
What this means for you Summary
Snapshot
- This is a 2-bed/1.0-bath single-family listed at $325k.
Deal economics
- At list price, monthly cash flow is $791 ($9k/yr) — positive.
- The deal already cash-flows at list — no discount required.
- Meets the 1% rule at list price ($4k rent vs $325k).
- Cap rate 9.8% vs local median 3.8% in Oakland Park — top-decile yield for the area; either an underpriced asset or a hidden risk that comps aren't pricing in. Stress-test before assuming the spread holds.
Location & tenants
- Location reads 77/100 on livability (#193 in FL, #3,082 nationally) — a middle-class / working-renter tenant base. Strengths: commute A+, housing A+, health & safety A+; Watch: schools D, amenities F.
- Broward (suburban): math 42% / reading 53% proficiency, ranked #46 of 73 in FL (top 63%) — families likely to look elsewhere, expect single-tenant / working-renter base with shorter leases.
- Market conditions: Rents rising (+2.0%/yr); 357 active listings in the ZIP; 35 comparable units currently listed for rent nearby; rentals at typical pace (median 25d on market — plan ~3-4 weeks tenant-placement turnaround); solid renter incomes; 2,111 units permitted in Broward County in 2024 (1,265 in 5+ unit buildings).
- At $3,629/mo this rent would consume 58% of the median local household income ($75k/yr) (locally 1755% of renters already pay >50% of income on rent) — very limited rent-growth headroom before tenants either downsize or default.
Forward outlook
- Local home prices are declining (-3.0%/yr); year-one equity from $2k of loan paydown is wiped out by about $10k of value loss. Plan a longer hold.
- Broward County population projected at +34% by 2050 — long-run rental-demand tailwind backs the buy-and-hold thesis.
Negotiation context
- Only 9 days on market — expect competitive offers; lowballing is unlikely to land.
- 3 sale attempts with the ask held roughly flat each time — persistent listings suggest the price (not the market) is what's stuck; bring a comps-based counter.
- Current owner paid $48k; list at $325k implies a 576% gain — meaningful room to come down on a strong offer.
Risks & watch-outs
- Watch-outs: flood insurance adds $152/mo.
- Climate carrying-cost: in FEMA flood zone AH (mandatory federal flood insurance); severe wind risk, 99% chance of damaging wind over 30y; extreme-heat days projected 7→26/yr by 2055 (HVAC capex compounding) — expect insurance premiums to compound above CPI over the hold.
Questions for the listing agent
- Built in 1965 — when were the roof, HVAC, electrical panel, plumbing, and water heater last replaced?
- What's the actual annual flood-insurance premium (NFIP or private), and is the property in a SFHA with mandatory coverage?
- Is there a deadline driving the sale (1031 exchange, divorce, estate, relocation)? That informs how much negotiation room exists.
- Schools are D-rated, which usually means shorter tenancies and higher turnover. Who's the typical renter profile here, and what's been the actual vacancy rate?
- What's the average days-on-market for RENTAL listings here right now (not sales)? A rising rental-DOM trend means longer vacancies and softer asking-rent achievability than the comps imply.
- What's the recent tenant-quality profile in this submarket — average credit score on applications, eviction rate, late-payment / NSF rate, and stable-employment percentage? A property-management company in the area should have these aggregated.
- How much new for-sale + rental construction is in the pipeline within 1–3 miles? Heavy new supply typically softens prices + rents 12–24 months out; constrained supply supports both.
Investment metrics
- 1% rule
- 1.12% ✓
- Cap rate
- 9.78%
- Cash-on-cash
- 12.44%
- DSCR
- 1.55
- GRM
- 7.5
CMA / ARV
- ARV (on-the-fly)
- $455,642
- Comps found
- 5
Show comp detail 5 sales within ~0.75 mi
| Address | Dist | Beds/Ba | Sqft | Sold | Price | $/sf | Match |
|---|---|---|---|---|---|---|---|
| 230 NE 58th St | 0.18mi | 3/2.0 (+1) | 1,440 (-6%) | 3mo | $535,000 | $372 | 70 |
| 161 NE 59th Ct | 0.10mi | 3/2.0 (+1) | 1,361 (-11%) | 3mo | $275,000 | $202 | 66 |
| 5971 NE 6th Ave | 0.43mi | 3/2.0 (+1) | 1,368 (-10%) | 3mo | $440,000 | $322 | 51 |
| 5372 NW 5th Ave | 0.54mi | 3/2.0 (+1) | 1,653 (+8%) | 3mo | $450,000 | $272 | 50 |
| 5272 NE 4th Ter | 0.66mi | 3/2.0 (+1) | 1,428 (-7%) | 3mo | $425,000 | $298 | 46 |
Match score weights: distance 35% · size 25% · config 20% · recency 20%. Top-matched comps best support the ARV.
Projected returns pro-forma
-3.0% appreciation · 2.01% rent growth · sell at horizon
- IRR
- -1.7%
- Equity multiple
- 0.94×
- Total profit
- $-5,895
- Equity at exit
- $48,459
- IRR
- 6.9%
- Equity multiple
- 1.50×
- Total profit
- $45,161
- Equity at exit
- $28,100
Cash invested: $91,000 (down + closing). Projections, not guarantees.
Landlord ↔ Tenant lean methodology
- Overall (STATE)
- 87 Strongly Landlord-Friendly
- State Florida
- 87 Strongly Landlord-Friendly · R+3
- County
- — inherits STATE
- City
- — inherits STATE
ZIP-level market 33334
- Home prices YoY
- -34.6%
- Rents YoY
- 2.0%
- Active inventory
- 357
- Price-to-rent
- 7.5×
Monthly cashflow live
- Estimated rent
- $3,629 high interval (Pro) →
- Mortgage (P&I)
- −$1,704
- Tax from tax record
- −$84 /mo · $1,009/yr
- Insurance
- −$135
- Flood insurance flood zone
- −$152 /mo · $1,824/yr
- HOA
- −$0
- Vacancy / Maint / Mgmt
- −$762
- Net cashflow
- $791
Break-even live
Sensitivity live
| Price | -10% $975 | -5% $883 | +0% $791 | +5% $699 | +10% $607 |
|---|---|---|---|---|---|
| Rent | -10% $505 | -5% $648 | +0% $791 | +5% $935 | +10% $1,078 |
| Rate | -1.0pp $955 | -0.5pp $874 | base $791 | +0.5pp $707 | +1.0pp $621 |
UW: 25.0% down · 7.5% · 30yr · 1.5% tax · 5.0% vac · 8.0% maint · 8.0% mgmt
Financing live
Cash to close
- Down payment
- $81,250
- Closing costs
- $9,750
- Reserves months
- —
- Total cash needed
- —
Loan-product check · same deal, 3 products live
Conventional
25% down · 7.5% · 30yr
- Down + closing
- —
- Monthly P&I
- —
- Monthly cashflow
- —
- DSCR
- —
- Eligible?
- —
Personal DTI + credit; lowest rate.
DSCR
20% down · 8.5% · 30yr
- Down + closing
- —
- Monthly P&I
- —
- Monthly cashflow
- —
- DSCR
- —
- Eligible?
- —
No personal income docs; deal must DSCR.
Hard money
10% down · 12.0% · 12mo
- Down + closing
- —
- Monthly P&I
- —
- Monthly cashflow
- —
- DSCR
- —
- Eligible?
- —
Short-term bridge; refi at stabilization.
Rent comps 35 comps
| Address | Beds | Baths | Sqft | Rent | $/sqft | DOM | Units | Dist |
|---|---|---|---|---|---|---|---|---|
| 5655 NE 5th Ter Fort Lauderdale, FL | 3.0 | 2.0 | 1178 | $3,250 | $2.76 | 25d | 1 | 0.39mi |
| 5655 NE 5th Ter Fort Lauderdale, FL | 3.0 | 2.0 | 1178 | $3,250 | $2.76 | 17d | 1 | 0.39mi |
| 540 NE 61st Ct Fort Lauderdale, FL | 3.0 | 2.0 | 1272 | $3,395 | $2.67 | 4d | 1 | 0.44mi |
| 6500 N Andrews Ave Fort Lauderdale, FL | 2.0 | 1.0–2.0 | 943 | $3,146 | $3.34 | 3d | 31 | 0.47mi |
| 5409 NE 4th Ave Fort Lauderdale, FL | 3.0 | 2.0 | 1178 | $3,200 | $2.72 | 25d | 1 | 0.48mi |
| 5225 NE 4th Ave Fort Lauderdale, FL | 3.0 | 2.0 | 1650 | $3,300 | $2.00 | 13d | 1 | 0.64mi |
| 5157 NE 5th Ave Unit 1 Fort Lauderdale, FL | 3.0 | 2.0 | 1250 | $3,500 | $2.80 | 4d | 1 | 0.73mi |
| 320 NW 51st Ct Fort Lauderdale, FL | 3.0 | 2.0 | 1396 | $3,500 | $2.51 | 25d | 1 | 0.73mi |
| 240 NW 48th Ct Fort Lauderdale, FL | 3.0 | 2.0 | 1240 | $3,100 | $2.50 | 4d | 1 | 0.92mi |
| 4650 NE 2nd Ave Fort Lauderdale, FL | 3.0 | 2.0 | 1356 | $3,950 | $2.91 | 25d | 1 | 1.08mi |
| 1466 NE 57th Ct Unit 1044539P Fort Lauderdale, FL | 3.0 | 2.0 | 2012 | $6,185 | $3.07 | 8d | 1 | 1.10mi |
| 1466 NE 57th Ct Fort Lauderdale, FL | 3.0 | 2.0 | 2020 | $8,200 | $4.06 | 25d | 1 | 1.10mi |
| 1424 NE 53rd Ct Fort Lauderdale, FL | 3.0 | 2.0 | 1584 | $7,500 | $4.73 | 25d | 1 | 1.10mi |
| 4680 NE 5th Ave Fort Lauderdale, FL | 3.0 | 2.0 | 1300 | $3,800 | $2.92 | 8d | 1 | 1.10mi |
| 4780 NE 8th Ter Oakland Park, FL | 3.0 | 2.0 | 1130 | $4,200 | $3.72 | 25d | 1 | 1.12mi |
| 1478 NE 57th St Fort Lauderdale, FL | 3.0 | 2.0 | 1590 | $5,400 | $3.40 | 25d | 1 | 1.14mi |
| 4580 NE 3rd Ave Fort Lauderdale, FL | 3.0 | 2.0 | 1192 | $3,300 | $2.77 | 21d | 1 | 1.16mi |
| 4601 NE 4th Ave Unit 1261561P Fort Lauderdale, FL | 3.0 | 2.0 | 1097 | $4,430 | $4.04 | 25d | 1 | 1.16mi |
| 5921 NE 15th Ave Fort Lauderdale, FL | 3.0 | 3.0 | 1977 | $4,600 | $2.33 | 25d | 1 | 1.19mi |
| 1601 NE 63rd St Fort Lauderdale, FL | 3.0 | 2.0 | 1875 | $6,125 | $3.27 | 25d | 1 | 1.33mi |
| 860 SW 10th St Pompano Beach, FL | 3.0 | 2.0 | 1354 | $3,300 | $2.44 | 25d | 1 | 1.34mi |
| 5200 NE 15th Ave Fort Lauderdale, FL | 3.0 | 2.0 | 1585 | $4,600 | $2.90 | 25d | 1 | 1.35mi |
| 342 SW 14th St Pompano Beach, FL | 3.0 | 2.0 | 1458 | $5,000 | $3.43 | 25d | 1 | 1.40mi |
| 2751 S Palm Aire Dr #107 Pompano Beach, FL | 2.0 | 2.0 | 1112 | $1,950 | $1.75 | 4d | 1 | 1.43mi |
| 1740 NE 64th St Fort Lauderdale, FL | 3.0 | 2.0 | 1364 | $4,800 | $3.52 | 5d | 1 | 1.47mi |
| 1740 NE 64th St Fort Lauderdale, FL | 3.0 | 2.0 | 1364 | $4,800 | $3.52 | 12d | 1 | 1.47mi |
| 682 NE 43rd St Oakland Park, FL | 3.0 | 2.5 | 1694 | $4,200 | $2.48 | 25d | 1 | 1.47mi |
| 1761 NE 52nd St Unit 1-2 Oakland Park, FL | 2.0 | 2.0 | 2028 | $3,650 | $1.80 | 25d | 1 | 1.48mi |
| 100 SW 17th St Pompano Beach, FL | 3.0 | 2.0 | 1788 | $4,500 | $2.52 | 8d | 1 | 1.48mi |
| 100 SW 17th St Pompano Beach, FL | 3.0 | 2.0 | 1788 | $4,500 | $2.52 | 25d | 1 | 1.48mi |
| 4511 NE 13th Ave Oakland Park, FL | 3.0 | 3.0 | 1416 | $4,300 | $3.04 | 25d | 1 | 1.49mi |
| 4511 NE 13th Ave Oakland Park, FL | 2.0 | 2.0 | 1400 | $3,200 | $2.29 | 8d | 1 | 1.49mi |
| 4511 NE 13th Ave Oakland Park, FL | 3.0 | 3.0 | 1416 | $4,300 | $3.04 | 5d | 1 | 1.49mi |
| 2851 S Palm Aire Dr #309 Pompano Beach, FL | 2.0 | 2.0 | 1100 | $1,750 | $1.59 | 25d | 1 | 1.50mi |
| 2851 S Palm Aire Dr #309 Pompano Beach, FL | 2.0 | 2.0 | 1100 | $1,750 | $1.59 | 18d | 1 | 1.50mi |
Listing history 7 events
-
2026-06-08status $325,000 Pending 9 DOM
-
2026-06-07days on market $325,000 Active 9 DOM
-
2026-06-04days on market $325,000 Active 6 DOM
-
2026-06-03days on market $325,000 Active 5 DOM
-
2026-06-02days on market $325,000 Active 4 DOM
-
2026-06-01days on market $325,000 Active 3 DOM
-
2026-05-31days on market $325,000 Active 2 DOM
ⓘ Source: listings_history table (triggers on properties + properties_extension) + one-shot
backfill from property_details.listing_events for pre-trigger history.
Tax reassessment forecast FL · Resets to sale price
- Current annual tax
- $1,009 · $84/mo
- Projected year-2 tax
- $2,698 · $225/mo
- Expected delta
- +$1,689/yr (+$141/mo · 167.4%)
ⓘ Screening estimate from a state-policy table — verify with the county assessor before closing.
Climate risk First Street
- Flood 4/10 Moderate FEMA zone AH · 22% chance over 30 yrs
- Wildfire 1/10 Low
- Heat 10/10 Extreme 7 d/yr ≥106°F today · 26 d/yr by 30 yrs out
- Wind 10/10 Extreme 99% chance of damaging wind over 30 yrs
- Air quality 2/10 Low 1 unhealthy d/yr today · 2 by 30 yrs out
Nearby sold comps map
Loading sold comps map…
Walkable amenities ~0.75 mi
Loading nearby amenities…
Taxation est. · year 1
- Rental income
- $43,552
- − Mortgage interest
- −$18,205
- − Property taxes
- −$1,009
- − Insurance
- −$3,450
- − Repairs & maintenance
- −$3,484
- − Management
- −$3,484
- − Depreciation
- −$9,455
- Taxable income
- $4,466
- Est. tax owed @ 24.0%
- −$1,072
- After-tax cash flow
- $8,424/yr
For passive investors: Depreciation is non-cash, so a rental often shows a tax loss while cash-flowing — sheltering income. Rental losses are passive: they offset passive income freely, and up to $25,000/yr can offset ordinary (W-2) income if you actively participate and your MAGI is under $100k (phasing out to $0 by $150k); unused losses carry forward. On sale, claimed depreciation is recaptured at up to 25%, and gains may owe capital-gains tax (a 1031 exchange can defer both). Figures are a year-1 estimate at your 24.0% rate — not tax advice; consult a CPA.
Schools (NCES district)
- District
- Broward
- NCES district ID
- 1200180
- Math proficiency
- 42% ▼ -18.00%
- Reading proficiency
- 53% ▼ -5.00%
- Median HH income
- $52,139
- Composite
- 40.88/100
- National rank
- #3621
- State rank
- #46 of 73 in FL
Livability — Oakland Park
- Score
- 77/100
- State rank
- #193
- US rank
- #3082
Category grades
Schools grade is shown separately in the Schools card above.
Census & demographics
- Census place
- Oakland Park, FL
- County
- Broward County · 1,963,430 people
- City population
- 68,410
- Metro
- Miami-Fort Lauderdale-Pompano Beach, FL
- Population (ZIP)
- 30,935
- Household income
- $75,361
- Rent vs Own
- Severe rent burden
- 1755.0
Population outlook (Broward County) Hauer SSP2
- Today (2025)
- 2,207,033 people
- By 2030
- 2,360,704 · +7.0%
- By 2040
- 2,661,208 · +20.6%
- By 2050
- 2,946,698 · +33.5%
- By 2075
- 3,602,273 · +63.2%
- By 2100
- 3,970,984 · +79.9%
Race, ethnicity, and origin ACS 2023
- Neighborhood character
- Diverse neighborhood (Simpson 0.68)
- Race & ethnicity
- White 43% Hispanic / Latino 32% Two or more races 25% Black 17% Asian 2%
- Hispanic origin (detail)
- Mexican 2% Puerto Rican 4% Cuban 4%
- Common ancestry
- Hispanic 5% Lithuanian 3% Romanian 2%
- Foreign-born
- 31% · Canada, Jamaica, Vietnam
- Languages at home
- 59% English-only · Spanish 28% Other Indo-European 5% French/Haitian/Cajun 5%
Political lean MEDSL · Broward
- 2024 margin
- D (+17.0) · D 58.0% · R 41.0%
- 2008→2024 swing
- -17.8pp toward R · 2008: 34.7pp · 2024: 17.0pp
- All cycles
- 2024: D+17.0 2020: D+29.8 2016: D+35.0 2012: D+34.9 2008: D+34.7
Not yet ingested
- Civics
- —
Market trends
- HPI YoY
- ▼ -208.58%
- Current HPI
- 394.9526
- Rent YoY
- ▲ 2.01%
- Metro
- Miami-Fort Lauderdale-Pompano Beach, FL
- State GDP YoY
- ▲ 3.28%
- F500 in state
- 36
Industry mix (Fortune 500 HQ in FL)
| Industry | F500 HQs | Revenue |
|---|---|---|
| Industrial Technology | 2 | $29B |
|
||
| Insurance | 2 | $17B |
|
||
| Retail | 1 | $60B |
|
||
| Technology Distribution | 1 | $58B |
|
||
| Homebuilding | 1 | $35B |
|
||
| Technology Manufacturing | 1 | $35B |
|
||
Price history
+450.8% since first listed7 events — show timeline
- 2026-05-29 Listed $325,000 MARMLS
- 2026-04-23 Price Changed $350,000 MARMLS
- 2026-03-22 Relisted — MARMLS
- 2026-03-19 Contingent — MARMLS
- 2026-03-05 Listed $375,000 MARMLS
- 1993-01-01 Sold (Public Records) $48,100 Public Records
- 1988-12-01 Sold (Public Records) $59,000 Public Records
Property tax history
-1.3%/yrLatest (2025): $1,009 · +3.3% YoY. Source: county tax records.
Cash-flow waterfall
monthlySold comps — $/sqft
last 12 mo · ≤1 miLoading sold comps…