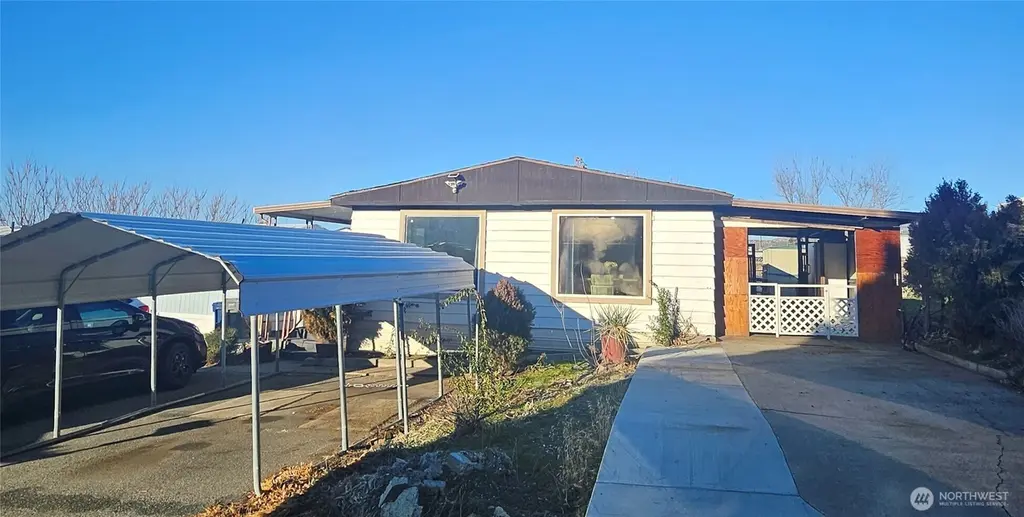
211 Pace Dr #2 · East Wenatchee, WA
Flood risk 1/10 · Minimal
- FEMA flood zone
- X (shaded)
- Chance of flooding over 30 yrs
- 0.0%
- Est. flood insurance / yr
- $473 – $860
Fire risk 5/10 · Moderate
- Est. fire insurance / yr
- $604 – $1,122
Heat risk 4/10 · Minor
- Hot days now (above 96°F)
- 6 days/yr
- Hot days in 30 yrs
- 13 days/yr
Wind risk 1/10 · Minimal
- Chance of severe wind over 30 yrs
- —
Air-quality risk 10/10 · Severe
- Unhealthy air days now
- 25 days/yr
- Unhealthy air days in 30 yrs
- 25 days/yr
Risk factors via First Street. Map © Google.
Why this score? — see what drove the B- grade
The composite is a weighted blend of 9 inputs, each scored 0–100. Each bar is that input's sub-score; the figure is the points it added to the 100-point composite (weight × sub-score).
- Cash flow +30.0/30.0
- 1% rule +10.0/10.0
- DSCR +10.0/10.0
- ARV discount +5.0/15.0
- Schools +4.7/10.0
- Livability +4.2/5.0
- Rent growth +2.9/5.0
- Condition / age +2.5/5.0
- Appreciation +0.0/10.0
$89,500
🖨 Deal sheet 📄 Offer letter ✓ Due diligence
Listing remarks
Enjoy easy living in this bright and spacious 2-bedroom, 1.75-bath home! The interior is flooded with natural light thanks to impressive oversized windows, creating an airy atmosphere throughout the 1,056 sq ft layout. Perfectly positioned for convenience, this property is located near the neighborhood entrance with quick access to shopping and groceries. A standout feature is the versatile shop/shed, fully equipped with heating and AC. Relax on the covered front or back porches and take in the great views. This home is designed for comfort, remains easy to heat and cool, and includes a convenient carport. Nestled in a quiet neighborhood with friendly neighbors, it’s the perfect blend
Key facts
- Covered front porch
- Versatile shop
- Quiet neighborhood
Tags
Neighborhood map
What this means for you Summary
Snapshot
- This is a 2-bed/2.0-bath manufactured listed at $90k.
Deal economics
- At list price, monthly cash flow is $931 ($11k/yr) — positive.
- The deal already cash-flows at list — no discount required.
- Meets the 1% rule at list price ($2k rent vs $90k).
- Recommended offer: $79k (12.0% below list) — sets the bar for market timing.
- Cap rate 18.8% vs local median 2.9% in East Wenatchee — top-decile yield for the area; either an underpriced asset or a hidden risk that comps aren't pricing in. Stress-test before assuming the spread holds.
Location & tenants
- Location reads 83/100 on livability (#54 in WA, #972 nationally) — a professional / high-income tenant draw. Strengths: commute A+, housing A+, health & safety A+.
- Eastmont School District (suburban): math 45% / reading 60% proficiency, ranked #118 of 291 in WA (top 40%) — acceptable for families but not a draw, mixed tenant base, ~2y average lease.
- Market conditions: Rents rising (+1.5%/yr); 324 active listings in the ZIP; 15 comparable units currently listed for rent nearby; rentals lingering (median 44d on market — plan ~5-8 weeks vacancy on turnover, expect pricing pressure); 100% of comp listings sitting > 30 days — soft ceiling on asking rent; solid renter incomes; 263 units permitted in Douglas County in 2024 (0 in 5+ unit buildings).
Forward outlook
- Local home prices are declining (-3.0%/yr); year-one equity from $619 of loan paydown is wiped out by about $3k of value loss. Plan a longer hold.
- Douglas County population projected at +22% by 2050 — long-run rental-demand tailwind backs the buy-and-hold thesis.
- At projected returns (-3.0% appreciation + 1.5% rent growth), your $25k cash investment doubles in ~3 years — after that, you're playing with house money.
Negotiation context
- It's been on market 165 days — a 12% lower offer ($79k) is reasonable based on typical stale-listing flexibility.
- Current owner paid $25k; list at $90k implies a 258% gain — meaningful room to come down on a strong offer.
Risks & watch-outs
- Climate carrying-cost: moderate wildfire risk — expect insurance premiums to compound above CPI over the hold.
Questions for the listing agent
- It's been on market 165 days. Have you received any prior offers? Is the seller open to a 12% concession, seller financing, or rate buy-down credit?
- Built in 1979 — when were the roof, HVAC, electrical panel, plumbing, and water heater last replaced?
- Why hasn't it sold? Are there any deal-killer items the seller is aware of (foundation, flood, title, zoning, code violations)?
- Is there a deadline driving the sale (1031 exchange, divorce, estate, relocation)? That informs how much negotiation room exists.
- What's the average days-on-market for RENTAL listings here right now (not sales)? A rising rental-DOM trend means longer vacancies and softer asking-rent achievability than the comps imply.
- What's the recent tenant-quality profile in this submarket — average credit score on applications, eviction rate, late-payment / NSF rate, and stable-employment percentage? A property-management company in the area should have these aggregated.
- How much new for-sale + rental construction is in the pipeline within 1–3 miles? Heavy new supply typically softens prices + rents 12–24 months out; constrained supply supports both.
Investment metrics
- 1% rule
- 2.15% ✓
- Cap rate
- 18.77%
- Cash-on-cash
- 44.56%
- DSCR
- 2.98
- GRM
- 3.9
CMA / ARV
- ARV (median comp)
- $84,844
- List price
- $89,500
- Delta
- 5.49%
- Verdict
- FAIR
- Comps
- 5 within 1.0 mi
Show comp detail 8 sales within ~0.75 mi
| Address | Dist | Beds/Ba | Sqft | Sold | Price | $/sf | Match |
|---|---|---|---|---|---|---|---|
| 211 S Pace Dr #30 | 0.03mi | 2/2.0 | 924 (-12%) | 4mo | $65,000 | $70 | 74 |
| 211 Pace Dr #22 | 0.03mi | 2/1.5 | 980 (-7%) | 14mo | $84,900 | $87 | 73 |
| 211 Pace Dr #16 | 0.03mi | 2/1.0 | 924 (-12%) | 11mo | $82,500 | $89 | 64 |
| 211 Pace Dr #41 | 0.03mi | 2/1.0 | 924 (-12%) | 22mo | $84,900 | $92 | 55 |
| 211 Pace Dr #45 | 0.03mi | 3/1.0 (+1) | 924 (-12%) | 22mo | $79,900 | $86 | 50 |
| 341 N Georgia Ave | 0.61mi | 2/2.0 | 900 (-15%) | 13mo | $85,000 | $94 | 36 |
| 323 N Georgia Ave | 0.58mi | 2/1.0 | 910 (-14%) | 23mo | $49,000 | $54 | 27 |
| 621 S Iowa Ave | 0.70mi | 3/2.0 (+1) | 1,200 (+14%) | 18mo | $380,000 | $317 | 25 |
Match score weights: distance 35% · size 25% · config 20% · recency 20%. Top-matched comps best support the ARV.
Projected returns pro-forma
-3.0% appreciation · 1.47% rent growth · sell at horizon
- IRR
- 39.9%
- Equity multiple
- 2.67×
- Total profit
- $41,863
- Equity at exit
- $13,345
- IRR
- 45.5%
- Equity multiple
- 5.04×
- Total profit
- $101,212
- Equity at exit
- $7,738
Cash invested: $25,060 (down + closing). Projections, not guarantees.
Landlord ↔ Tenant lean methodology
- Overall (STATE)
- 28 Tenant-Leaning
- State Washington
- 28 Tenant-Leaning · D+8
- County
- — inherits STATE
- City
- — inherits STATE
ZIP-level market 98802
- Rents YoY
- 1.5%
- Active inventory
- 324
- Price-to-rent
- 3.9×
Monthly cashflow live
- Estimated rent
- $1,925 high interval (Pro) →
- Mortgage (P&I)
- −$469
- Tax from tax record
- −$83 /mo · $998/yr
- Insurance
- −$37
- HOA
- −$0
- Vacancy / Maint / Mgmt
- −$404
- Net cashflow
- $931
Break-even live
UW: 25.0% down · 7.5% · 30yr · 1.5% tax · 5.0% vac · 8.0% maint · 8.0% mgmt
Financing live
Cash to close
- Down payment
- $22,375
- Closing costs
- $2,685
- Reserves months
- —
- Total cash needed
- —
Loan-product check · same deal, 3 products live
Conventional
25% down · 7.5% · 30yr
- Down + closing
- —
- Monthly P&I
- —
- Monthly cashflow
- —
- DSCR
- —
- Eligible?
- —
Personal DTI + credit; lowest rate.
DSCR
20% down · 8.5% · 30yr
- Down + closing
- —
- Monthly P&I
- —
- Monthly cashflow
- —
- DSCR
- —
- Eligible?
- —
No personal income docs; deal must DSCR.
Hard money
10% down · 12.0% · 12mo
- Down + closing
- —
- Monthly P&I
- —
- Monthly cashflow
- —
- DSCR
- —
- Eligible?
- —
Short-term bridge; refi at stabilization.
Rent comps 15 comps
| Address | Beds | Baths | Sqft | Rent | $/sqft | DOM | Units | Dist |
|---|---|---|---|---|---|---|---|---|
| 419 S Pace Dr Unit 419 East Wenatchee, WA | 1.0 | 1.0 | 714 | $1,595 | $2.23 | 43d | 1 | 0.10mi |
| 286 N Iowa Ave East Wenatchee, WA | 3.0 | 1.0 | 1264 | $2,600 | $2.06 | 43d | 1 | 0.61mi |
| 667 4th St NE Apt I201 East Wenatchee, WA | 2.0 | 1.0 | 884 | $1,650 | $1.87 | 43d | 1 | 0.67mi |
| 460 N James Ave Unit 456 James East Wenatchee, WA | 2.0 | 2.0 | 850 | $2,495 | $2.94 | 43d | 1 | 0.81mi |
| 224 6th St NE East Wenatchee, WA | 3.0 | 1.0 | 966 | $1,895 | $1.96 | 43d | 1 | 0.85mi |
| 623 N Baker Ave Apt D East Wenatchee, WA | 3.0 | 1.0 | 1006 | $1,695 | $1.68 | 43d | 1 | 0.94mi |
| 1763 Grant Rd East Wenatchee, WA | 3.0 | 2.5 | 1500 | $2,795 | $1.86 | 43d | 1 | 0.97mi |
| 1620 5th St NE Unit 1622 East Wenatchee, WA | 2.0 | 1.0 | 1166 | $1,900 | $1.63 | 43d | 1 | 1.13mi |
| 214 Antles Ave Unit 309 Wenatchee, WA | 2.0 | 1.5 | 900 | $1,695 | $1.88 | 43d | 1 | 1.15mi |
| 212 Antles St Wenatchee, WA | 2.0 | 1.0 | 900 | $1,695 | $1.88 | 43d | 1 | 1.15mi |
| 1686 S Mission St Apt 2 Wenatchee, WA | 2.0 | 2.0 | 980 | $1,650 | $1.68 | 43d | 1 | 1.17mi |
| 933 N Baker Ave Apt 10 East Wenatchee, WA | 1.0 | 1.0 | 800 | $1,595 | $1.99 | 43d | 1 | 1.23mi |
| 1121 Monitor Ave Unit 1/2 Downstairs Wenatchee, WA | 2.0 | 1.0 | 700 | $1,495 | $2.14 | 43d | 1 | 1.25mi |
| 1121 Monitor Ave Unit A Upstairs Wenatchee, WA | 3.0 | 1.0 | 800 | $1,695 | $2.12 | 43d | 1 | 1.25mi |
| 564 11th St NE East Wenatchee, WA | 3.0 | 2.0 | 1220 | $2,195 | $1.80 | 43d | 1 | 1.42mi |
Listing history 19 events
-
2026-06-19days on market $89,500 Active 165 DOM
-
2026-06-18days on market $89,500 Active 164 DOM
-
2026-06-17days on market $89,500 Active 163 DOM
-
2026-06-16days on market $89,500 Active 162 DOM
-
2026-06-15days on market $89,500 Active 161 DOM
-
2026-06-14days on market $89,500 Active 159 DOM
-
2026-06-13days on market $89,500 Active 158 DOM
-
2026-06-10days on market $89,500 Active 156 DOM
-
2026-06-09days on market $89,500 Active 155 DOM
-
2026-06-08days on market $89,500 Active 154 DOM
-
2026-06-07days on market $89,500 Active 153 DOM
-
2026-06-05days on market $89,500 Active 150 DOM
-
2026-06-02days on market $89,500 Active 148 DOM
-
2026-06-01days on market $89,500 Active 147 DOM
-
2026-05-31days on market $89,500 Active 146 DOM
-
2026-05-30days on market $89,500 Active 145 DOM
-
2026-04-12price $98,500
-
2026-01-05$110,000 Active
-
2001-07-10soldstatus $25,000
ⓘ Source: listings_history table (triggers on properties + properties_extension) + one-shot
backfill from property_details.listing_events for pre-trigger history.
Tax reassessment forecast WA · Resets to sale price
- Current annual tax
- $998 · $83/mo
- Projected year-2 tax
- $998 · $83/mo
- Expected delta
- $0/yr ($0/mo · 0.0%)
ⓘ Screening estimate from a state-policy table — verify with the county assessor before closing.
Climate risk First Street
- Flood 1/10 Low FEMA zone X (shaded) · 0% chance over 30 yrs
- Wildfire 5/10 Major
- Heat 4/10 Moderate 6 d/yr ≥96°F today · 13 d/yr by 30 yrs out
- Wind 1/10 Low
- Air quality 10/10 Extreme 25 unhealthy d/yr today · 25 by 30 yrs out
Nearby sold comps map
Loading sold comps map…
Walkable amenities ~0.75 mi
Loading nearby amenities…
Taxation est. · year 1
- Rental income
- $23,095
- − Mortgage interest
- −$5,013
- − Property taxes
- −$998
- − Insurance
- −$448
- − Repairs & maintenance
- −$1,848
- − Management
- −$1,848
- − Depreciation
- −$2,604
- Taxable income
- $10,338
- Est. tax owed @ 24.0%
- −$2,481
- After-tax cash flow
- $8,687/yr
For passive investors: Depreciation is non-cash, so a rental often shows a tax loss while cash-flowing — sheltering income. Rental losses are passive: they offset passive income freely, and up to $25,000/yr can offset ordinary (W-2) income if you actively participate and your MAGI is under $100k (phasing out to $0 by $150k); unused losses carry forward. On sale, claimed depreciation is recaptured at up to 25%, and gains may owe capital-gains tax (a 1031 exchange can defer both). Figures are a year-1 estimate at your 24.0% rate — not tax advice; consult a CPA.
Schools (NCES district)
- District
- Eastmont School District
- NCES district ID
- 5302310
- Math proficiency
- 45% ▬ 0.00%
- Reading proficiency
- 60% ▲ 1.00%
- Median HH income
- $56,015
- Composite
- 47.31/100
- National rank
- #5047
- State rank
- #118 of 291 in WA
Livability — East Wenatchee
- Score
- 83/100
- State rank
- #54
- US rank
- #972
Category grades
Schools grade is shown separately in the Schools card above.
Census & demographics
- Census place
- East Wenatchee, WA
- County
- Douglas County · 33,539 people
- City population
- 33,539
- Metro
- Wenatchee, WA
- Population (ZIP)
- 33,539
- Household income
- $87,744
- Rent vs Own
- Severe rent burden
- 741.0
Population outlook (Douglas County) Hauer SSP2
- Today (2025)
- 45,264 people
- By 2030
- 47,398 · +4.7%
- By 2040
- 51,407 · +13.6%
- By 2050
- 55,020 · +21.6%
- By 2075
- 63,862 · +41.1%
- By 2100
- 69,870 · +54.4%
Race, ethnicity, and origin ACS 2023
- Neighborhood character
- Majority White (63%)
- Race & ethnicity
- White 63% Hispanic / Latino 30% Two or more races 10% Asian 1%
- Hispanic origin (detail)
- Mexican 29%
- Common ancestry
- Lithuanian 3% Portuguese 3% Slovak 2%
- Foreign-born
- 14% · Canada
- Languages at home
- 76% English-only · Spanish 23% Other Indo-European 1%
Political lean MEDSL · Douglas
- 2024 margin
- Strong R (+27.0) · D 35.2% · R 62.1% · Other 2.7%
- 2008→2024 swing
- -5.6pp toward R · 2008: -21.4pp · 2024: -27.0pp
- All cycles
- 2024: R+27.0 2020: R+24.1 2016: R+31.5 2012: R+28.9 2008: R+21.4
Not yet ingested
- Civics
- —
Market trends
- HPI YoY
- ▼ -570.14%
- Current HPI
- 305.0094
- Rent YoY
- ▲ 1.47%
- Metro
- Wenatchee, WA
- State GDP YoY
- ▲ 4.65%
- F500 in state
- 22
Industry mix (Fortune 500 HQ in WA)
| Industry | F500 HQs | Revenue |
|---|---|---|
| Retail | 2 | $269B |
|
||
| Technology / Retail | 1 | $638B |
|
||
| Technology | 1 | $245B |
|
||
| Telecommunications | 1 | $38B |
|
||
| Food / Beverage | 1 | $36B |
|
||
| Automotive / Trucks | 1 | $34B |
|
||
Price history
+294.0% since first listed3 events — show timeline
- 2026-04-12 Price Changed $98,500 NWMLS as Distributed by MLS Grid
- 2026-01-05 Listed $110,000 NWMLS as Distributed by MLS Grid
- 2001-07-10 Sold (Public Records) $25,000 Public Records
Property tax history
+15.3%/yrLatest (2026): $998 · +16.1% YoY. Source: county tax records.
Cash-flow waterfall
monthlySold comps — $/sqft
last 12 mo · ≤1 miLoading sold comps…