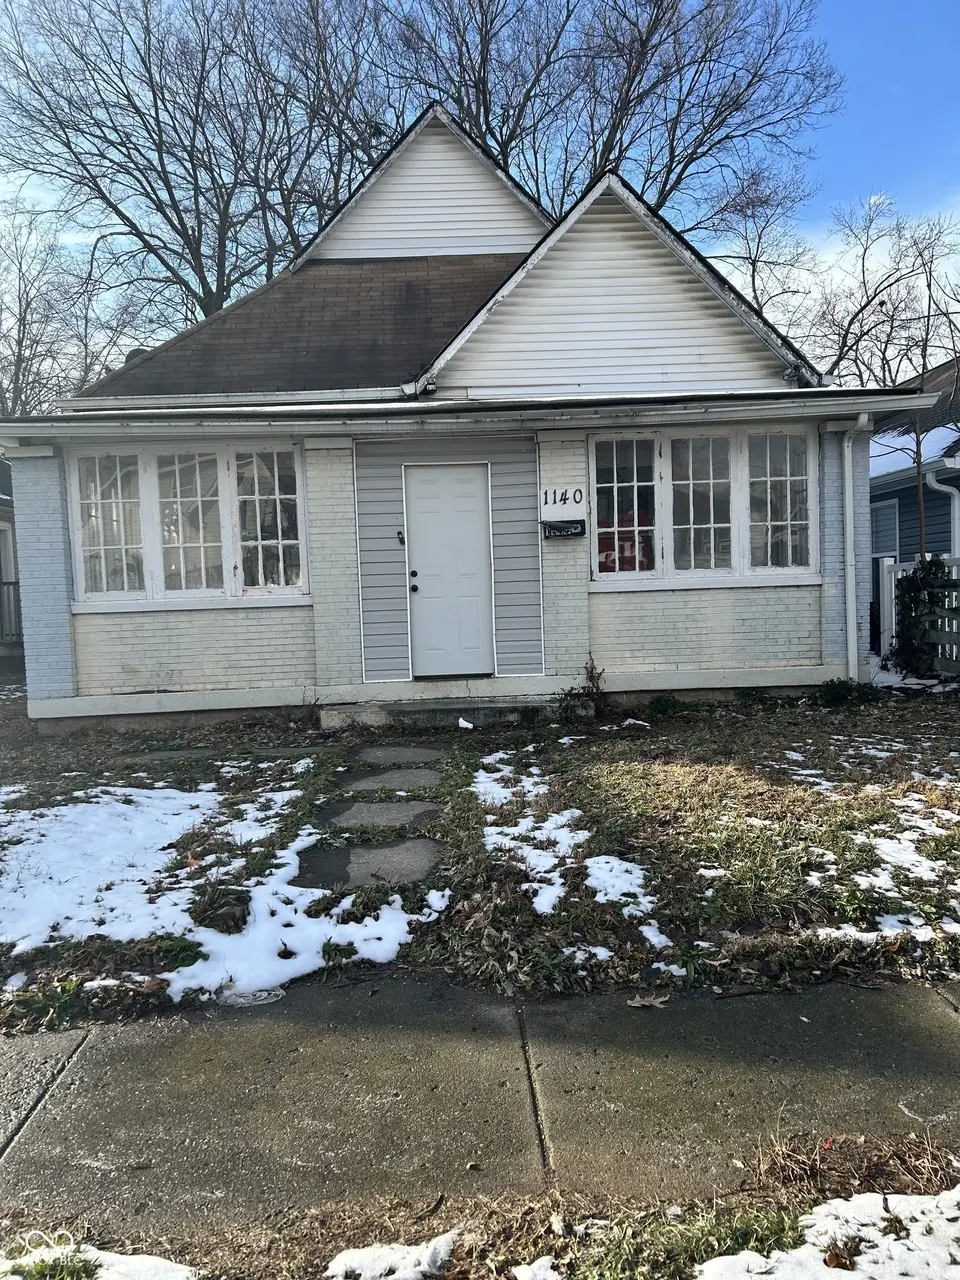
1140 N Pershing Ave · Indianapolis city (balance), IN
Flood risk 1/10 · Minimal
- FEMA flood zone
- X (unshaded)
- Chance of flooding over 30 yrs
- 0.0%
- Est. flood insurance / yr
- $473 – $860
Fire risk 1/10 · Minimal
- Est. fire insurance / yr
- $717 – $1,331
Heat risk 4/10 · Minor
- Hot days now (above 102°F)
- 7 days/yr
- Hot days in 30 yrs
- 19 days/yr
Wind risk 2/10 · Minimal
- Chance of severe wind over 30 yrs
- 0.0%
Air-quality risk 4/10 · Minor
- Unhealthy air days now
- 5 days/yr
- Unhealthy air days in 30 yrs
- 7 days/yr
Risk factors via First Street. Map © Google.
Why this score? — see what drove the B grade
The composite is a weighted blend of 9 inputs, each scored 0–100. Each bar is that input's sub-score; the figure is the points it added to the 100-point composite (weight × sub-score).
- Cash flow +30.0/30.0
- ARV discount +15.0/15.0
- DSCR +10.0/10.0
- 1% rule +9.6/10.0
- Rent growth +3.1/5.0
- Livability +2.5/5.0
- Condition / age +2.5/5.0
- Schools +1.4/10.0
- Appreciation +0.0/10.0
$90,000
🖨 Deal sheet 📄 Offer letter ✓ Due diligence
Listing remarks MLS
Set on Investor Dream Street, this home will be a dream to transform with ample backyard drive-in space! This single-family residence in Marion County offers a wonderful opportunity. The possibilities are endless to transform and create spaces that reflect individual tastes and preferences. It comprises a kitchen, living room, dining room, sun lounge, 3 bedrooms, and a single bathroom. With 1018 square feet of living area, this home offers a layout that is both practical and comfortable. Imagine the enjoyment of creating memories within these walls. The 5532 square feet lot area provides for creating your own outdoor haven This single-story home offers a wonderful opportunity to personalise as an investment property or private residence.
Key facts
- Sun lounge
- Kitchen
- Living room
Tags
Neighborhood map
What this means for you Summary
Snapshot
- This is a 3-bed/1.0-bath single-family listed at $90k.
Deal economics
- At list price, monthly cash flow is $407 ($5k/yr) — positive.
- The deal already cash-flows at list — no discount required.
- Meets the 1% rule at list price ($1k rent vs $90k).
- Recommended offer: $82k (9.0% below list) — sets the bar for market timing.
- Cap rate 11.7% vs local median 4.4% in Indianapolis city (balance) — top-decile yield for the area; either an underpriced asset or a hidden risk that comps aren't pricing in. Stress-test before assuming the spread holds.
Location & tenants
- Location reads: area grade B — affects rentability + tenant quality, not the cash-flow math above.
- Indianapolis Public Schools (urban): math 14% / reading 20% proficiency, ranked #286 of 301 in IN (top 95%) — low school quality limits family demand, transient renter base, plan for 1-2y turnover; 77% free/reduced lunch — lower-income household profile, screen leases tightly.
- Market conditions: Rents rising (+2.5%/yr); 170 active listings in the ZIP; 40 comparable units currently listed for rent nearby; rentals at typical pace (median 24d on market — plan ~3-4 weeks tenant-placement turnaround); 1,906 units permitted in Marion County in 2024 (621 in 5+ unit buildings).
- This rent runs 31% of the median local income ($51k/yr) — at the standard rent-burdened threshold; future hikes will face affordability resistance.
Forward outlook
- Local home prices are declining (-3.0%/yr); year-one equity from $622 of loan paydown is wiped out by about $3k of value loss. Plan a longer hold.
- Marion County population projected at +18% by 2050 — long-run rental-demand tailwind backs the buy-and-hold thesis.
- At projected returns (-3.0% appreciation + 2.5% rent growth), your $25k cash investment doubles in ~7 years — after that, you're playing with house money.
Negotiation context
- It's been on market 93 days — a 9% lower offer ($82k) is reasonable based on typical stale-listing flexibility.
- 6 sale attempts since 16y ago; this cycle's ask has dropped $15k (14%) from the opening price — seller is motivated, your offer sets the floor, not the list.
- Current owner paid $61k; 48% above their basis — modest negotiation headroom, anchor on the comps not their cost.
Risks & watch-outs
- Watch-outs: built in 1930 — expect roof / HVAC / electrical / plumbing capex.
Questions for the listing agent
- It's been on market 93 days. Have you received any prior offers? Is the seller open to a 9% concession, seller financing, or rate buy-down credit?
- Built in 1930 — when were the roof, HVAC, electrical panel, plumbing, and water heater last replaced?
- Why hasn't it sold? Are there any deal-killer items the seller is aware of (foundation, flood, title, zoning, code violations)?
- Is there a deadline driving the sale (1031 exchange, divorce, estate, relocation)? That informs how much negotiation room exists.
- What's the average days-on-market for RENTAL listings here right now (not sales)? A rising rental-DOM trend means longer vacancies and softer asking-rent achievability than the comps imply.
- What's the recent tenant-quality profile in this submarket — average credit score on applications, eviction rate, late-payment / NSF rate, and stable-employment percentage? A property-management company in the area should have these aggregated.
- How much new for-sale + rental construction is in the pipeline within 1–3 miles? Heavy new supply typically softens prices + rents 12–24 months out; constrained supply supports both.
Investment metrics
- 1% rule
- 1.46% ✓
- Cap rate
- 11.72%
- Cash-on-cash
- 19.39%
- DSCR
- 1.86
- GRM
- 5.7
CMA / ARV
- ARV (median comp)
- $139,469
- List price
- $90,000
- Delta
- -35.47%
- Verdict
- UNDERPRICED
- Comps
- 20 within 1.0 mi
Show comp detail 12 sales within ~0.75 mi
| Address | Dist | Beds/Ba | Sqft | Sold | Price | $/sf | Match |
|---|---|---|---|---|---|---|---|
| 1059 N Elder Ave | 0.31mi | 2/1.0 (-1) | 1,008 (-1%) | 2mo | $102,000 | $101 | 78 |
| 1148 N Pershing Ave | 0.01mi | 2/1.0 (-1) | 1,086 (+7%) | 8mo | $112,500 | $104 | 77 |
| 1014 N Sheffield Ave | 0.17mi | 3/2.0 | 952 (-6%) | 8mo | $173,000 | $182 | 71 |
| 1118 N Traub Ave | 0.21mi | 2/2.0 (-1) | 1,080 (+6%) | 0mo | $52,000 | $48 | 71 |
| 1201 N Mount St | 0.12mi | 3/2.0 | 1,158 (+14%) | 1mo | $229,000 | $198 | 67 |
| 1005 N Tremont St | 0.18mi | 2/1.0 (-1) | 1,160 (+14%) | 1mo | $100,000 | $86 | 62 |
| 1434 Winfield Ave | 0.48mi | 2/1.0 (-1) | 1,080 (+6%) | 3mo | $99,000 | $92 | 60 |
| 1405 N Mount St | 0.22mi | 2/1.0 (-1) | 1,140 (+12%) | 6mo | $90,000 | $79 | 60 |
| 1446 N Mount St | 0.29mi | 2/2.0 (-1) | 1,140 (+12%) | 4mo | $173,000 | $152 | 54 |
| 561 Lynn St | 0.57mi | 3/1.5 | 920 (-10%) | 5mo | $135,000 | $147 | 51 |
| 805 N Goodlet Ave | 0.71mi | 3/1.0 | 880 (-14%) | 3mo | $72,000 | $82 | 42 |
| 1918 Wilcox St | 0.71mi | 2/1.0 (-1) | 893 (-12%) | 2mo | $85,000 | $95 | 40 |
Match score weights: distance 35% · size 25% · config 20% · recency 20%. Top-matched comps best support the ARV.
Projected returns pro-forma
-3.0% appreciation · 2.46% rent growth · sell at horizon
- IRR
- 10.8%
- Equity multiple
- 1.42×
- Total profit
- $10,665
- Equity at exit
- $13,419
- IRR
- 19.4%
- Equity multiple
- 2.58×
- Total profit
- $39,901
- Equity at exit
- $7,782
Cash invested: $25,200 (down + closing). Projections, not guarantees.
Landlord ↔ Tenant lean methodology
- Overall (STATE)
- 90 Strongly Landlord-Friendly
- State Indiana
- 90 Strongly Landlord-Friendly · R+11
- County
- — inherits STATE
- City
- — inherits STATE
ZIP-level market 46222
- Home prices YoY
- -16.7%
- Rents YoY
- 2.5%
- Active inventory
- 170
- Price-to-rent
- 5.7×
Monthly cashflow live
- Estimated rent
- $1,314 high interval (Pro) →
- Mortgage (P&I)
- −$472
- Tax from tax record
- −$122 /mo · $1,460/yr
- Insurance
- −$38
- HOA
- −$0
- Vacancy / Maint / Mgmt
- −$276
- Net cashflow
- $407
Break-even live
UW: 25.0% down · 7.5% · 30yr · 1.5% tax · 5.0% vac · 8.0% maint · 8.0% mgmt
Financing live
Cash to close
- Down payment
- $22,500
- Closing costs
- $2,700
- Reserves months
- —
- Total cash needed
- —
Loan-product check · same deal, 3 products live
Conventional
25% down · 7.5% · 30yr
- Down + closing
- —
- Monthly P&I
- —
- Monthly cashflow
- —
- DSCR
- —
- Eligible?
- —
Personal DTI + credit; lowest rate.
DSCR
20% down · 8.5% · 30yr
- Down + closing
- —
- Monthly P&I
- —
- Monthly cashflow
- —
- DSCR
- —
- Eligible?
- —
No personal income docs; deal must DSCR.
Hard money
10% down · 12.0% · 12mo
- Down + closing
- —
- Monthly P&I
- —
- Monthly cashflow
- —
- DSCR
- —
- Eligible?
- —
Short-term bridge; refi at stabilization.
Rent comps 40 comps
| Address | Beds | Baths | Sqft | Rent | $/sqft | DOM | Units | Dist |
|---|---|---|---|---|---|---|---|---|
| 1023 N Pershing Ave Indianapolis, IN | 3.0 | 1.5 | 1182 | $1,350 | $1.14 | 23d | 1 | 0.19mi |
| 1155 N Holmes Ave Indianapolis, IN | 3.0 | 1.0 | 952 | $2,800 | $2.94 | 3d | 1 | 0.26mi |
| 955 N Traub Ave Indianapolis, IN | 3.0 | 2.0 | 1300 | $1,449 | $1.11 | 43d | 1 | 0.35mi |
| 1409 N Warman Ave Indianapolis, IN | 2.0 | 1.0 | 816 | $1,300 | $1.59 | 20d | 1 | 0.36mi |
| 2701 W 17th St Indianapolis, IN | 2.0 | 1.0 | 810 | $899 | $1.11 | 7d | 1 | 0.43mi |
| 1150 N White River Pkwy West Dr Indianapolis, IN | 1.0–2.0 | 1.0 | 722 | $1,224 | $1.69 | 1d | 9 | 0.49mi |
| 3014 W 10th St Unit 1 Indianapolis, IN | 2.0 | 1.0 | 850 | $749 | $0.88 | 23d | 1 | 0.52mi |
| 3014 W 10th St Indianapolis, IN | 2.0 | 1.0 | 850 | $749 | $0.88 | 43d | 1 | 0.52mi |
| 771 Haugh St Indianapolis, IN | 2.0 | 1.0 | 714 | $1,250 | $1.75 | 20d | 1 | 0.55mi |
| 525 N Belmont Ave Indianapolis, IN | 3.0 | 1.0 | 912 | $1,225 | $1.34 | 23d | 1 | 0.62mi |
| 1911 Wilcox St Indianapolis, IN | 2.0 | 1.0 | 896 | $1,150 | $1.28 | 43d | 1 | 0.77mi |
| 1410 Breedlove Ln Indianapolis, IN | 2.0 | 1.0–2.0 | 886 | $2,557 | $2.88 | 1d | 63 | 0.80mi |
| 2106 Cold Spring Rd Indianapolis, IN | 2.0 | 1.0–1.5 | 940 | $1,189 | $1.26 | 3d | 4 | 0.85mi |
| 460 N White River Parkway Dr W Indianapolis, IN | 2.0 | 1.0 | 681 | $1,725 | $2.53 | 3d | 14 | 0.85mi |
| 2011 N Kessler Boulevard Dr Indianapolis, IN | 3.0 | 1.0 | 888 | $1,375 | $1.55 | 23d | 1 | 0.88mi |
| 1228 W 18th St Indianapolis, IN | 2.0 | 1.0 | 1050 | $1,200 | $1.14 | 43d | 1 | 0.98mi |
| 1920 Sugar Grove Ave Indianapolis, IN | 3.0 | 1.5 | 1378 | $1,175 | $0.85 | 3d | 1 | 1.03mi |
| 264 N Holmes Ave Indianapolis, IN | 2.0 | 1.0 | 1092 | $1,200 | $1.10 | 10d | 1 | 1.03mi |
| 411 N Centennial St Indianapolis, IN | 2.0 | 1.0 | 750 | $995 | $1.33 | 7d | 1 | 1.05mi |
| 1201 Indiana Ave Indianapolis, IN | 1.0–3.0 | 1.0–3.5 | 967 | $2,404 | $2.49 | 1d | 36 | 1.07mi |
| 240 N Warman Ave Indianapolis, IN | 2.0–3.0 | 1.0–2.0 | 1052 | $1,400 | $1.33 | 20d | 5 | 1.09mi |
| 210 N Richland St Indianapolis, IN | 4.0 | 2.0 | 1062 | $1,625 | $1.53 | 14d | 1 | 1.10mi |
| 1449 Montcalm St Indianapolis, IN | 3.0 | 1.0 | 1300 | $1,900 | $1.46 | 43d | 1 | 1.10mi |
| 3531 Garden Ave Indianapolis, IN | 3.0 | 1.0 | 1264 | $1,200 | $0.95 | 23d | 1 | 1.11mi |
| 3531 Garden Ave Indianapolis, IN | 3.0 | 1.0 | 1264 | $1,200 | $0.95 | 43d | 1 | 1.11mi |
| 86 N Holmes Ave Indianapolis, IN | 2.0 | 1.0 | 978 | $1,050 | $1.07 | 16d | 1 | 1.16mi |
| 1415 W Pruitt St Indianapolis, IN | 3.0 | 1.0 | 1001 | $1,249 | $1.25 | 23d | 1 | 1.16mi |
| 925 N Somerset Ave Indianapolis, IN | 3.0 | 1.0 | 1061 | $1,300 | $1.23 | 7d | 1 | 1.20mi |
| 1367 W Pruitt St Indianapolis, IN | 3.0 | 1.0 | 1088 | $1,450 | $1.33 | 43d | 1 | 1.22mi |
| 2248 N Harding St Indianapolis, IN | 2.0 | 1.0 | 1100 | $899 | $0.82 | 23d | 1 | 1.22mi |
| 1135 W 21st St Indianapolis, IN | 3.0 | 2.0 | 1296 | $1,495 | $1.15 | 23d | 1 | 1.22mi |
| 1133 W 21st St Indianapolis, IN | 3.0 | 2.0 | 1296 | $1,495 | $1.15 | 23d | 1 | 1.23mi |
| 1621 N Livingston Ave Indianapolis, IN | 3.0 | 1.0 | 952 | $1,300 | $1.37 | 23d | 1 | 1.28mi |
| 2602 Mansion Dr Indianapolis, IN | 2.0–3.0 | 2.0 | 1850 | $1,675 | $0.91 | 7d | 6 | 1.28mi |
| 2365 N Goodlet Ave Indianapolis, IN | 3.0 | 1.5 | 900 | $1,099 | $1.22 | 23d | 1 | 1.32mi |
| 930 W 10th St Indianapolis, IN | 1.0–4.0 | 1.0–4.0 | 874 | $3,144 | $3.59 | 4d | 1 | 1.36mi |
| 2418 N Centennial St Indianapolis, IN | 2.0 | 1.0 | 725 | $1,099 | $1.52 | 43d | 1 | 1.37mi |
| 101 S Harding St Apt 307 Indianapolis, IN | 2.0 | 2.0 | 970 | $1,685 | $1.74 | 3d | 1 | 1.44mi |
| 735 W 11th St Indianapolis, IN | 2.0 | 1.0 | 712 | $1,398 | $1.96 | 43d | 1 | 1.45mi |
| 3621 Lawnview Ln Indianapolis, IN | 1.0–4.0 | 1.0–1.5 | 1012 | $1,162 | $1.15 | 1d | 13 | 1.46mi |
Listing history 26 events
-
2026-06-17days on market $90,000 Active 93 DOM
-
2026-06-16days on market $90,000 Active 92 DOM
-
2026-06-15days on market $90,000 Active 91 DOM
-
2026-06-13days on market $90,000 Active 89 DOM
-
2026-06-13days on market $90,000 Active 88 DOM
-
2026-06-09days on market $90,000 Active 85 DOM
-
2026-06-08days on market $90,000 Active 84 DOM
-
2026-06-07days on market $90,000 Active 83 DOM
-
2026-06-03days on market $90,000 Active 79 DOM
-
2026-06-02days on market $90,000 Active 78 DOM
-
2026-06-01days on market $90,000 Active 77 DOM
-
2026-05-31days on market $90,000 Active 76 DOM
-
2026-05-12status Active 756-char remark
Show marketing remark (756 chars)
Set on Investor Dream Street, this home will be a dream to transform with ample backyard drive-in space! This single-family residence in Marion County offers a wonderful opportunity. The possibilities are endless to transform and create spaces that reflect individual tastes and preferences. It comprises a kitchen, living room, dining room, sun lounge, 3 bedrooms, and a single bathroom. With 1018 square feet of living area, this home offers a layout that is both practical and comfortable. Imagine the enjoyment of creating memories within these walls. The 5532 square feet lot area provides for creating your own outdoor haven This single-story home offers a wonderful opportunity to personalise as an investment property or private residence.
-
2026-04-21status Pending 756-char remark
Show marketing remark (756 chars)
Set on Investor Dream Street, this home will be a dream to transform with ample backyard drive-in space! This single-family residence in Marion County offers a wonderful opportunity. The possibilities are endless to transform and create spaces that reflect individual tastes and preferences. It comprises a kitchen, living room, dining room, sun lounge, 3 bedrooms, and a single bathroom. With 1018 square feet of living area, this home offers a layout that is both practical and comfortable. Imagine the enjoyment of creating memories within these walls. The 5532 square feet lot area provides for creating your own outdoor haven This single-story home offers a wonderful opportunity to personalise as an investment property or private residence.
-
2026-04-18status Active 756-char remark
Show marketing remark (756 chars)
Set on Investor Dream Street, this home will be a dream to transform with ample backyard drive-in space! This single-family residence in Marion County offers a wonderful opportunity. The possibilities are endless to transform and create spaces that reflect individual tastes and preferences. It comprises a kitchen, living room, dining room, sun lounge, 3 bedrooms, and a single bathroom. With 1018 square feet of living area, this home offers a layout that is both practical and comfortable. Imagine the enjoyment of creating memories within these walls. The 5532 square feet lot area provides for creating your own outdoor haven This single-story home offers a wonderful opportunity to personalise as an investment property or private residence.
-
2026-04-04status Pending 756-char remark
Show marketing remark (756 chars)
Set on Investor Dream Street, this home will be a dream to transform with ample backyard drive-in space! This single-family residence in Marion County offers a wonderful opportunity. The possibilities are endless to transform and create spaces that reflect individual tastes and preferences. It comprises a kitchen, living room, dining room, sun lounge, 3 bedrooms, and a single bathroom. With 1018 square feet of living area, this home offers a layout that is both practical and comfortable. Imagine the enjoyment of creating memories within these walls. The 5532 square feet lot area provides for creating your own outdoor haven This single-story home offers a wonderful opportunity to personalise as an investment property or private residence.
-
2026-03-23status Active 756-char remark
Show marketing remark (756 chars)
Set on Investor Dream Street, this home will be a dream to transform with ample backyard drive-in space! This single-family residence in Marion County offers a wonderful opportunity. The possibilities are endless to transform and create spaces that reflect individual tastes and preferences. It comprises a kitchen, living room, dining room, sun lounge, 3 bedrooms, and a single bathroom. With 1018 square feet of living area, this home offers a layout that is both practical and comfortable. Imagine the enjoyment of creating memories within these walls. The 5532 square feet lot area provides for creating your own outdoor haven This single-story home offers a wonderful opportunity to personalise as an investment property or private residence.
-
2026-03-13status Pending 756-char remark
Show marketing remark (756 chars)
Set on Investor Dream Street, this home will be a dream to transform with ample backyard drive-in space! This single-family residence in Marion County offers a wonderful opportunity. The possibilities are endless to transform and create spaces that reflect individual tastes and preferences. It comprises a kitchen, living room, dining room, sun lounge, 3 bedrooms, and a single bathroom. With 1018 square feet of living area, this home offers a layout that is both practical and comfortable. Imagine the enjoyment of creating memories within these walls. The 5532 square feet lot area provides for creating your own outdoor haven This single-story home offers a wonderful opportunity to personalise as an investment property or private residence.
-
2026-03-03price $90,000 756-char remark
Show marketing remark (756 chars)
Set on Investor Dream Street, this home will be a dream to transform with ample backyard drive-in space! This single-family residence in Marion County offers a wonderful opportunity. The possibilities are endless to transform and create spaces that reflect individual tastes and preferences. It comprises a kitchen, living room, dining room, sun lounge, 3 bedrooms, and a single bathroom. With 1018 square feet of living area, this home offers a layout that is both practical and comfortable. Imagine the enjoyment of creating memories within these walls. The 5532 square feet lot area provides for creating your own outdoor haven This single-story home offers a wonderful opportunity to personalise as an investment property or private residence.
-
2026-02-27status Active 756-char remark
Show marketing remark (756 chars)
Set on Investor Dream Street, this home will be a dream to transform with ample backyard drive-in space! This single-family residence in Marion County offers a wonderful opportunity. The possibilities are endless to transform and create spaces that reflect individual tastes and preferences. It comprises a kitchen, living room, dining room, sun lounge, 3 bedrooms, and a single bathroom. With 1018 square feet of living area, this home offers a layout that is both practical and comfortable. Imagine the enjoyment of creating memories within these walls. The 5532 square feet lot area provides for creating your own outdoor haven This single-story home offers a wonderful opportunity to personalise as an investment property or private residence.
-
2026-01-15status Pending 756-char remark
Show marketing remark (756 chars)
Set on Investor Dream Street, this home will be a dream to transform with ample backyard drive-in space! This single-family residence in Marion County offers a wonderful opportunity. The possibilities are endless to transform and create spaces that reflect individual tastes and preferences. It comprises a kitchen, living room, dining room, sun lounge, 3 bedrooms, and a single bathroom. With 1018 square feet of living area, this home offers a layout that is both practical and comfortable. Imagine the enjoyment of creating memories within these walls. The 5532 square feet lot area provides for creating your own outdoor haven This single-story home offers a wonderful opportunity to personalise as an investment property or private residence.
-
2025-12-17$105,000 Active 756-char remark
Show marketing remark (756 chars)
Set on Investor Dream Street, this home will be a dream to transform with ample backyard drive-in space! This single-family residence in Marion County offers a wonderful opportunity. The possibilities are endless to transform and create spaces that reflect individual tastes and preferences. It comprises a kitchen, living room, dining room, sun lounge, 3 bedrooms, and a single bathroom. With 1018 square feet of living area, this home offers a layout that is both practical and comfortable. Imagine the enjoyment of creating memories within these walls. The 5532 square feet lot area provides for creating your own outdoor haven This single-story home offers a wonderful opportunity to personalise as an investment property or private residence.
-
2020-07-09soldstatus $60,900
-
2010-11-12historical 48-char remark
Show marketing remark (48 chars)
Investment opportunity on Indy's near west side.
-
2010-11-12soldstatus $3,000 48-char remark
Show marketing remark (48 chars)
Investment opportunity on Indy's near west side.
-
2010-09-14$9,900 48-char remark
Show marketing remark (48 chars)
Investment opportunity on Indy's near west side.
ⓘ Source: listings_history table (triggers on properties + properties_extension) + one-shot
backfill from property_details.listing_events for pre-trigger history.
Tax reassessment forecast IN · Partial reset (capped growth)
- Current annual tax
- $1,460 · $122/mo
- Projected year-2 tax
- $1,460 · $122/mo
- Expected delta
- $0/yr ($0/mo · 0.0%)
ⓘ Screening estimate from a state-policy table — verify with the county assessor before closing.
Climate risk First Street
- Flood 1/10 Low FEMA zone X (unshaded) · 0% chance over 30 yrs
- Wildfire 1/10 Low
- Heat 4/10 Moderate 7 d/yr ≥102°F today · 19 d/yr by 30 yrs out
- Wind 2/10 Low 0% chance of damaging wind over 30 yrs
- Air quality 4/10 Moderate 5 unhealthy d/yr today · 7 by 30 yrs out
Nearby sold comps map
Loading sold comps map…
Walkable amenities ~0.75 mi
Loading nearby amenities…
Taxation est. · year 1
- Rental income
- $15,771
- − Mortgage interest
- −$5,041
- − Property taxes
- −$1,460
- − Insurance
- −$450
- − Repairs & maintenance
- −$1,262
- − Management
- −$1,262
- − Depreciation
- −$2,618
- Taxable income
- $3,679
- Est. tax owed @ 24.0%
- −$883
- After-tax cash flow
- $4,003/yr
For passive investors: Depreciation is non-cash, so a rental often shows a tax loss while cash-flowing — sheltering income. Rental losses are passive: they offset passive income freely, and up to $25,000/yr can offset ordinary (W-2) income if you actively participate and your MAGI is under $100k (phasing out to $0 by $150k); unused losses carry forward. On sale, claimed depreciation is recaptured at up to 25%, and gains may owe capital-gains tax (a 1031 exchange can defer both). Figures are a year-1 estimate at your 24.0% rate — not tax advice; consult a CPA.
Schools (NCES district)
- District
- Indianapolis Public Schools
- NCES district ID
- 1804770
- Math proficiency
- 14% ▼ -7.00%
- Reading proficiency
- 20% ▼ -3.00%
- Median HH income
- $32,034
- Composite
- 13.69/100
- National rank
- #9499
- State rank
- #286 of 301 in IN
Livability — Indianapolis city (balance)
No livability data for this city. (Only ~50 U.S. cities are tracked.)
Census & demographics
- Census place
- Indianapolis city (balance), IN
- County
- Marion County · 998,460 people
- City population
- 881,119
- Metro
- Indianapolis-Carmel-Anderson, IN
- Population (ZIP)
- 38,887
- Household income
- $50,783
- Rent vs Own
- Severe rent burden
- 1750.0
Population outlook (Marion County) Hauer SSP2
- Today (2025)
- 1,025,572 people
- By 2030
- 1,065,727 · +3.9%
- By 2040
- 1,141,577 · +11.3%
- By 2050
- 1,208,920 · +17.9%
- By 2075
- 1,367,288 · +33.3%
- By 2100
- 1,438,201 · +40.2%
Race, ethnicity, and origin ACS 2023
- Neighborhood character
- Highly diverse neighborhood (Simpson 0.72)
- Race & ethnicity
- White 32% Black 30% Hispanic / Latino 30% Two or more races 12% Asian 2%
- Hispanic origin (detail)
- Mexican 24% Puerto Rican 1%
- Common ancestry
- Lithuanian 1% Iranian 1% Slovak 1%
- Foreign-born
- 21% · Canada, Jamaica
- Languages at home
- 67% English-only · Spanish 25% Other Indo-European 3% Arabic 2%
Political lean MEDSL · Marion
- 2024 margin
- Strong D (+27.7) · D 63.0% · R 35.3% · Other 1.7%
- 2008→2024 swing
- -0.7pp no change · 2008: 28.4pp · 2024: 27.7pp
- All cycles
- 2024: D+27.7 2020: D+29.1 2016: D+22.8 2012: D+22.2 2008: D+28.4
Not yet ingested
- Civics
- —
Market trends
- HPI YoY
- ▼ -75.47%
- Current HPI
- 375.8479
- Rent YoY
- ▲ 2.46%
- Metro
- Indianapolis-Carmel-Anderson, IN
- State GDP YoY
- ▲ 2.90%
- F500 in state
- 18
Industry mix (Fortune 500 HQ in IN)
| Industry | F500 HQs | Revenue |
|---|---|---|
| Industrial Machinery | 2 | $37B |
|
||
| Healthcare | 1 | $177B |
|
||
| Pharmaceuticals | 1 | $45B |
|
||
| Metals / Steel | 1 | $18B |
|
||
| Agriculture | 1 | $17B |
|
||
| Packaging | 1 | $12B |
|
||
Price history
+809.1% since first listed14 events — show timeline
- 2026-05-12 Relisted — MIBOR as Distributed by MLS Grid
- 2026-04-21 Pending — MIBOR as Distributed by MLS Grid
- 2026-04-18 Relisted — MIBOR as Distributed by MLS Grid
- 2026-04-04 Pending — MIBOR as Distributed by MLS Grid
- 2026-03-23 Relisted — MIBOR as Distributed by MLS Grid
- 2026-03-13 Pending — MIBOR as Distributed by MLS Grid
- 2026-03-03 Price Changed $90,000 MIBOR as Distributed by MLS Grid
- 2026-02-27 Relisted — MIBOR as Distributed by MLS Grid
- 2026-01-15 Pending — MIBOR as Distributed by MLS Grid
- 2025-12-17 Listed $105,000 MIBOR as Distributed by MLS Grid
- 2020-07-09 Sold (Public Records) $60,900 Public Records
- 2010-11-12 Listing Removed — MIBOR as Distributed by MLS Grid
- 2010-11-12 Sold (MLS) $3,000 MIBOR as Distributed by MLS Grid
- 2010-09-14 Listed $9,900 MIBOR as Distributed by MLS Grid
Property tax history
+15.9%/yrLatest (2025): $1,460 · -4.3% YoY. Source: county tax records.
Cash-flow waterfall
monthlySold comps — $/sqft
last 12 mo · ≤1 miLoading sold comps…