358 W Iroquois Rd · Pontiac, MI
Flood risk 1/10 · Minimal
- FEMA flood zone
- X (unshaded)
- Chance of flooding over 30 yrs
- 0.0%
- Est. flood insurance / yr
- $507 – $1,088
Fire risk 1/10 · Minimal
- Est. fire insurance / yr
- $784 – $1,456
Heat risk 2/10 · Minimal
- Hot days now (above 96°F)
- 7 days/yr
- Hot days in 30 yrs
- 15 days/yr
Wind risk 2/10 · Minimal
- Chance of severe wind over 30 yrs
- —
Air-quality risk 3/10 · Minor
- Unhealthy air days now
- 2 days/yr
- Unhealthy air days in 30 yrs
- 4 days/yr
Risk factors via First Street. Map © Google.
Why this score? — see what drove the D- grade
The composite is a weighted blend of 9 inputs, each scored 0–100. Each bar is that input's sub-score; the figure is the points it added to the 100-point composite (weight × sub-score).
- Cash flow +16.7/30.0
- DSCR +5.2/10.0
- ARV discount +4.4/15.0
- 1% rule +3.7/10.0
- Livability +3.2/5.0
- Rent growth +2.5/5.0
- Condition / age +2.5/5.0
- Schools +1.0/10.0
- Appreciation +0.0/10.0
$199,000
🖨 Deal sheet (PDF) 📄 Offer letter ✓ Due diligence
Listing remarks MLS
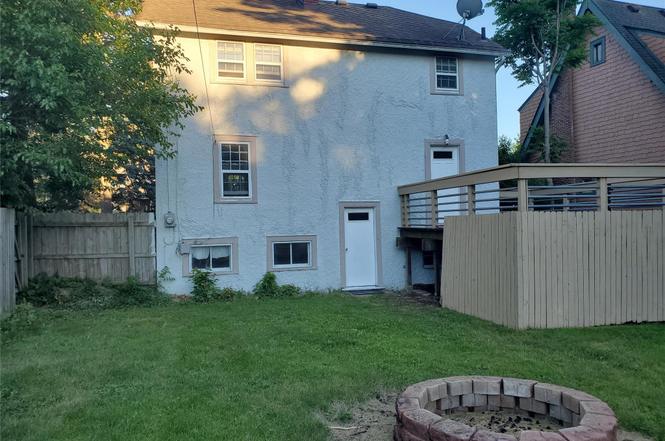
3 bedrooms house with full basement located in affluent area of Pontiac. It has one full bath and two half baths. The backyard and huge deck provides an excellent entertainment for family.
Key facts
- Backyard
- Full basement
- Huge deck
Tags
Property features AI
Finance
- Other: Pets allowed
Exterior
- Parking: No garage
- Utilities: Public water; Public sewer
- Home design: Single-family residence; Two levels; Ground-level entry with steps; Stucco exterior
- Construction: Built with block foundation
- Exterior features: Balcony; Corner lot; Paved road access; Lot approximately 0.33 acres (50 x 85)
Interior
- Kitchen: Free-standing electric oven
- Bedrooms: 6 total rooms
- Bathrooms: 1 full bathroom; 2 half bathrooms
- Heating & cooling: Central air conditioning; Forced air heating (natural gas)
- Interior features: Entrance foyer; Finished basement
Neighborhood map
What this means for you Summary
Snapshot
- This is a 3-bed/1.0-bath single-family listed at $199k.
Deal economics
- At list price, monthly cash flow is $123 ($1k/yr) — positive.
- The deal already cash-flows at list — no discount required.
- To meet the 1% rule (rent ≥ 1% of price), the offer needs to be $174k (12.8% below list).
- Recommended offer: $174k (12.8% below list) — sets the bar for 1% rule.
- Cap rate 7.0% vs local median 5.4% in Pontiac — top-decile yield for the area; either an underpriced asset or a hidden risk that comps aren't pricing in. Stress-test before assuming the spread holds.
Location & tenants
- Location reads 64/100 on livability (#499 in MI) — a middle-class / working-renter tenant base. Strengths: commute A+, cost of living A+, housing A+; Watch: health & safety D, crime F, amenities F.
- Pontiac City School District (urban): math 8% / reading 17% proficiency, ranked #514 of 540 in MI (top 95%) — low school quality limits family demand, transient renter base, plan for 1-2y turnover; 81% free/reduced lunch — lower-income household profile, screen leases tightly.
- Zoned schools: Whitman Elementary School (math 8% / reading 8%, grade F, #1,300 of 1,397 statewide, top 94%, 601 students, 81% FRL); Pontiac Middle School (math 8% / reading 23%, grade F, #450 of 493 statewide, top 91%, 729 students, 81% FRL); Pontiac High School (math 12% / reading 27%, grade F, #622 of 713 statewide, top 88%, 935 students, 75% FRL) — zoned schools at 79% FRL track the district average.
- Market conditions: 100 active listings in the ZIP; 10 comparable units currently listed for rent nearby; rentals at typical pace (median 26d on market — plan ~3-4 weeks tenant-placement turnaround); 2,614 units permitted in Oakland County in 2024 (721 in 5+ unit buildings).
- This rent runs 41% of the median local income ($51k/yr) — at the standard rent-burdened threshold; future hikes will face affordability resistance.
Forward outlook
- Local home prices are declining (-3.0%/yr); year-one equity from $1k of loan paydown is wiped out by about $6k of value loss. Plan a longer hold.
- Oakland County population projected at +10% by 2050 — modest demand growth; plan on rents tracking national, not racing it.
Negotiation context
- Only 6 days on market — expect competitive offers; lowballing is unlikely to land.
- 6 sale attempts since 23y ago with the ask held roughly flat each time — persistent listings suggest the price (not the market) is what's stuck; bring a comps-based counter.
- Current owner paid $158k; 26% above their basis — modest negotiation headroom, anchor on the comps not their cost.
Risks & watch-outs
- Watch-outs: built in 1950 — expect roof / HVAC / electrical / plumbing capex.
Questions for the listing agent
- Built in 1950 — when were the roof, HVAC, electrical panel, plumbing, and water heater last replaced?
- Is there a deadline driving the sale (1031 exchange, divorce, estate, relocation)? That informs how much negotiation room exists.
- Schools are F-rated, which usually means shorter tenancies and higher turnover. Who's the typical renter profile here, and what's been the actual vacancy rate?
- Crime grade is F in this area — have there been break-ins, vandalism, or insurance claims at this property in the last 3 years? What carrier currently insures it and at what premium?
- The area grade is low — what's the realistic commute time and amenity access for the typical tenant pool here? Any planned neighborhood developments (good or bad) we should know about?
- What's the average days-on-market for RENTAL listings here right now (not sales)? A rising rental-DOM trend means longer vacancies and softer asking-rent achievability than the comps imply.
- What's the recent tenant-quality profile in this submarket — average credit score on applications, eviction rate, late-payment / NSF rate, and stable-employment percentage? A property-management company in the area should have these aggregated.
- How much new for-sale + rental construction is in the pipeline within 1–3 miles? Heavy new supply typically softens prices + rents 12–24 months out; constrained supply supports both.
Investment metrics
- 1% rule
- 0.87% ✗
- Cap rate
- 7.03%
- Cash-on-cash
- 2.64%
- DSCR
- 1.12
- GRM
- 9.6
CMA / ARV
- ARV (on-the-fly)
- $186,298
- Comps found
- 12
Show comp detail 12 sales within ~0.75 mi
| Address | Dist | Beds/Ba | Sqft | Sold | Price | $/sf | Match |
|---|---|---|---|---|---|---|---|
| 555 W Huron St | 0.21mi | 4/1.0 (+1) | 1,862 (-2%) | 4mo | $35,000 | $19 | 79 |
| 160 Navajo Ave | 0.24mi | 3/1.0 | 1,787 (-6%) | 3mo | $180,000 | $101 | 76 |
| 671 W Huron St | 0.11mi | 4/1.5 (+1) | 1,748 (-8%) | 9mo | $90,000 | $51 | 67 |
| 16 Utica Rd | 0.28mi | 3/1.5 | 1,690 (-11%) | 4mo | $210,000 | $124 | 63 |
| 84 Chippewa Rd | 0.11mi | 3/1.5 | 1,617 (-15%) | 9mo | $165,000 | $102 | 61 |
| 217 Navajo Ave | 0.31mi | 3/1.5 | 1,724 (-9%) | 9mo | $135,000 | $78 | 60 |
| 24 Mohawk Rd | 0.38mi | 3/1.0 | 1,691 (-11%) | 5mo | $136,000 | $80 | 60 |
| 162 N Genesee Ave | 0.50mi | 3/2.0 | 2,050 (+8%) | 0mo | $200,000 | $98 | 59 |
| 124 Henry Clay Ave | 0.46mi | 4/1.0 (+1) | 2,117 (+11%) | 4mo | $107,500 | $51 | 51 |
| 855 Menominee Rd | 0.43mi | 3/1.5 | 1,633 (-14%) | 8mo | $175,000 | $107 | 48 |
| 44 Lake St | 0.62mi | 3/1.0 | 1,684 (-11%) | 5mo | $72,000 | $43 | 47 |
| 729 W Margaret Ln | 0.72mi | 3/2.5 | 1,707 (-10%) | 2mo | $235,000 | $138 | 41 |
Match score weights: distance 35% · size 25% · config 20% · recency 20%. Top-matched comps best support the ARV.
Projected returns pro-forma
-3.0% appreciation · 3.0% rent growth · sell at horizon
- IRR
- -12.2%
- Equity multiple
- 0.56×
- Total profit
- $-24,491
- Equity at exit
- $29,672
- IRR
- -3.1%
- Equity multiple
- 0.79×
- Total profit
- $-11,484
- Equity at exit
- $17,206
Cash invested: $55,720 (down + closing). Projections, not guarantees.
Landlord ↔ Tenant lean methodology
- Overall (STATE)
- 62 Landlord-Friendly
- State Michigan
- 62 Landlord-Friendly · EVEN
- County
- — inherits STATE
- City
- — inherits STATE
ZIP-level market 48341
- Active inventory
- 100
- Price-to-rent
- 9.6×
Monthly cashflow live
- Estimated rent
- $1,735 high interval (Pro) →
- Mortgage (P&I)
- −$1,044
- Tax from tax record
- −$122 /mo · $1,460/yr
- Insurance
- −$83
- HOA
- −$0
- Vacancy / Maint / Mgmt
- −$364
- Net cashflow
- $123
Break-even live
Sensitivity live
| Price | -10% $235 | -5% $179 | +0% $123 | +5% $66 | +10% $10 |
|---|---|---|---|---|---|
| Rent | -10% $-14 | -5% $54 | +0% $123 | +5% $191 | +10% $260 |
| Rate | -1.0pp $223 | -0.5pp $173 | base $123 | +0.5pp $71 | +1.0pp $19 |
UW: 25.0% down · 7.5% · 30yr · 1.5% tax · 5.0% vac · 8.0% maint · 8.0% mgmt
Financing live
Cash to close
- Down payment
- $49,750
- Closing costs
- $5,970
- Reserves months
- —
- Total cash needed
- —
Loan-product check · same deal, 3 products live
Conventional
25% down · 7.5% · 30yr
- Down + closing
- —
- Monthly P&I
- —
- Monthly cashflow
- —
- DSCR
- —
- Eligible?
- —
Personal DTI + credit; lowest rate.
DSCR
20% down · 8.5% · 30yr
- Down + closing
- —
- Monthly P&I
- —
- Monthly cashflow
- —
- DSCR
- —
- Eligible?
- —
No personal income docs; deal must DSCR.
Hard money
10% down · 12.0% · 12mo
- Down + closing
- —
- Monthly P&I
- —
- Monthly cashflow
- —
- DSCR
- —
- Eligible?
- —
Short-term bridge; refi at stabilization.
Rent comps 10 comps
| Address | Beds | Baths | Sqft | Rent | $/sqft | DOM | Units | Dist |
|---|---|---|---|---|---|---|---|---|
| 99 Chippewa Rd Pontiac, MI | 4.0 | 1.0 | 1315 | $1,750 | $1.33 | 26d | 1 | 0.13mi |
| 74 E Iroquois Rd Pontiac, MI | 3.0 | 1.0 | 1661 | $1,695 | $1.02 | 26d | 1 | 0.32mi |
| 5 Wenonah Dr Pontiac, MI | 4.0 | 1.5 | 1749 | $2,000 | $1.14 | 45d | 1 | 0.34mi |
| 223 Tucker St Pontiac, MI | 2.0 | 2.5 | 1295 | $1,700 | $1.31 | 19d | 1 | 0.57mi |
| 27 Sylvan Pontiac, MI | 2.0 | 1.5 | 1370 | $1,175 | $0.86 | 14d | 1 | 0.63mi |
| 949 Boston Ave Waterford Twp, MI | 2.0 | 1.0 | 1320 | $1,150 | $0.87 | 45d | 1 | 0.64mi |
| 91 Waterly Ave Waterford, MI | 3.0 | 1.5 | 1550 | $1,660 | $1.07 | 3d | 1 | 0.89mi |
| 1056 Berwick Blvd Pontiac, MI | 4.0 | 2.5 | 2600 | $1,950 | $0.75 | 45d | 1 | 0.90mi |
| 59 N Lynn Ave Waterford, MI | 3.0 | 1.0 | 1300 | $2,100 | $1.62 | 4d | 1 | 1.03mi |
| 21 N Saginaw St Pontiac, MI | 2.0 | 2.5 | 2500 | $2,500 | $1.00 | 0d | 1 | 1.20mi |
Listing history 5 events
-
2026-06-21days on market $199,000 Active 6 DOM
-
2026-06-18days on market $199,000 Active 3 DOM
-
2026-06-17days on market $199,000 Active 2 DOM
-
2026-06-16remarks 188-char remark
-
2026-06-16$199,000 Active 1 DOM
ⓘ Source: listings_history table (triggers on properties + properties_extension) + one-shot
backfill from property_details.listing_events for pre-trigger history.
Tax reassessment forecast MI · Partial reset (capped growth)
- Current annual tax
- $1,460 · $122/mo
- Projected year-2 tax
- $2,262 · $189/mo
- Expected delta
- +$802/yr (+$67/mo · 54.9%)
ⓘ Screening estimate from a state-policy table — verify with the county assessor before closing.
Climate risk First Street
- Flood 1/10 Low FEMA zone X (unshaded) · 0% chance over 30 yrs
- Wildfire 1/10 Low
- Heat 2/10 Low 7 d/yr ≥96°F today · 15 d/yr by 30 yrs out
- Wind 2/10 Low
- Air quality 3/10 Moderate 2 unhealthy d/yr today · 4 by 30 yrs out
Nearby sold comps map
Loading sold comps map…
Walkable amenities ~0.75 mi
Loading nearby amenities…
Taxation est. · year 1
- Rental income
- $20,822
- − Mortgage interest
- −$11,147
- − Property taxes
- −$1,460
- − Insurance
- −$995
- − Repairs & maintenance
- −$1,666
- − Management
- −$1,666
- − Depreciation
- −$5,789
- Taxable loss
- −$1,901
- Est. tax savings @ 24.0%
- +$456
- After-tax cash flow
- $1,927/yr
For passive investors: Depreciation is non-cash, so a rental often shows a tax loss while cash-flowing — sheltering income. Rental losses are passive: they offset passive income freely, and up to $25,000/yr can offset ordinary (W-2) income if you actively participate and your MAGI is under $100k (phasing out to $0 by $150k); unused losses carry forward. On sale, claimed depreciation is recaptured at up to 25%, and gains may owe capital-gains tax (a 1031 exchange can defer both). Figures are a year-1 estimate at your 24.0% rate — not tax advice; consult a CPA.
Schools (NCES district)
- District
- Pontiac City School District
- NCES district ID
- 2628740
- Math proficiency
- 8% ▼ -5.00%
- Reading proficiency
- 17% ▼ -3.00%
- Median HH income
- $33,888
- Composite
- 10.12/100
- National rank
- #9802
- State rank
- #514 of 540 in MI
Livability — Pontiac
- Score
- 64/100
- State rank
- #499
- US rank
- #14703
Category grades
Schools grade is shown separately in the Schools card above.
Census & demographics
- Census place
- Pontiac, MI
- County
- Oakland County · 1,009,092 people
- City population
- 44,593
- Metro
- Detroit-Warren-Dearborn, MI
- Population (ZIP)
- 18,924
- Household income
- $51,390
- Rent vs Own
- Severe rent burden
- 833.0
Population outlook (Oakland County) Hauer SSP2
- Today (2025)
- 1,335,747 people
- By 2030
- 1,375,100 · +2.9%
- By 2040
- 1,435,385 · +7.5%
- By 2050
- 1,469,250 · +10.0%
- By 2075
- 1,531,946 · +14.7%
- By 2100
- 1,450,485 · +8.6%
Race, ethnicity, and origin ACS 2023
- Neighborhood character
- Diverse neighborhood (Simpson 0.61)
- Race & ethnicity
- Black 57% White 22% Hispanic / Latino 12% Two or more races 11% Asian 3%
- Hispanic origin (detail)
- Mexican 4% Puerto Rican 2%
- Common ancestry
- Slovak 2% Romanian 1% Swiss 1%
- Foreign-born
- 10% · Canada
- Languages at home
- 86% English-only · Spanish 9% Other Indo-European 1% Other Asian/Pacific 1%
Political lean MEDSL · Oakland
- 2024 margin
- D (+10.6) · D 54.4% · R 43.8% · Other 1.9%
- 2008→2024 swing
- -3.9pp toward R · 2008: 14.5pp · 2024: 10.6pp
- All cycles
- 2024: D+10.6 2020: D+14.1 2016: D+8.1 2012: D+8.1 2008: D+14.5
Not yet ingested
- Civics
- —
Market trends
- HPI YoY
- ▼ -204.11%
- Current HPI
- 257.8941
- Rent YoY
- —
- Metro
- Detroit-Warren-Dearborn, MI
- State GDP YoY
- ▲ 1.37%
- F500 in state
- 28
Industry mix (Fortune 500 HQ in MI)
| Industry | F500 HQs | Revenue |
|---|---|---|
| Automotive Parts | 3 | $48B |
|
||
| Automotive | 2 | $372B |
|
||
| Chemicals | 1 | $45B |
|
||
| Automotive Retail | 1 | $29B |
|
||
| Healthcare / Medical Devices | 1 | $23B |
|
||
| Automotive Technology | 1 | $20B |
|
||
Price history
+81.1% since first listed12 events — show timeline
- 2026-06-15 Listed $199,000 REALCOMP
- 2026-06-15 Listed $199,000 MiRealSource-MiMLS
- 2008-12-01 Listing Removed — MiRealSource-MiMLS
- 2008-11-24 Listing Removed — REALCOMP
- 2008-04-09 Listed $24,900 REALCOMP
- 2008-04-09 Listed $59,900 MiRealSource-MiMLS
- 2006-07-21 Listing Removed — REALCOMP
- 2006-04-25 Listed $149,900 REALCOMP
- 2004-01-12 Sold (Public Records) $157,895 Public Records
- 2003-11-26 Sold (MLS) $157,895 REALCOMP
- 2003-08-25 Listed $164,999 REALCOMP
- 1997-10-22 Sold (Public Records) $109,900 Public Records
Property tax history
+3.4%/yrLatest (2025): $1,460 · -37.9% YoY. Source: county tax records.
Cash-flow waterfall
monthlySold comps — $/sqft
last 12 mo · ≤1 miLoading sold comps…