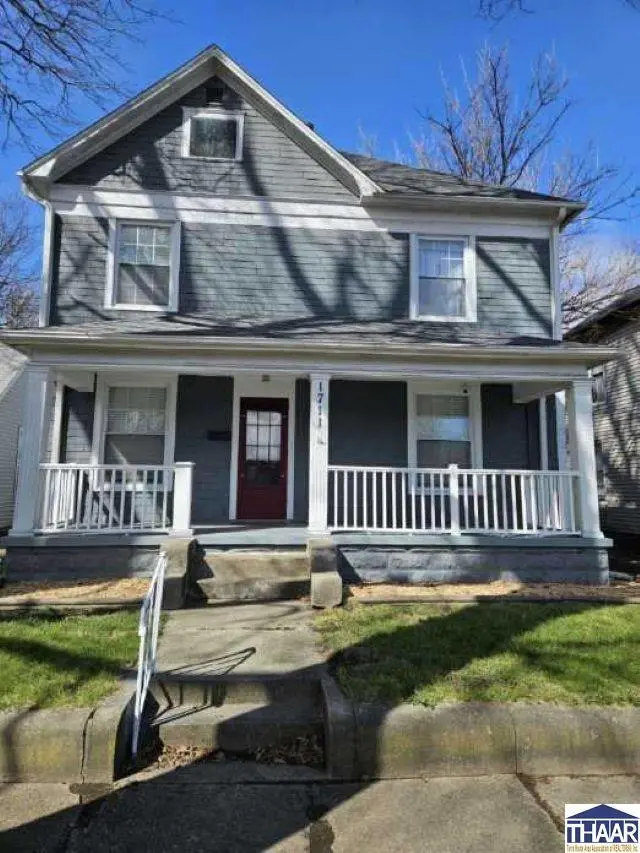
1711 S 9th St · Terre Haute, IN
Flood risk 3/10 · Minor
- FEMA flood zone
- X (unshaded)
- Chance of flooding over 30 yrs
- 0.1%
- Est. flood insurance / yr
- $473 – $860
Fire risk 1/10 · Minimal
- Est. fire insurance / yr
- $717 – $1,331
Heat risk 4/10 · Minor
- Hot days now (above 105°F)
- 7 days/yr
- Hot days in 30 yrs
- 19 days/yr
Wind risk 2/10 · Minimal
- Chance of severe wind over 30 yrs
- 1.0%
Air-quality risk 3/10 · Minor
- Unhealthy air days now
- 2 days/yr
- Unhealthy air days in 30 yrs
- 4 days/yr
Risk factors via First Street. Map © Google.
Why this score? — see what drove the C+ grade
The composite is a weighted blend of 9 inputs, each scored 0–100. Each bar is that input's sub-score; the figure is the points it added to the 100-point composite (weight × sub-score).
- Cash flow +29.2/30.0
- DSCR +10.0/10.0
- 1% rule +7.3/10.0
- ARV discount +5.9/15.0
- Livability +3.8/5.0
- Schools +2.9/10.0
- Rent growth +2.8/5.0
- Condition / age +2.5/5.0
- Appreciation +0.0/10.0
$149,900
🖨 Deal sheet 📄 Offer letter ✓ Due diligence
Listing remarks
Charming, Updated Home Filled With Character & Modern Style Step into a large, welcoming foyer featuring new LVP flooring, fresh paint, and beautiful shiplap walls that immediately set the tone for the home’s blend of charm and contemporary updates. The foyer opens seamlessly into a cozy living room where the original baseboards and trim add timeless character. Continue into the spacious dining room, complete with original hardwood trim and built-ins that offer both style and functionality. The fully updated kitchen is a standout, featuring: New cabinets Solid-surface countertops. Stylish tile backsplash New flooring A convenient center island perfect for prep work or casual mea
Key facts
- Original baseboards
- Cozy living room
- Spacious dining room
Tags
Neighborhood map
What this means for you Summary
Snapshot
- This is a 4-bed/1.0-bath single-family listed at $150k.
Deal economics
- At list price, monthly cash flow is $523 ($6k/yr) — positive.
- The deal already cash-flows at list — no discount required.
- Meets the 1% rule at list price ($2k rent vs $150k).
- Cap rate 10.5% vs local median 4.7% in Terre Haute — top-decile yield for the area; either an underpriced asset or a hidden risk that comps aren't pricing in. Stress-test before assuming the spread holds.
Location & tenants
- Location reads 75/100 on livability (#63 in IN, #4,186 nationally) — a middle-class / working-renter tenant base. Strengths: cost of living A+, housing A+, health & safety A+; Watch: crime F, employment F.
- Vigo County School Corporation (urban): math 32% / reading 37% proficiency, ranked #202 of 301 in IN (top 67%) — families likely to look elsewhere, expect single-tenant / working-renter base with shorter leases.
- Zoned schools: Farrington Grove Elementary School (math 27% / reading 22%, grade F, #762 of 994 statewide, top 78%, 428 students, 92% FRL); Sarah Scott Middle School (math 8% / reading 18%, grade F, #304 of 330 statewide, top 94%, 397 students, 86% FRL); Terre Haute South Vigo High School (math 37% / reading 72%, grade C-, #79 of 369 statewide, top 26%, 1,610 students, 51% FRL) — zoned schools average 76% FRL vs 47% district-wide (29 pts higher); higher-poverty schools than district average — tighter screening recommended.
- Market conditions: Rents rising (+1.2%/yr); 187 active listings in the ZIP; 3 comparable units currently listed for rent nearby; rentals lingering (median 44d on market — plan ~5-8 weeks vacancy on turnover, expect pricing pressure); 100% of comp listings sitting > 30 days — soft ceiling on asking rent; 60 units permitted in Vigo County in 2024 (0 in 5+ unit buildings).
- This rent runs 39% of the median local income ($57k/yr) — at the standard rent-burdened threshold; future hikes will face affordability resistance.
Forward outlook
- Local home prices are declining (-3.0%/yr); year-one equity from $1k of loan paydown is wiped out by about $4k of value loss. Plan a longer hold.
- Vigo County population projected to shrink 5% by 2050 — rents likely to lag national; underwrite the cash flow, not the appreciation.
- At projected returns (-3.0% appreciation + 1.2% rent growth), your $42k cash investment doubles in ~10 years — after that, you're playing with house money.
Negotiation context
- Only 9 days on market — expect competitive offers; lowballing is unlikely to land.
Risks & watch-outs
- Watch-outs: built in 1912 — expect roof / HVAC / electrical / plumbing capex.
Questions for the listing agent
- Built in 1912 — when were the roof, HVAC, electrical panel, plumbing, and water heater last replaced?
- Is there a deadline driving the sale (1031 exchange, divorce, estate, relocation)? That informs how much negotiation room exists.
- Schools are D-rated, which usually means shorter tenancies and higher turnover. Who's the typical renter profile here, and what's been the actual vacancy rate?
- Crime grade is F in this area — have there been break-ins, vandalism, or insurance claims at this property in the last 3 years? What carrier currently insures it and at what premium?
- What's the average days-on-market for RENTAL listings here right now (not sales)? A rising rental-DOM trend means longer vacancies and softer asking-rent achievability than the comps imply.
- What's the recent tenant-quality profile in this submarket — average credit score on applications, eviction rate, late-payment / NSF rate, and stable-employment percentage? A property-management company in the area should have these aggregated.
- How much new for-sale + rental construction is in the pipeline within 1–3 miles? Heavy new supply typically softens prices + rents 12–24 months out; constrained supply supports both.
Investment metrics
- 1% rule
- 1.23% ✓
- Cap rate
- 10.48%
- Cash-on-cash
- 14.96%
- DSCR
- 1.67
- GRM
- 6.8
CMA / ARV
- ARV (on-the-fly)
- $144,840
- Comps found
- 10
Show comp detail 10 sales within ~0.75 mi
| Address | Dist | Beds/Ba | Sqft | Sold | Price | $/sf | Match |
|---|---|---|---|---|---|---|---|
| 1726 S 11th St | 0.17mi | 4/1.5 | 2,092 (+2%) | 5mo | $164,000 | $78 | 81 |
| 2031 S 8th St | 0.27mi | 3/1.5 (-1) | 2,016 (-1%) | 1mo | $71,526 | $35 | 77 |
| 1414 S 11th St | 0.33mi | 4/1.0 | 1,850 (-9%) | 2mo | $59,900 | $32 | 68 |
| 1200 S Center St | 0.48mi | 4/2.0 | 2,119 (+4%) | 1mo | $209,900 | $99 | 67 |
| 1604 S 5th St St | 0.36mi | 4/1.5 | 2,224 (+9%) | 7mo | $183,000 | $82 | 60 |
| 1444 S 6th St | 0.35mi | 3/2.5 (-1) | 2,301 (+13%) | 3mo | $174,500 | $76 | 49 |
| 834 S 9th St | 0.67mi | 3/2.0 (-1) | 1,915 (-6%) | 1mo | $134,990 | $70 | 48 |
| 1132 S 7th ST St | 0.48mi | 3/2.0 (-1) | 2,238 (+10%) | 5mo | $159,900 | $71 | 48 |
| 717 S 9th St | 0.75mi | 5/2.0 (+1) | 1,856 (-9%) | 6mo | $42,000 | $23 | 36 |
| 1701 S 5th St | 0.37mi | 3/2.0 (-1) | 2,322 (+14%) | 18mo | $80,000 | $34 | 36 |
Match score weights: distance 35% · size 25% · config 20% · recency 20%. Top-matched comps best support the ARV.
Projected returns pro-forma
-3.0% appreciation · 1.23% rent growth · sell at horizon
- IRR
- 3.6%
- Equity multiple
- 1.14×
- Total profit
- $5,767
- Equity at exit
- $22,351
- IRR
- 11.5%
- Equity multiple
- 1.83×
- Total profit
- $34,991
- Equity at exit
- $12,961
Cash invested: $41,972 (down + closing). Projections, not guarantees.
Landlord ↔ Tenant lean methodology
- Overall (STATE)
- 90 Strongly Landlord-Friendly
- State Indiana
- 90 Strongly Landlord-Friendly · R+11
- County
- — inherits STATE
- City
- — inherits STATE
ZIP-level market 47802
- Home prices YoY
- -26.8%
- Rents YoY
- 1.2%
- Active inventory
- 187
- Price-to-rent
- 6.8×
Monthly cashflow live
- Estimated rent
- $1,847 medium interval (Pro) →
- Mortgage (P&I)
- −$786
- Tax from tax record
- −$88 /mo · $1,053/yr
- Insurance
- −$62
- HOA
- −$0
- Vacancy / Maint / Mgmt
- −$388
- Net cashflow
- $523
Break-even live
UW: 25.0% down · 7.5% · 30yr · 1.5% tax · 5.0% vac · 8.0% maint · 8.0% mgmt
Financing live
Cash to close
- Down payment
- $37,475
- Closing costs
- $4,497
- Reserves months
- —
- Total cash needed
- —
Loan-product check · same deal, 3 products live
Conventional
25% down · 7.5% · 30yr
- Down + closing
- —
- Monthly P&I
- —
- Monthly cashflow
- —
- DSCR
- —
- Eligible?
- —
Personal DTI + credit; lowest rate.
DSCR
20% down · 8.5% · 30yr
- Down + closing
- —
- Monthly P&I
- —
- Monthly cashflow
- —
- DSCR
- —
- Eligible?
- —
No personal income docs; deal must DSCR.
Hard money
10% down · 12.0% · 12mo
- Down + closing
- —
- Monthly P&I
- —
- Monthly cashflow
- —
- DSCR
- —
- Eligible?
- —
Short-term bridge; refi at stabilization.
Rent comps 3 comps
| Address | Beds | Baths | Sqft | Rent | $/sqft | DOM | Units | Dist |
|---|---|---|---|---|---|---|---|---|
| 600 S Center St Unit 602 Terre Haute, IN | 3.0 | 1.5 | 1500 | $2,500 | $1.67 | 44d | 1 | 0.88mi |
| 1915 Poplar St Unit A Terre Haute, IN | 3.0 | 1.0 | 1412 | $1,200 | $0.85 | 44d | 1 | 1.37mi |
| 2116 Poplar St Terre Haute, IN | 4.0 | 1.5 | 1872 | $1,900 | $1.01 | 44d | 1 | 1.49mi |
Listing history 2 events
-
2026-04-02status Pending
-
2026-03-24$149,900 Active
ⓘ Source: listings_history table (triggers on properties + properties_extension) + one-shot
backfill from property_details.listing_events for pre-trigger history.
Tax reassessment forecast IN · Partial reset (capped growth)
- Current annual tax
- $1,053 · $88/mo
- Projected year-2 tax
- $1,163 · $97/mo
- Expected delta
- +$111/yr (+$9/mo · 10.5%)
ⓘ Screening estimate from a state-policy table — verify with the county assessor before closing.
Climate risk First Street
- Flood 3/10 Moderate FEMA zone X (unshaded) · 10% chance over 30 yrs
- Wildfire 1/10 Low
- Heat 4/10 Moderate 7 d/yr ≥105°F today · 19 d/yr by 30 yrs out
- Wind 2/10 Low 100% chance of damaging wind over 30 yrs
- Air quality 3/10 Moderate 2 unhealthy d/yr today · 4 by 30 yrs out
Nearby sold comps map
Loading sold comps map…
Walkable amenities ~0.75 mi
Loading nearby amenities…
Taxation est. · year 1
- Rental income
- $22,169
- − Mortgage interest
- −$8,397
- − Property taxes
- −$1,053
- − Insurance
- −$750
- − Repairs & maintenance
- −$1,774
- − Management
- −$1,774
- − Depreciation
- −$4,361
- Taxable income
- $4,063
- Est. tax owed @ 24.0%
- −$975
- After-tax cash flow
- $5,303/yr
For passive investors: Depreciation is non-cash, so a rental often shows a tax loss while cash-flowing — sheltering income. Rental losses are passive: they offset passive income freely, and up to $25,000/yr can offset ordinary (W-2) income if you actively participate and your MAGI is under $100k (phasing out to $0 by $150k); unused losses carry forward. On sale, claimed depreciation is recaptured at up to 25%, and gains may owe capital-gains tax (a 1031 exchange can defer both). Figures are a year-1 estimate at your 24.0% rate — not tax advice; consult a CPA.
Schools (NCES district)
- District
- Vigo County School Corporation
- NCES district ID
- 1812090
- Math proficiency
- 32% ▼ -10.00%
- Reading proficiency
- 37% ▼ -8.00%
- Median HH income
- $40,100
- Composite
- 28.97/100
- National rank
- #6625
- State rank
- #202 of 301 in IN
Livability — Terre Haute
- Score
- 75/100
- State rank
- #63
- US rank
- #4186
Category grades
Schools grade is shown separately in the Schools card above.
Census & demographics
- Census place
- Terre Haute, IN
- County
- Vigo County · 91,193 people
- City population
- 91,193
- Metro
- Terre Haute, IN
- Population (ZIP)
- 33,135
- Household income
- $57,395
- Rent vs Own
- Severe rent burden
- 1102.0
Population outlook (Vigo County) Hauer SSP2
- Today (2025)
- 106,366 people
- By 2030
- 105,674 · -0.7%
- By 2040
- 103,731 · -2.5%
- By 2050
- 101,200 · -4.9%
- By 2075
- 95,674 · -10.1%
- By 2100
- 85,910 · -19.2%
Race, ethnicity, and origin ACS 2023
- Neighborhood character
- Predominantly White (82%)
- Race & ethnicity
- White 82% Black 8% Two or more races 5% Hispanic / Latino 3% Asian 3%
- Common ancestry
- Lithuanian 3% Slovak 2% Serbian 2%
- Foreign-born
- 3% · China, Canada
- Languages at home
- 96% English-only · Spanish 1% Other Indo-European 1% Chinese 1%
Political lean MEDSL · Vigo
- 2024 margin
- R (+18.1) · D 40.0% · R 58.1% · Other 2.0%
- 2008→2024 swing
- -33.9pp toward R · 2008: 15.8pp · 2024: -18.1pp
- All cycles
- 2024: R+18.1 2020: R+14.7 2016: R+15.2 2012: D+0.8 2008: D+15.8
Not yet ingested
- Civics
- —
Market trends
- HPI YoY
- ▼ -67.05%
- Current HPI
- 183.0194
- Rent YoY
- ▲ 1.23%
- Metro
- Terre Haute, IN
- State GDP YoY
- ▲ 2.90%
- F500 in state
- 18
Industry mix (Fortune 500 HQ in IN)
| Industry | F500 HQs | Revenue |
|---|---|---|
| Industrial Machinery | 2 | $37B |
|
||
| Healthcare | 1 | $177B |
|
||
| Pharmaceuticals | 1 | $45B |
|
||
| Metals / Steel | 1 | $18B |
|
||
| Agriculture | 1 | $17B |
|
||
| Packaging | 1 | $12B |
|
||
Price history
2 events — show timeline
- 2026-04-02 Pending — THAAR
- 2026-03-24 Listed $149,900 THAAR
Property tax history
+6.1%/yrLatest (2024): $1,053 · +5.2% YoY. Source: county tax records.
Cash-flow waterfall
monthlySold comps — $/sqft
last 12 mo · ≤1 miLoading sold comps…