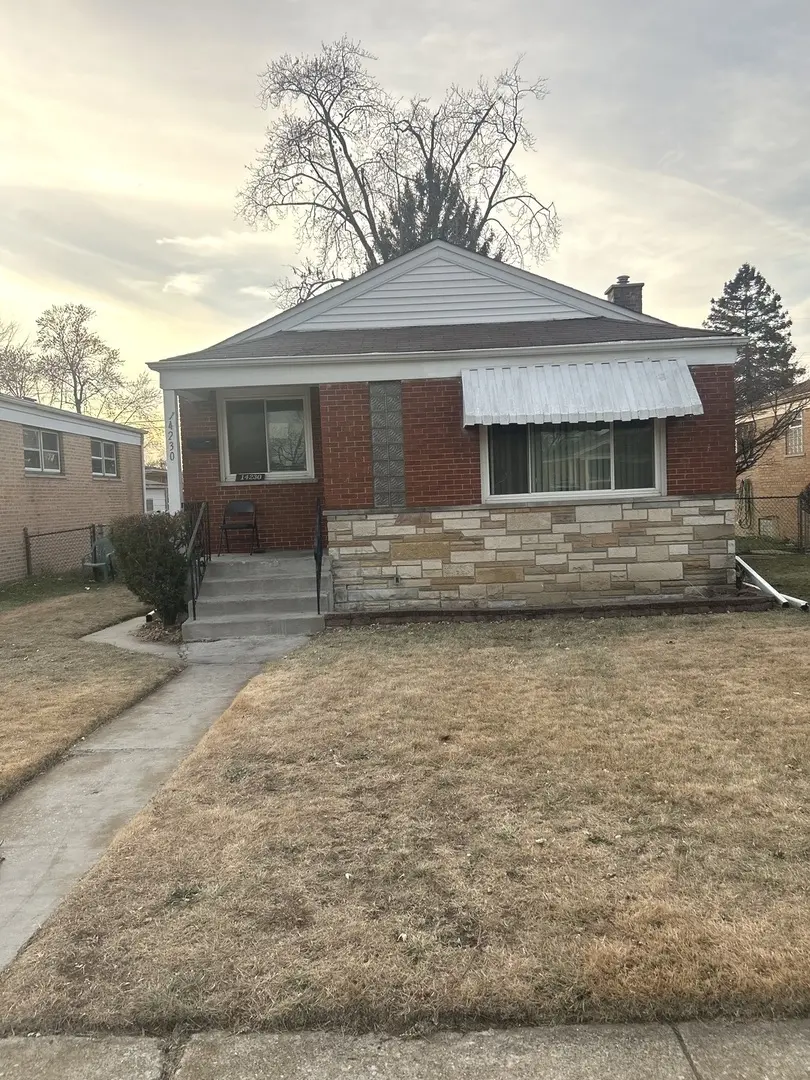
14230 University Ave · Dolton, IL
Flood risk 3/10 · Minor
- FEMA flood zone
- X (unshaded)
- Chance of flooding over 30 yrs
- 0.2%
- Est. flood insurance / yr
- $473 – $860
Fire risk 1/10 · Minimal
- Est. fire insurance / yr
- $804 – $1,492
Heat risk 3/10 · Minor
- Hot days now (above 101°F)
- 7 days/yr
- Hot days in 30 yrs
- 15 days/yr
Wind risk 2/10 · Minimal
- Chance of severe wind over 30 yrs
- —
Air-quality risk 4/10 · Minor
- Unhealthy air days now
- 4 days/yr
- Unhealthy air days in 30 yrs
- 5 days/yr
Risk factors via First Street. Map © Google.
Why this score? — see what drove the C grade
The composite is a weighted blend of 9 inputs, each scored 0–100. Each bar is that input's sub-score; the figure is the points it added to the 100-point composite (weight × sub-score).
- Cash flow +27.2/30.0
- DSCR +9.5/10.0
- 1% rule +8.9/10.0
- Rent growth +4.9/5.0
- Livability +3.7/5.0
- Condition / age +2.5/5.0
- Schools +0.7/10.0
- ARV discount +0.0/15.0
- Appreciation +0.0/10.0
$160,000
🖨 Deal sheet (PDF) 📄 Offer letter ✓ Due diligence
Listing remarks
Investor special with strong upside potential! This spacious property is ready for your vision and rehab expertise. Features include a generous floor plan, large lot, and solid investment opportunity for fix-and-flip, rental, or long-term hold. Property is being sold AS-IS. Cash or renovation financing preferred. Room sizes estimated. Great opportunity to add value in a convenient location near schools, parks, shopping, and major expressways. Bring your contractors and ideas-tons of potential here!
Key facts
- Large lot
- Convenient location
- 2 garage spots
Tags
Property features AI
Finance
- HOA & community: No master association fee required
Exterior
- Parking: Detached garage (2 garage spaces, 2 total parking spaces)
- Utilities: Water from Lake Michigan; Shared septic sewer
- Home design: Detached single-family home; Single-story; Fee simple ownership; Rehab completed in 1999
- Construction: Brick construction; Built before 1978 (71–80 years old)
- Exterior features: Flood zone (partial)
Interior
- Kitchen: Kitchen on main level (8 x 11)
- Bedrooms: 2 bedrooms (main level); 1 additional bedroom in the basement; Potential for a 3rd bedroom
- Bathrooms: 2 full bathrooms; Basement bathroom present
- Heating & cooling: Electric heating; Central air conditioning (electric)
- Interior features: Finished full basement; 7 total rooms
- Laundry & utility: Basement laundry (8 x 12)
Neighborhood map
What this means for you Summary
Snapshot
- This is a 3-bed/1.0-bath single-family listed at $160k.
Deal economics
- At list price, monthly cash flow is $460 ($6k/yr) — positive.
- The deal already cash-flows at list — no discount required.
- Meets the 1% rule at list price ($2k rent vs $160k).
- Recommended offer: $158k (1.5% below list) — sets the bar for market timing.
Location & tenants
- Location reads 74/100 on livability (#263 in IL, #4,883 nationally) — a middle-class / working-renter tenant base. Strengths: commute A+, cost of living A+, housing A+; Watch: employment C-, health & safety C-, schools F.
- Thornton Twp Hsd 205 (suburban): math 7% / reading 8% proficiency, ranked #594 of 620 in IL (top 96%) — low school quality limits family demand, transient renter base, plan for 1-2y turnover.
- Market conditions: Rents rising fast (+9.7%/yr); 130 active listings in the ZIP; 21 comparable units currently listed for rent nearby; rentals at typical pace (median 21d on market — plan ~3-4 weeks tenant-placement turnaround); 6,272 units permitted in Cook County in 2024 (4,658 in 5+ unit buildings).
- At $2,217/mo this rent would consume 46% of the median local household income ($58k/yr) (locally 919% of renters already pay >50% of income on rent) — very limited rent-growth headroom before tenants either downsize or default.
Forward outlook
- Local home prices are declining (-3.0%/yr); year-one equity from $1k of loan paydown is wiped out by about $5k of value loss. Plan a longer hold.
- At projected returns (-3.0% appreciation + 8.0% rent growth), your $45k cash investment doubles in ~7 years — after that, you're playing with house money.
Negotiation context
- It's been on market 21 days — a 2% lower offer ($158k) is reasonable based on typical stale-listing flexibility.
- Current owner paid $54k; list at $160k implies a 194% gain — meaningful room to come down on a strong offer.
Risks & watch-outs
- Watch-outs: property tax is 2.9% of price; built in 1954 — expect roof / HVAC / electrical / plumbing capex.
Questions for the listing agent
- Built in 1954 — when were the roof, HVAC, electrical panel, plumbing, and water heater last replaced?
- Property tax is high relative to price — has the assessment been appealed recently, and will the sale trigger a re-assessment?
- Is there a deadline driving the sale (1031 exchange, divorce, estate, relocation)? That informs how much negotiation room exists.
- Schools are F-rated, which usually means shorter tenancies and higher turnover. Who's the typical renter profile here, and what's been the actual vacancy rate?
- Crime grade is D in this area — have there been break-ins, vandalism, or insurance claims at this property in the last 3 years? What carrier currently insures it and at what premium?
- What's the average days-on-market for RENTAL listings here right now (not sales)? A rising rental-DOM trend means longer vacancies and softer asking-rent achievability than the comps imply.
- What's the recent tenant-quality profile in this submarket — average credit score on applications, eviction rate, late-payment / NSF rate, and stable-employment percentage? A property-management company in the area should have these aggregated.
- How much new for-sale + rental construction is in the pipeline within 1–3 miles? Heavy new supply typically softens prices + rents 12–24 months out; constrained supply supports both.
Investment metrics
- 1% rule
- 1.39% ✓
- Cap rate
- 9.74%
- Cash-on-cash
- 12.33%
- DSCR
- 1.55
- GRM
- 6.0
CMA / ARV
- ARV (on-the-fly)
- $116,955
- Comps found
- 12
Show comp detail 12 sales within ~0.75 mi
| Address | Dist | Beds/Ba | Sqft | Sold | Price | $/sf | Match |
|---|---|---|---|---|---|---|---|
| 14341 University Ave | 0.15mi | 3/1.0 | 1,035 (0%) | 1mo | $100,000 | $97 | 92 |
| 14222 S Woodlawn Ave | 0.07mi | 3/1.0 | 1,089 (+5%) | 2mo | $90,000 | $83 | 86 |
| 14248 Avalon Ave | 0.13mi | 3/2.0 | 1,037 (+0%) | 6mo | $216,000 | $208 | 84 |
| 14622 Kenwood Ave | 0.54mi | 3/1.0 | 1,017 (-2%) | 5mo | $110,000 | $108 | 68 |
| 14610 Blackstone Ave | 0.63mi | 3/1.0 | 1,017 (-2%) | 1mo | $150,000 | $147 | 67 |
| 14642 Dorchester Ave | 0.61mi | 3/1.0 | 1,013 (-2%) | 1mo | $170,000 | $168 | 67 |
| 14731 Kimbark Ave | 0.66mi | 3/1.0 | 1,017 (-2%) | 2mo | $115,000 | $113 | 64 |
| 14728 Kenwood Ave | 0.67mi | 3/1.0 | 1,017 (-2%) | 5mo | $156,000 | $153 | 61 |
| 14534 Woodlawn Ave | 0.39mi | 4/1.0 (+1) | 963 (-7%) | 5mo | $170,000 | $177 | 61 |
| 1429 Kasten Dr | 0.56mi | 3/1.0 | 1,123 (+8%) | 4mo | $119,000 | $106 | 56 |
| 14700 Avalon Ave | 0.57mi | 3/1.5 | 1,128 (+9%) | 4mo | $125,000 | $111 | 53 |
| 14613 Dante Ave | 0.61mi | 3/1.5 | 1,112 (+7%) | 5mo | $95,000 | $85 | 53 |
Match score weights: distance 35% · size 25% · config 20% · recency 20%. Top-matched comps best support the ARV.
Projected returns pro-forma
-3.0% appreciation · 8.0% rent growth · sell at horizon
- IRR
- 8.2%
- Equity multiple
- 1.34×
- Total profit
- $15,248
- Equity at exit
- $23,857
- IRR
- 21.7%
- Equity multiple
- 3.34×
- Total profit
- $104,945
- Equity at exit
- $13,834
Cash invested: $44,800 (down + closing). Projections, not guarantees.
Landlord ↔ Tenant lean methodology
- Overall (STATE)
- 43 Moderately Tenant-Leaning
- State Illinois
- 43 Moderately Tenant-Leaning · D+7
- County
- — inherits STATE
- City
- — inherits STATE
ZIP-level market 60419
- Home prices YoY
- -25.7%
- Rents YoY
- 9.7%
- Active inventory
- 130
- Price-to-rent
- 6.0×
Monthly cashflow live
- Estimated rent
- $2,217 high interval (Pro) →
- Mortgage (P&I)
- −$839
- Tax from tax record
- −$385 /mo · $4,626/yr
- Insurance
- −$67
- HOA
- −$0
- Vacancy / Maint / Mgmt
- −$466
- Net cashflow
- $460
Break-even live
Sensitivity live
| Price | -10% $551 | -5% $506 | +0% $460 | +5% $415 | +10% $370 |
|---|---|---|---|---|---|
| Rent | -10% $285 | -5% $373 | +0% $460 | +5% $548 | +10% $635 |
| Rate | -1.0pp $541 | -0.5pp $501 | base $460 | +0.5pp $419 | +1.0pp $377 |
UW: 25.0% down · 7.5% · 30yr · 1.5% tax · 5.0% vac · 8.0% maint · 8.0% mgmt
Financing live
Cash to close
- Down payment
- $40,000
- Closing costs
- $4,800
- Reserves months
- —
- Total cash needed
- —
Loan-product check · same deal, 3 products live
Conventional
25% down · 7.5% · 30yr
- Down + closing
- —
- Monthly P&I
- —
- Monthly cashflow
- —
- DSCR
- —
- Eligible?
- —
Personal DTI + credit; lowest rate.
DSCR
20% down · 8.5% · 30yr
- Down + closing
- —
- Monthly P&I
- —
- Monthly cashflow
- —
- DSCR
- —
- Eligible?
- —
No personal income docs; deal must DSCR.
Hard money
10% down · 12.0% · 12mo
- Down + closing
- —
- Monthly P&I
- —
- Monthly cashflow
- —
- DSCR
- —
- Eligible?
- —
Short-term bridge; refi at stabilization.
Rent comps 21 comps
| Address | Beds | Baths | Sqft | Rent | $/sqft | DOM | Units | Dist |
|---|---|---|---|---|---|---|---|---|
| 14433 Woodlawn Ave Dolton, IL | 4.0 | 2.0 | 1300 | $2,000 | $1.54 | 19d | 1 | 0.28mi |
| 14500 Cottage Grove Ave Unit 3 Dolton, IL | 2.0 | 1.0 | 1000 | $1,475 | $1.48 | 25d | 1 | 0.50mi |
| 14610 Blackstone Ave Dolton, IL | 3.0 | 1.0 | 1017 | $2,400 | $2.36 | 7d | 1 | 0.64mi |
| 14305 Irving Ave Unit 2 Dolton, IL | 3.0 | 1.0 | 1100 | $2,200 | $2.00 | 25d | 1 | 0.65mi |
| 14716 Dorchester Ave Dolton, IL | 3.0 | 2.0 | 1250 | $2,800 | $2.24 | 20d | 1 | 0.68mi |
| 14738 Blackstone Ave Dolton, IL | 3.0 | 1.0 | 1017 | $2,400 | $2.36 | 10d | 1 | 0.79mi |
| 14817 Champlain Ave Dolton, IL | 2.0 | 1.0 | 980 | $2,430 | $2.48 | 22d | 1 | 0.93mi |
| 14916 Langley Ave Dolton, IL | 3.0 | 1.5 | 1418 | $2,500 | $1.76 | 25d | 1 | 1.01mi |
| 1860 State St Calumet City, IL | 3.0 | 1.0 | 1100 | $1,800 | $1.64 | 18d | 1 | 1.08mi |
| 409 Madison Ave Unit 2 Calumet City, IL | 3.0 | 1.5 | 1200 | $1,795 | $1.50 | 4d | 1 | 1.11mi |
| 13841 Forest Ave Dolton, IL | 3.0 | 1.0 | 930 | $1,895 | $2.04 | 25d | 1 | 1.19mi |
| 405 Clyde Ave Calumet City, IL | 3.0 | 1.0 | 973 | $2,300 | $2.36 | 2d | 1 | 1.24mi |
| 15231 Hastings Dr Dolton, IL | 4.0 | 1.5 | 1487 | $2,146 | $1.44 | 8d | 1 | 1.28mi |
| 14124 Manor Ave Dolton, IL | 3.0 | 2.0 | 1440 | $2,390 | $1.66 | 25d | 1 | 1.29mi |
| 101 Oglesby Ave Calumet City, IL | 2.0 | 1.0 | 1000 | $1,800 | $1.80 | 22d | 1 | 1.33mi |
| 101 Oglesby Ave Calumet City, IL | 2.0 | 1.0 | 1000 | $1,800 | $1.80 | 20d | 1 | 1.33mi |
| 101 Oglesby Ave Calumet City, IL | 2.0 | 1.0 | 1100 | $1,800 | $1.64 | 12d | 1 | 1.33mi |
| 1601 Downs Dr Unit 3S Calumet City, IL | 2.0 | 1.0 | 750 | $1,400 | $1.87 | 25d | 1 | 1.37mi |
| 250 Yates Ave Unit 1616 Dolton 1E Calumet City, IL | 2.0 | 1.0 | 875 | $1,465 | $1.67 | 8d | 1 | 1.39mi |
| 1130 E 132nd St Chicago, IL | 3.0 | 1.0 | 900 | $2,745 | $3.05 | 25d | 1 | 1.42mi |
| 1132 E 132nd St Chicago, IL | 3.0 | 1.0 | 900 | $2,745 | $3.05 | 25d | 1 | 1.42mi |
Listing history 18 events
-
2026-06-18days on market $160,000 Active 21 DOM
-
2026-06-17days on market $160,000 Active 20 DOM
-
2026-06-16days on market $160,000 Active 19 DOM
-
2026-06-15days on market $160,000 Active 18 DOM
-
2026-06-13days on market $160,000 Active 16 DOM
-
2026-06-13days on market $160,000 Active 15 DOM
-
2026-06-09days on market $160,000 Active 12 DOM
-
2026-06-08days on market $160,000 Active 11 DOM
-
2026-06-07days on market $160,000 Active 10 DOM
-
2026-06-04days on market $160,000 Active 7 DOM
-
2026-06-03days on market $160,000 Active 6 DOM
-
2026-06-02days on market $160,000 Active 5 DOM
-
2026-06-01days on market $160,000 Active 4 DOM
-
2026-05-31days on market $160,000 Active 3 DOM
-
2026-05-28$160,000 Active
-
1996-08-15soldstatus $54,500
-
1988-07-19soldstatus $56,000
-
1983-12-06soldstatus $50,000
ⓘ Source: listings_history table (triggers on properties + properties_extension) + one-shot
backfill from property_details.listing_events for pre-trigger history.
Tax reassessment forecast IL · Partial reset (capped growth)
- Current annual tax
- $4,626 · $385/mo
- Projected year-2 tax
- $4,626 · $385/mo
- Expected delta
- $0/yr ($0/mo · 0.0%)
ⓘ Screening estimate from a state-policy table — verify with the county assessor before closing.
Climate risk First Street
- Flood 3/10 Moderate FEMA zone X (unshaded) · 20% chance over 30 yrs
- Wildfire 1/10 Low
- Heat 3/10 Moderate 7 d/yr ≥101°F today · 15 d/yr by 30 yrs out
- Wind 2/10 Low
- Air quality 4/10 Moderate 4 unhealthy d/yr today · 5 by 30 yrs out
Nearby sold comps map
Loading sold comps map…
Walkable amenities ~0.75 mi
Loading nearby amenities…
Taxation est. · year 1
- Rental income
- $26,604
- − Mortgage interest
- −$8,962
- − Property taxes
- −$4,626
- − Insurance
- −$800
- − Repairs & maintenance
- −$2,128
- − Management
- −$2,128
- − Depreciation
- −$4,655
- Taxable income
- $3,304
- Est. tax owed @ 24.0%
- −$793
- After-tax cash flow
- $4,730/yr
For passive investors: Depreciation is non-cash, so a rental often shows a tax loss while cash-flowing — sheltering income. Rental losses are passive: they offset passive income freely, and up to $25,000/yr can offset ordinary (W-2) income if you actively participate and your MAGI is under $100k (phasing out to $0 by $150k); unused losses carry forward. On sale, claimed depreciation is recaptured at up to 25%, and gains may owe capital-gains tax (a 1031 exchange can defer both). Figures are a year-1 estimate at your 24.0% rate — not tax advice; consult a CPA.
Schools (NCES district)
- District
- Thornton Twp Hsd 205
- NCES district ID
- 1738970
- Math proficiency
- 7% ▬ 0.00%
- Reading proficiency
- 8% ▼ -2.00%
- Median HH income
- $43,392
- Composite
- 6.92/100
- National rank
- #9976
- State rank
- #594 of 620 in IL
Livability — Dolton
- Score
- 74/100
- State rank
- #263
- US rank
- #4883
Category grades
Schools grade is shown separately in the Schools card above.
Census & demographics
- Census place
- Dolton, IL
- County
- Cook County · 4,486,803 people
- City population
- 20,825
- Metro
- Chicago-Naperville-Elgin, IL-IN-WI
- Population (ZIP)
- 20,825
- Household income
- $57,887
- Rent vs Own
- Severe rent burden
- 919.0
Population outlook (Cook County) Hauer SSP2
- Today (2025)
- 5,347,519 people
- By 2030
- 5,357,703 · +0.2%
- By 2040
- 5,324,924 · -0.4%
- By 2050
- 5,230,762 · -2.2%
- By 2075
- 4,785,735 · -10.5%
- By 2100
- 4,188,836 · -21.7%
Race, ethnicity, and origin ACS 2023
- Neighborhood character
- Predominantly Black (91%)
- Race & ethnicity
- Black 91% White 4% Two or more races 3% Hispanic / Latino 1%
- Common ancestry
- Romanian 1% Hispanic 1%
- Foreign-born
- 3% · Canada
- Languages at home
- 95% English-only · French/Haitian/Cajun 2% Spanish 1%
Political lean MEDSL · Cook
- 2024 margin
- Solid D (+42.0) · D 70.4% · R 28.4% · Other 1.2%
- 2008→2024 swing
- -11.4pp toward R · 2008: 53.4pp · 2024: 42.0pp
- All cycles
- 2024: D+42.0 2020: D+50.3 2016: D+53.0 2012: D+49.4 2008: D+53.4
Not yet ingested
- Civics
- —
Market trends
- HPI YoY
- ▼ -66.88%
- Current HPI
- 193.2346
- Rent YoY
- ▲ 9.65%
- Metro
- Chicago-Naperville-Elgin, IL-IN-WI
- State GDP YoY
- ▲ 1.59%
- F500 in state
- 60
Industry mix (Fortune 500 HQ in IL)
| Industry | F500 HQs | Revenue |
|---|---|---|
| Insurance | 4 | $201B |
|
||
| Consumer Goods | 4 | $87B |
|
||
| Industrial Machinery | 3 | $64B |
|
||
| Healthcare | 2 | $55B |
|
||
| Retail / Pharmacy | 1 | $148B |
|
||
| Agriculture / Food | 1 | $86B |
|
||
Price history
+220.0% since first listed4 events — show timeline
- 2026-05-28 Listed $160,000 MRED as Distributed by MLS Grid
- 1996-08-15 Sold (Public Records) $54,500 Public Records
- 1988-07-19 Sold (Public Records) $56,000 Public Records
- 1983-12-06 Sold (Public Records) $50,000 Public Records
Property tax history
+5.9%/yrLatest (2023): $4,626 · +98.1% YoY. Source: county tax records.
Cash-flow waterfall
monthlySold comps — $/sqft
last 12 mo · ≤1 miLoading sold comps…