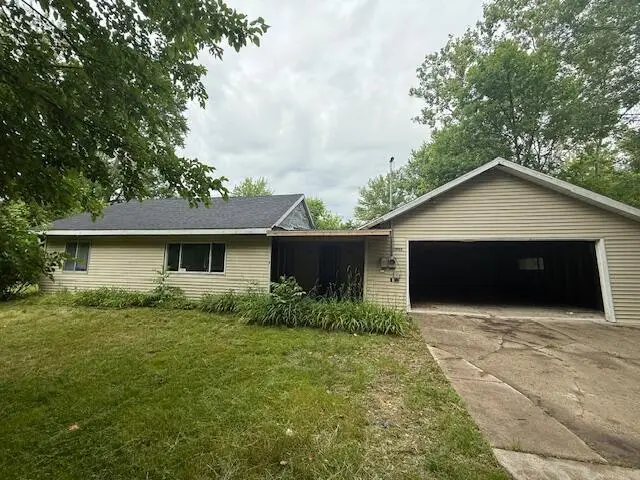
3903 Willow Dr NE · Plainfield, MI
Flood risk 10/10 · Severe
- FEMA flood zone
- AE
- Chance of flooding over 30 yrs
- 0.99%
- Est. flood insurance / yr
- $2,026 – $9,024
Fire risk 1/10 · Minimal
- Est. fire insurance / yr
- $784 – $1,456
Heat risk 2/10 · Minimal
- Hot days now (above 96°F)
- 7 days/yr
- Hot days in 30 yrs
- 15 days/yr
Wind risk 2/10 · Minimal
- Chance of severe wind over 30 yrs
- —
Air-quality risk 3/10 · Minor
- Unhealthy air days now
- 2 days/yr
- Unhealthy air days in 30 yrs
- 3 days/yr
Risk factors via First Street. Map © Google.
Why this score? — see what drove the B- grade
The composite is a weighted blend of 9 inputs, each scored 0–100. Each bar is that input's sub-score; the figure is the points it added to the 100-point composite (weight × sub-score).
- Cash flow +30.0/30.0
- 1% rule +10.0/10.0
- DSCR +10.0/10.0
- ARV discount +7.5/15.0
- Schools +3.6/10.0
- Rent growth +3.1/5.0
- Livability +2.5/5.0
- Condition / age +2.5/5.0
- Appreciation +0.0/10.0
$110,000
🖨 Deal sheet (PDF) 📄 Offer letter ✓ Due diligence
Listing remarks MLS
Grand River Waterfront Opportunity! Unlock the potential of riverfront living with this rare fixer upper special offering 80 feet of private frontage on the Grand River! Located just minutes from downtown Grand Rapids, this unique property is ready for the right buyer to bring it to life. The home will require an elevation survey and must be raised approximately 8 feet above the floodplain before remodeling, per the township but the possibilities are endless once completed. Major value-add features already in place include newer windows and slider door, upgraded electrical service, and a new concrete floor in the spacious 4-stall garage with new concrete floor which does not need to be raised with the house. What a great time to invest in a riverfront property with all the downtown investments a happening! Owner is a licensed realtor in the state of Michigan.
Key facts
- Newer windows
- New concrete floor
- Riverfront living
Tags
Property features AI
Exterior
- Parking: Attached garage; Four garage spaces
- Utilities: Natural gas connected; Public water
- Home design: Ranch-style single-family residence; Built in 1973; Public water
- Construction: Vinyl siding construction; Asphalt roof; Slab foundation; Built in 1973
- Exterior features: Fronts on the Grand River (waterfront); Lot of about 0.27 acres; Asphalt roof; Vinyl siding
Interior
- Bathrooms: One full bathroom
- Interior features: Five total rooms; Slab basement
Neighborhood map
What this means for you Summary
Snapshot
- This is a 3-bed/1.0-bath single-family listed at $110k.
Deal economics
- At list price, monthly cash flow is $285 ($3k/yr) — positive.
- The deal already cash-flows at list — no discount required.
- Meets the 1% rule at list price ($2k rent vs $110k).
- Recommended offer: $107k (3.0% below list) — sets the bar for market timing.
Location & tenants
- Location reads: area grade B — affects rentability + tenant quality, not the cash-flow math above.
- Northview Public Schools (suburban): math 32% / reading 50% proficiency, ranked #187 of 540 in MI (top 35%) — families likely to look elsewhere, expect single-tenant / working-renter base with shorter leases.
- Zoned schools: East Oakview Elementary School (math 37% / reading 57%, grade D-, #433 of 1,397 statewide, top 34%, 375 students, 44% FRL); Highlands School (math 31% / reading 41%, grade F, #269 of 493 statewide, top 56%, 412 students, 47% FRL); Northview High School (math 31% / reading 56%, grade F, #257 of 713 statewide, top 36%, 1,092 students, 44% FRL).
- Market conditions: Rents rising (+2.2%/yr); 165 active listings in the ZIP; 4 comparable units currently listed for rent nearby; rentals leasing fast (median 5d on market — plan ~1-2 weeks tenant-placement turnaround); solid renter incomes; 2,253 units permitted in Kent County in 2024 (969 in 5+ unit buildings).
Forward outlook
- Local home prices are declining (-3.0%/yr); year-one equity from $761 of loan paydown is wiped out by about $3k of value loss. Plan a longer hold.
- Kent County population projected at +22% by 2050 — long-run rental-demand tailwind backs the buy-and-hold thesis.
Negotiation context
- It's been on market 34 days — a 3% lower offer ($107k) is reasonable based on typical stale-listing flexibility.
- 7 sale attempts with the ask held roughly flat each time — persistent listings suggest the price (not the market) is what's stuck; bring a comps-based counter.
- Current owner paid $70k; list at $110k implies a 57% gain — meaningful room to come down on a strong offer.
Risks & watch-outs
- Watch-outs: flood insurance adds $460/mo.
- Climate carrying-cost: in FEMA flood zone AE (mandatory federal flood insurance) — expect insurance premiums to compound above CPI over the hold.
Questions for the listing agent
- It's been on market 34 days. Have you received any prior offers? Is the seller open to a 3% concession, seller financing, or rate buy-down credit?
- Built in 1973 — when were the roof, HVAC, electrical panel, plumbing, and water heater last replaced?
- What's the actual annual flood-insurance premium (NFIP or private), and is the property in a SFHA with mandatory coverage?
- Is there a deadline driving the sale (1031 exchange, divorce, estate, relocation)? That informs how much negotiation room exists.
- What's the average days-on-market for RENTAL listings here right now (not sales)? A rising rental-DOM trend means longer vacancies and softer asking-rent achievability than the comps imply.
- What's the recent tenant-quality profile in this submarket — average credit score on applications, eviction rate, late-payment / NSF rate, and stable-employment percentage? A property-management company in the area should have these aggregated.
- How much new for-sale + rental construction is in the pipeline within 1–3 miles? Heavy new supply typically softens prices + rents 12–24 months out; constrained supply supports both.
Investment metrics
- 1% rule
- 1.73% ✓
- Cap rate
- 14.42%
- Cash-on-cash
- 29.02%
- DSCR
- 2.29
- GRM
- 4.8
CMA / ARV
- ARV (on-the-fly)
- $294,768
- Comps found
- 7
Show comp detail 7 sales within ~0.75 mi
| Address | Dist | Beds/Ba | Sqft | Sold | Price | $/sf | Match |
|---|---|---|---|---|---|---|---|
| 4005 Filkins Dr NE | 0.44mi | 3/2.0 | 1,490 (+5%) | 8mo | $315,000 | $211 | 62 |
| 4035 Leland Ave NW | 0.66mi | 3/1.0 | 1,344 (-6%) | 3mo | $275,000 | $205 | 57 |
| 937 4 Mile Rd NE | 0.72mi | 3/1.0 | 1,448 (+2%) | 13mo | $290,000 | $200 | 53 |
| 3843 Stuyvesant Ave NE | 0.71mi | 3/2.0 | 1,350 (-5%) | 4mo | $325,000 | $241 | 51 |
| 945 4 Mile Rd NE | 0.75mi | 3/1.0 | 1,555 (+9%) | 1mo | $322,500 | $207 | 49 |
| 4119 Imogene Ave NE | 0.54mi | 3/1.0 | 1,550 (+9%) | 14mo | $299,000 | $193 | 48 |
| — | 0.66mi | 3/2.0 | 1,566 (+10%) | 15mo | $592,900 | $379 | 36 |
Match score weights: distance 35% · size 25% · config 20% · recency 20%. Top-matched comps best support the ARV.
Projected returns pro-forma
-3.0% appreciation · 2.21% rent growth · sell at horizon
- IRR
- -0.8%
- Equity multiple
- 0.97×
- Total profit
- $-895
- Equity at exit
- $16,401
- IRR
- 7.9%
- Equity multiple
- 1.58×
- Total profit
- $17,751
- Equity at exit
- $9,511
Cash invested: $30,800 (down + closing). Projections, not guarantees.
Landlord ↔ Tenant lean methodology
- Overall (STATE)
- 62 Landlord-Friendly
- State Michigan
- 62 Landlord-Friendly · EVEN
- County
- — inherits STATE
- City
- — inherits STATE
ZIP-level market 49525
- Rents YoY
- 2.2%
- Active inventory
- 165
- Price-to-rent
- 4.8×
Monthly cashflow live
- Estimated rent
- $1,905 medium interval (Pro) →
- Mortgage (P&I)
- −$577
- Tax est. 1.5%
- −$138 /mo · $1,650/yr
- Insurance
- −$46
- Flood insurance flood zone
- −$460 /mo · $5,525/yr
- HOA
- −$0
- Vacancy / Maint / Mgmt
- −$400
- Net cashflow
- $285
Break-even live
Sensitivity live
| Price | -10% $361 | -5% $323 | +0% $285 | +5% $246 | +10% $208 |
|---|---|---|---|---|---|
| Rent | -10% $134 | -5% $209 | +0% $285 | +5% $360 | +10% $435 |
| Rate | -1.0pp $340 | -0.5pp $312 | base $285 | +0.5pp $256 | +1.0pp $227 |
UW: 25.0% down · 7.5% · 30yr · 1.5% tax · 5.0% vac · 8.0% maint · 8.0% mgmt
Financing live
Cash to close
- Down payment
- $27,500
- Closing costs
- $3,300
- Reserves months
- —
- Total cash needed
- —
Loan-product check · same deal, 3 products live
Conventional
25% down · 7.5% · 30yr
- Down + closing
- —
- Monthly P&I
- —
- Monthly cashflow
- —
- DSCR
- —
- Eligible?
- —
Personal DTI + credit; lowest rate.
DSCR
20% down · 8.5% · 30yr
- Down + closing
- —
- Monthly P&I
- —
- Monthly cashflow
- —
- DSCR
- —
- Eligible?
- —
No personal income docs; deal must DSCR.
Hard money
10% down · 12.0% · 12mo
- Down + closing
- —
- Monthly P&I
- —
- Monthly cashflow
- —
- DSCR
- —
- Eligible?
- —
Short-term bridge; refi at stabilization.
Rent comps 4 comps
| Address | Beds | Baths | Sqft | Rent | $/sqft | DOM | Units | Dist |
|---|---|---|---|---|---|---|---|---|
| 1310 Arcadia Dr NE Grand Rapids, MI | 3.0 | 1.0 | 1100 | $1,980 | $1.80 | 5d | 1 | 1.19mi |
| 650 York Creek Dr NW Comstock Park, MI | 1.0–2.0 | 1.0–1.5 | 891 | $1,393 | $1.56 | 4d | 1 | 1.41mi |
| 3075 Plainfield Ave NE Grand Rapids, MI | 3.0 | 2.0 | 1652 | $1,895 | $1.15 | 23d | 1 | 1.44mi |
| 3101 Plainfield Ave NE Grand Rapids, MI | 3.0 | 2.0 | 1305 | $1,795 | $1.38 | 4d | 1 | 1.46mi |
Listing history 37 events
-
2026-06-21days on market $110,000 Active 34 DOM
-
2026-06-18days on market $110,000 Active 31 DOM
-
2026-06-17days on market $110,000 Active 30 DOM
-
2026-06-16days on market $110,000 Active 29 DOM
-
2026-06-15days on market $110,000 Active 28 DOM
-
2026-06-14days on market $110,000 Active 26 DOM
-
2026-06-13days on market $110,000 Active 25 DOM
-
2026-06-10days on market $110,000 Active 23 DOM
-
2026-06-09days on market $110,000 Active 22 DOM
-
2026-06-08days on market $110,000 Active 21 DOM
-
2026-06-07days on market $110,000 Active 20 DOM
-
2026-06-03days on market $110,000 Active 16 DOM
-
2026-06-03days on market $110,000 Active 15 DOM
-
2026-06-01days on market $110,000 Active 14 DOM
-
2026-05-31days on market $110,000 Active 13 DOM
-
2026-05-18$110,000 Active 872-char remark
Show marketing remark (871 chars)
Grand River Waterfront Opportunity! Unlock the potential of riverfront living with this rare fixer upper special offering 80 feet of private frontage on the Grand River! Located just minutes from downtown Grand Rapids, this unique property is ready for the right buyer to bring it to life. The home will require an elevation survey and must be raised approximately 8 feet above the floodplain before remodeling, per the township but the possibilities are endless once completed. Major value-add features already in place include newer windows and slider door, upgraded electrical service, and a new concrete floor in the spacious 4-stall garage with new concrete floor which does not need to be raised with the house. What a great time to invest in a riverfront property with all the downtown investments a happening! Owner is a licensed realtor in the state of Michigan.
-
2026-05-18$110,000 Active
Show marketing remark (871 chars)
Grand River Waterfront Opportunity! Unlock the potential of riverfront living with this rare fixer upper special offering 80 feet of private frontage on the Grand River! Located just minutes from downtown Grand Rapids, this unique property is ready for the right buyer to bring it to life. The home will require an elevation survey and must be raised approximately 8 feet above the floodplain before remodeling, per the township but the possibilities are endless once completed. Major value-add features already in place include newer windows and slider door, upgraded electrical service, and a new concrete floor in the spacious 4-stall garage with new concrete floor which does not need to be raised with the house. What a great time to invest in a riverfront property with all the downtown investments a happening! Owner is a licensed realtor in the state of Michigan.
-
2026-05-18$110,000 Active 871-char remark
Show marketing remark (871 chars)
Grand River Waterfront Opportunity! Unlock the potential of riverfront living with this rare fixer upper special offering 80 feet of private frontage on the Grand River! Located just minutes from downtown Grand Rapids, this unique property is ready for the right buyer to bring it to life. The home will require an elevation survey and must be raised approximately 8 feet above the floodplain before remodeling, per the township but the possibilities are endless once completed. Major value-add features already in place include newer windows and slider door, upgraded electrical service, and a new concrete floor in the spacious 4-stall garage with new concrete floor which does not need to be raised with the house. What a great time to invest in a riverfront property with all the downtown investments a happening! Owner is a licensed realtor in the state of Michigan.
-
2025-11-13historical
-
2025-11-12historical
-
2025-10-06price $125,000
-
2025-10-06price $125,000
-
2025-10-06price $125,000
-
2025-09-19$135,000 Active
-
2025-09-19$135,000 Active
-
2025-09-19historical
-
2025-09-18historical
-
2025-09-05price $139,900
-
2025-09-05price $139,900
-
2025-09-05price $139,900
-
2025-08-18price $149,900
-
2025-08-18price $149,900
-
2025-08-18price $149,900
-
2025-06-18$165,000 Active
-
2025-06-18$165,000 Active
-
2024-09-18soldstatus $70,000
-
2024-05-29soldstatus $45,000
ⓘ Source: listings_history table (triggers on properties + properties_extension) + one-shot
backfill from property_details.listing_events for pre-trigger history.
Climate risk First Street
- Flood 10/10 Extreme FEMA zone AE · 99% chance over 30 yrs
- Wildfire 1/10 Low
- Heat 2/10 Low 7 d/yr ≥96°F today · 15 d/yr by 30 yrs out
- Wind 2/10 Low
- Air quality 3/10 Moderate 2 unhealthy d/yr today · 3 by 30 yrs out
Nearby sold comps map
Loading sold comps map…
Walkable amenities ~0.75 mi
Loading nearby amenities…
Taxation est. · year 1
- Rental income
- $22,862
- − Mortgage interest
- −$6,162
- − Property taxes
- −$1,650
- − Insurance
- −$6,075
- − Repairs & maintenance
- −$1,829
- − Management
- −$1,829
- − Depreciation
- −$3,200
- Taxable income
- $2,118
- Est. tax owed @ 24.0%
- −$508
- After-tax cash flow
- $2,906/yr
For passive investors: Depreciation is non-cash, so a rental often shows a tax loss while cash-flowing — sheltering income. Rental losses are passive: they offset passive income freely, and up to $25,000/yr can offset ordinary (W-2) income if you actively participate and your MAGI is under $100k (phasing out to $0 by $150k); unused losses carry forward. On sale, claimed depreciation is recaptured at up to 25%, and gains may owe capital-gains tax (a 1031 exchange can defer both). Figures are a year-1 estimate at your 24.0% rate — not tax advice; consult a CPA.
Schools (NCES district)
- District
- Northview Public Schools
- NCES district ID
- 2625950
- Math proficiency
- 32% ▼ -12.00%
- Reading proficiency
- 50% ▼ -5.00%
- Median HH income
- $54,645
- Composite
- 35.7/100
- National rank
- #4866
- State rank
- #187 of 540 in MI
Livability — Plainfield
No livability data for this city. (Only ~50 U.S. cities are tracked.)
Census & demographics
- Census place
- Northview, MI
- County
- Kent County · 533,805 people
- Metro
- Grand Rapids-Kentwood, MI
- Population (ZIP)
- 30,887
- Household income
- $94,037
- Rent vs Own
- Severe rent burden
- 396.0
Population outlook (Kent County) Hauer SSP2
- Today (2025)
- 712,484 people
- By 2030
- 748,618 · +5.1%
- By 2040
- 814,777 · +14.4%
- By 2050
- 868,556 · +21.9%
- By 2075
- 966,487 · +35.7%
- By 2100
- 967,975 · +35.9%
Race, ethnicity, and origin ACS 2023
- Neighborhood character
- Predominantly White (85%)
- Race & ethnicity
- White 85% Two or more races 6% Hispanic / Latino 4% Black 3% Asian 2%
- Common ancestry
- Iranian 16% Romanian 8% Lithuanian 2%
- Foreign-born
- 4% · Canada, South Korea
- Languages at home
- 96% English-only · Spanish 1% Other Asian/Pacific 1% Other Indo-European 1%
Political lean MEDSL · Kent
- 2024 margin
- Lean D (+5.4) · D 51.8% · R 46.5% · Other 1.7%
- 2008→2024 swing
- +4.8pp toward D · 2008: 0.5pp · 2024: 5.4pp
- All cycles
- 2024: D+5.4 2020: D+6.1 2016: R+3.1 2012: R+7.9 2008: D+0.5
Not yet ingested
- Civics
- —
Market trends
- HPI YoY
- ▼ -195.79%
- Current HPI
- 256.0731
- Rent YoY
- ▲ 2.21%
- Metro
- Grand Rapids-Kentwood, MI
- State GDP YoY
- ▲ 1.37%
- F500 in state
- 28
Industry mix (Fortune 500 HQ in MI)
| Industry | F500 HQs | Revenue |
|---|---|---|
| Automotive Parts | 3 | $48B |
|
||
| Automotive | 2 | $372B |
|
||
| Chemicals | 1 | $45B |
|
||
| Automotive Retail | 1 | $29B |
|
||
| Healthcare / Medical Devices | 1 | $23B |
|
||
| Automotive Technology | 1 | $20B |
|
||
Price history
+144.4% since first listed22 events — show timeline
- 2026-05-18 Listed $110,000 REALCOMP
- 2026-05-18 Listed $110,000 MiRealSource-MiMLS
- 2026-05-18 Listed $110,000 SW Michigan MLS
- 2025-11-13 Listing Removed — MiRealSource-MiMLS
- 2025-11-12 Listing Removed — REALCOMP
- 2025-10-06 Price Changed $125,000 MiRealSource-MiMLS
- 2025-10-06 Price Changed $125,000 REALCOMP
- 2025-10-06 Price Changed $125,000 SW Michigan MLS
- 2025-09-19 Listing Removed — MiRealSource-MiMLS
- 2025-09-19 Listed $135,000 REALCOMP
- 2025-09-19 Listed $135,000 MiRealSource-MiMLS
- 2025-09-18 Listing Removed — REALCOMP
- 2025-09-05 Price Changed $139,900 MiRealSource-MiMLS
- 2025-09-05 Price Changed $139,900 REALCOMP
- 2025-09-05 Price Changed $139,900 SW Michigan MLS
- 2025-08-18 Price Changed $149,900 MiRealSource-MiMLS
- 2025-08-18 Price Changed $149,900 REALCOMP
- 2025-08-18 Price Changed $149,900 SW Michigan MLS
- 2025-06-18 Listed $165,000 REALCOMP
- 2025-06-18 Listed $165,000 MiRealSource-MiMLS
- 2024-09-18 Sold (Public Records) $70,000 Public Records
- 2024-05-29 Sold (Public Records) $45,000 Public Records
Property tax history
+8.4%/yrLatest (2025): $6,257 · +99.3% YoY. Source: county tax records.
Cash-flow waterfall
monthlySold comps — $/sqft
last 12 mo · ≤1 miLoading sold comps…