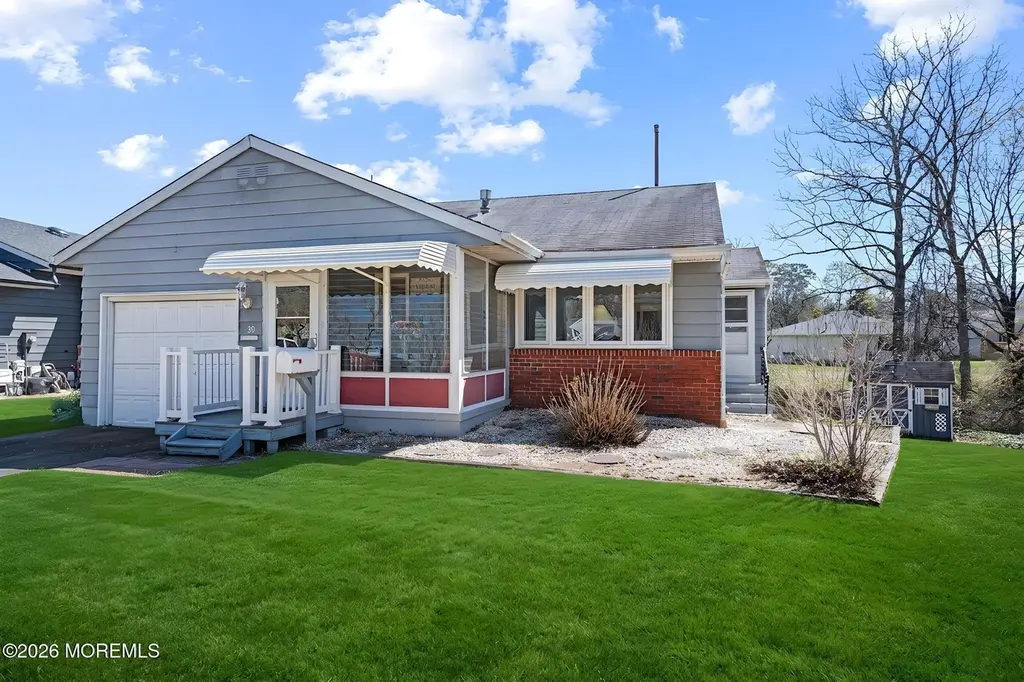
39 Coral Bell Holw Holw · Toms River, NJ
Flood risk 8/10 · Major
- FEMA flood zone
- X (unshaded)
- Chance of flooding over 30 yrs
- 0.99%
- Est. flood insurance / yr
- $507 – $1,088
Fire risk 3/10 · Minor
- Est. fire insurance / yr
- $526 – $976
Heat risk 7/10 · Major
- Hot days now (above 100°F)
- 7 days/yr
- Hot days in 30 yrs
- 15 days/yr
Wind risk 6/10 · Moderate
- Chance of severe wind over 30 yrs
- 74.0%
Air-quality risk 3/10 · Minor
- Unhealthy air days now
- 3 days/yr
- Unhealthy air days in 30 yrs
- 4 days/yr
Risk factors via First Street. Map © Google.
Why this score? — see what drove the B- grade
The composite is a weighted blend of 9 inputs, each scored 0–100. Each bar is that input's sub-score; the figure is the points it added to the 100-point composite (weight × sub-score).
- Cash flow +25.3/30.0
- ARV discount +13.9/15.0
- DSCR +8.3/10.0
- 1% rule +6.3/10.0
- Livability +4.0/5.0
- Schools +2.9/10.0
- Rent growth +2.5/5.0
- Condition / age +2.5/5.0
- Appreciation +0.0/10.0
$250,000
🖨 Deal sheet 📄 Offer letter ✓ Due diligence
Listing remarks
Take a look at this unique cardinal model 3 bed 1.5 bath home on a comfortable cul-de-sac featuring a full walk-out basement. Interior features include a large eat-in kitchen, hardwood floors through out, heated sun rm, walk in shower, and a walk up floored attic space. Exterior features include a brand new awning that covers the front porch, kitchen side door ingress, rear cement patio, and solar panels available for lease or purchase. This is a terrific find in a quiet community that is convenient to parkway, routes 9 & 37, shopping and entertainment. A most affordable option for a select buyer eligible for an age restricted community at The Gardens of Pleasant Plains.
Key facts
- 3,500 sq ft lot
- Garage
- Built 1970
Property features AI
Finance
- HOA & community: Community association: Gardens of Pleasant Plains; Annual association fee of $300; Community clubhouse
Exterior
- Parking: Attached 1-car garage
- Utilities: Public sewer; Solar via a purchase power agreement
- Home design: Single-family model: CARDINAL PLUS/BSMT; Fee simple ownership
- Construction: Basement: full (walk-out)
- Exterior features: Shingle roof; Creek on the property
Interior
- Kitchen: Stove; Dishwasher; Refrigerator
- Bedrooms: Two bedrooms on the first floor; One additional bedroom in the basement
- Flooring: Wood flooring
- Bathrooms: One full bathroom on the first floor; One full bathroom in the basement
- Heating & cooling: Baseboard heating; Central air conditioning
- Interior features: Attic fan; Walk-out full basement with sliding glass door access
- Laundry & utility: Washer; Dryer; Basement laundry room
Neighborhood map
What this means for you Summary
Snapshot
- This is a 2-bed/1.0-bath single-family listed at $250k.
Deal economics
- At list price, monthly cash flow is $499 ($6k/yr) — positive.
- The deal already cash-flows at list — no discount required.
- Meets the 1% rule at list price ($3k rent vs $250k).
- Cap rate 9.0% vs local median 3.8% in Toms River — top-decile yield for the area; either an underpriced asset or a hidden risk that comps aren't pricing in. Stress-test before assuming the spread holds.
Location & tenants
- Location reads 81/100 on livability (#61 in NJ, #1,538 nationally) — a professional / high-income tenant draw. Strengths: employment A+, housing A+, health & safety A+; Watch: commute D, cost of living F.
- Toms River Regional School District (suburban): math 18% / reading 44% proficiency, ranked #316 of 472 in NJ (top 67%) — families likely to look elsewhere, expect single-tenant / working-renter base with shorter leases.
- Market conditions: 262 active listings in the ZIP; 9 comparable units currently listed for rent nearby; rentals at typical pace (median 17d on market — plan ~3-4 weeks tenant-placement turnaround); solid renter incomes; 4,434 units permitted in Ocean County in 2024 (868 in 5+ unit buildings).
- This rent runs 39% of the median local income ($88k/yr) — at the standard rent-burdened threshold; future hikes will face affordability resistance.
Forward outlook
- Local home prices are declining (-3.0%/yr); year-one equity from $2k of loan paydown is wiped out by about $8k of value loss. Plan a longer hold.
- Ocean County population projected to shrink 8% by 2050 — rents likely to lag national; underwrite the cash flow, not the appreciation.
Negotiation context
- Only 14 days on market — expect competitive offers; lowballing is unlikely to land.
- 2 sale attempts with the ask held roughly flat each time — persistent listings suggest the price (not the market) is what's stuck; bring a comps-based counter.
- Current owner paid $70k; list at $250k implies a 257% gain — meaningful room to come down on a strong offer.
Risks & watch-outs
- Watch-outs: flood insurance adds $66/mo.
- Climate carrying-cost: severe flood risk; major wind risk, 74% chance of damaging wind over 30y; extreme-heat days projected 7→15/yr by 2055 (HVAC capex compounding) — expect insurance premiums to compound above CPI over the hold.
Questions for the listing agent
- Built in 1970 — when were the roof, HVAC, electrical panel, plumbing, and water heater last replaced?
- What's the actual annual flood-insurance premium (NFIP or private), and is the property in a SFHA with mandatory coverage?
- What does the HOA fee cover, when was the last increase, and are there any pending special assessments or reserve-fund shortfalls?
- Is there a deadline driving the sale (1031 exchange, divorce, estate, relocation)? That informs how much negotiation room exists.
- What's the average days-on-market for RENTAL listings here right now (not sales)? A rising rental-DOM trend means longer vacancies and softer asking-rent achievability than the comps imply.
- What's the recent tenant-quality profile in this submarket — average credit score on applications, eviction rate, late-payment / NSF rate, and stable-employment percentage? A property-management company in the area should have these aggregated.
- How much new for-sale + rental construction is in the pipeline within 1–3 miles? Heavy new supply typically softens prices + rents 12–24 months out; constrained supply supports both.
Investment metrics
- 1% rule
- 1.13% ✓
- Cap rate
- 9.01%
- Cash-on-cash
- 9.69%
- DSCR
- 1.43
- GRM
- 7.4
CMA / ARV
- ARV (on-the-fly)
- $291,200
- Comps found
- 12
Show comp detail 12 sales within ~0.75 mi
| Address | Dist | Beds/Ba | Sqft | Sold | Price | $/sf | Match |
|---|---|---|---|---|---|---|---|
| 23 Wall Cress Ct | 0.06mi | 2/1.0 | 1,024 (-2%) | 1mo | $279,000 | $272 | 94 |
| 27 Coral Bell Holw | 0.03mi | 2/1.0 | 1,052 (+1%) | 7mo | $185,000 | $176 | 90 |
| 50 Golden Glow Circus | 0.16mi | 2/1.0 | 1,040 (0%) | 5mo | $317,000 | $305 | 88 |
| 44 Gardenia Way | 0.13mi | 2/1.0 | 966 (-7%) | 3mo | $270,000 | $280 | 79 |
| 49 Green Dr | 0.32mi | 2/1.0 | 1,024 (-2%) | 6mo | $180,000 | $176 | 77 |
| 33 Gardenia Way | 0.18mi | 2/1.0 | 960 (-8%) | 4mo | $253,000 | $264 | 75 |
| 74 Fox Glove | 0.10mi | 2/1.0 | 916 (-12%) | 1mo | $295,000 | $322 | 74 |
| 95 Larkspur Ct | 0.13mi | 2/1.0 | 916 (-12%) | 3mo | $193,500 | $211 | 71 |
| 33 Sunflower Ln | 0.27mi | 2/1.0 | 966 (-7%) | 7mo | $240,000 | $248 | 69 |
| 16 Hare Bell Holw | 0.24mi | 2/1.0 | 916 (-12%) | 3mo | $260,000 | $284 | 67 |
| 61 Golden Glow Circus | 0.12mi | 2/1.0 | 896 (-14%) | 7mo | $300,000 | $335 | 66 |
| 28 Bellflower Ct | 0.28mi | 2/1.0 | 896 (-14%) | 5mo | $251,000 | $280 | 59 |
Match score weights: distance 35% · size 25% · config 20% · recency 20%. Top-matched comps best support the ARV.
Projected returns pro-forma
-3.0% appreciation · 3.0% rent growth · sell at horizon
- IRR
- -3.3%
- Equity multiple
- 0.88×
- Total profit
- $-8,707
- Equity at exit
- $37,276
- IRR
- 6.4%
- Equity multiple
- 1.48×
- Total profit
- $33,502
- Equity at exit
- $21,615
Cash invested: $70,000 (down + closing). Projections, not guarantees.
Landlord ↔ Tenant lean methodology
- Overall (STATE)
- 21 Tenant-Leaning
- State New Jersey
- 21 Tenant-Leaning · D+6
- County
- — inherits STATE
- City
- — inherits STATE
ZIP-level market 08755
- Active inventory
- 262
- Price-to-rent
- 7.4×
Monthly cashflow live
- Estimated rent
- $2,828 high interval (Pro) →
- Mortgage (P&I)
- −$1,311
- Tax from tax record
- −$229 /mo · $2,747/yr
- Insurance
- −$104
- Flood insurance flood zone
- −$66 /mo · $798/yr
- HOA
- −$25
- Vacancy / Maint / Mgmt
- −$594
- Net cashflow
- $499
Break-even live
UW: 25.0% down · 7.5% · 30yr · 1.5% tax · 5.0% vac · 8.0% maint · 8.0% mgmt
Financing live
Cash to close
- Down payment
- $62,500
- Closing costs
- $7,500
- Reserves months
- —
- Total cash needed
- —
Loan-product check · same deal, 3 products live
Conventional
25% down · 7.5% · 30yr
- Down + closing
- —
- Monthly P&I
- —
- Monthly cashflow
- —
- DSCR
- —
- Eligible?
- —
Personal DTI + credit; lowest rate.
DSCR
20% down · 8.5% · 30yr
- Down + closing
- —
- Monthly P&I
- —
- Monthly cashflow
- —
- DSCR
- —
- Eligible?
- —
No personal income docs; deal must DSCR.
Hard money
10% down · 12.0% · 12mo
- Down + closing
- —
- Monthly P&I
- —
- Monthly cashflow
- —
- DSCR
- —
- Eligible?
- —
Short-term bridge; refi at stabilization.
Rent comps 9 comps
| Address | Beds | Baths | Sqft | Rent | $/sqft | DOM | Units | Dist |
|---|---|---|---|---|---|---|---|---|
| 13 Swain Ave Toms River, NJ | 3.0 | 2.0 | 1500 | $3,199 | $2.13 | 16d | 1 | 0.52mi |
| 1091 W Whitty Rd Toms River, NJ | 2.0–3.0 | 2.0–2.5 | 1758 | $2,850 | $1.62 | 1d | 4 | 0.63mi |
| 1255 NJ-166 Toms River, NJ | 1.0 | 1.0 | 940 | $2,199 | $2.34 | 24d | 1 | 0.93mi |
| 1255 NJ-166 Toms River, NJ | 1.0 | 1.0 | 940 | $1,994 | $2.12 | 43d | 1 | 0.93mi |
| 1255 New Jersey 166 Unit D9 Toms River, NJ | 1.0 | 1.0 | 940 | $2,199 | $2.34 | 43d | 1 | 0.96mi |
| 1255 New Jersey 166 Unit A4 Toms River, NJ | 1.0 | 2.0 | 990 | $2,045 | $2.07 | 43d | 1 | 0.96mi |
| 3600 Cypress Point Dr Toms River, NJ | 1.0–2.0 | 1.0–2.0 | 1170 | $2,964 | $2.53 | 1d | 18 | 1.11mi |
| 30 Green View Way Toms River, NJ | 1.0–3.0 | 2.0–3.0 | 1450 | $2,682 | $1.85 | 1d | 1 | 1.31mi |
| 1732 4th Ave Toms River, NJ | 3.0 | 1.0 | 1248 | $3,500 | $2.80 | 1d | 1 | 1.45mi |
HOA detail
- Monthly dues
- $25 · $300/yr
Listing history 9 events
-
2026-04-23status Pending
-
2026-04-09$250,000 Active
-
2026-04-03historical $250,000
-
2026-02-21historical
-
2026-02-21$250,000 Active
-
2026-02-05historical
-
1997-11-19soldstatus $70,000
-
1988-11-18soldstatus $89,000
-
1984-01-01soldstatus $45,500
ⓘ Source: listings_history table (triggers on properties + properties_extension) + one-shot
backfill from property_details.listing_events for pre-trigger history.
Tax reassessment forecast NJ · Partial reset (capped growth)
- Current annual tax
- $2,747 · $229/mo
- Projected year-2 tax
- $4,486 · $374/mo
- Expected delta
- +$1,739/yr (+$145/mo · 63.3%)
ⓘ Screening estimate from a state-policy table — verify with the county assessor before closing.
Climate risk First Street
- Flood 8/10 Severe FEMA zone X (unshaded) · 99% chance over 30 yrs
- Wildfire 3/10 Moderate
- Heat 7/10 Severe 7 d/yr ≥100°F today · 15 d/yr by 30 yrs out
- Wind 6/10 Major 74% chance of damaging wind over 30 yrs
- Air quality 3/10 Moderate 3 unhealthy d/yr today · 4 by 30 yrs out
Nearby sold comps map
Loading sold comps map…
Walkable amenities ~0.75 mi
Loading nearby amenities…
Taxation est. · year 1
- Rental income
- $33,936
- − Mortgage interest
- −$14,004
- − Property taxes
- −$2,747
- − Insurance
- −$2,048
- − Repairs & maintenance
- −$2,715
- − Management
- −$2,715
- − HOA
- −$300
- − Depreciation
- −$7,273
- Taxable income
- $2,136
- Est. tax owed @ 24.0%
- −$513
- After-tax cash flow
- $5,471/yr
For passive investors: Depreciation is non-cash, so a rental often shows a tax loss while cash-flowing — sheltering income. Rental losses are passive: they offset passive income freely, and up to $25,000/yr can offset ordinary (W-2) income if you actively participate and your MAGI is under $100k (phasing out to $0 by $150k); unused losses carry forward. On sale, claimed depreciation is recaptured at up to 25%, and gains may owe capital-gains tax (a 1031 exchange can defer both). Figures are a year-1 estimate at your 24.0% rate — not tax advice; consult a CPA.
Schools (NCES district)
- District
- Toms River Regional School District
- NCES district ID
- 3416230
- Math proficiency
- 18% ▼ -19.00%
- Reading proficiency
- 44% ▼ -10.00%
- Median HH income
- $72,370
- Composite
- 29.07/100
- National rank
- #6602
- State rank
- #316 of 472 in NJ
Livability — Toms River
- Score
- 81/100
- State rank
- #61
- US rank
- #1538
Category grades
Schools grade is shown separately in the Schools card above.
Census & demographics
- Census place
- Toms River, NJ
- County
- Ocean County · 439,426 people
- City population
- 131,205
- Metro
- New York-Newark-Jersey City, NY-NJ-PA
- Population (ZIP)
- 29,670
- Household income
- $87,575
- Rent vs Own
- Severe rent burden
- 529.0
Population outlook (Ocean County) Hauer SSP2
- Today (2025)
- 586,991 people
- By 2030
- 581,403 · -1.0%
- By 2040
- 564,913 · -3.8%
- By 2050
- 538,149 · -8.3%
- By 2075
- 468,845 · -20.1%
- By 2100
- 350,297 · -40.3%
Race, ethnicity, and origin ACS 2023
- Neighborhood character
- Predominantly White (73%)
- Race & ethnicity
- White 73% Hispanic / Latino 11% Black 9% Two or more races 8% Asian 4%
- Hispanic origin (detail)
- Puerto Rican 6%
- Common ancestry
- Romanian 5% Italian 2% Scotch-Irish 2%
- Foreign-born
- 10% · Canada, Jamaica, South Korea
- Languages at home
- 84% English-only · Spanish 7% Other Indo-European 2% Tagalog/Filipino 2%
Political lean MEDSL · Ocean
- 2024 margin
- Solid R (+36.0) · D 31.4% · R 67.4% · Other 1.2%
- 2008→2024 swing
- -17.6pp toward R · 2008: -18.4pp · 2024: -36.0pp
- All cycles
- 2024: R+36.0 2020: R+28.7 2016: R+34.0 2012: R+17.7 2008: R+18.4
Not yet ingested
- Civics
- —
Market trends
- HPI YoY
- ▼ -223.51%
- Current HPI
- 303.2721
- Rent YoY
- —
- Metro
- New York-Newark-Jersey City, NY-NJ-PA
- State GDP YoY
- ▲ 2.05%
- F500 in state
- 34
Industry mix (Fortune 500 HQ in NJ)
| Industry | F500 HQs | Revenue |
|---|---|---|
| Consumer Goods | 3 | $31B |
|
||
| Pharmaceuticals | 2 | $153B |
|
||
| Technology | 2 | $21B |
|
||
| Insurance | 2 | $20B |
|
||
| Healthcare | 2 | $19B |
|
||
| Financial Services | 1 | $70B |
|
||
Price history
+449.5% since first listed9 events — show timeline
- 2026-04-23 Pending — MOMLS
- 2026-04-09 Listed $250,000 MOMLS
- 2026-04-03 Coming Soon $250,000 MOMLS
- 2026-02-21 Listing Removed — BRIGHT MLS
- 2026-02-21 Listed $250,000 BRIGHT MLS
- 2026-02-05 Coming Soon — BRIGHT MLS
- 1997-11-19 Sold (Public Records) $70,000 Public Records
- 1988-11-18 Sold (Public Records) $89,000 Public Records
- 1984-01-01 Sold (Public Records) $45,500 Public Records
Property tax history
+1.3%/yrLatest (2025): $2,747 · +7.3% YoY. Source: county tax records.
Cash-flow waterfall
monthlySold comps — $/sqft
last 12 mo · ≤1 miLoading sold comps…