 🏗️ New Construction
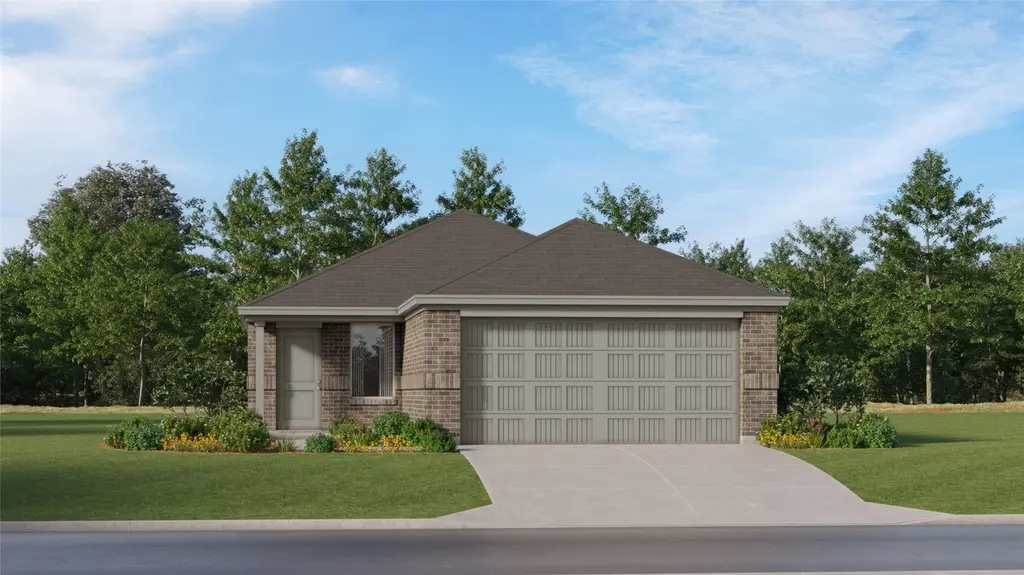
11953 Noble Wood Village Dr · Magnolia, TX
Flood risk 1/10 · Minimal
- FEMA flood zone
- X (unshaded)
- Chance of flooding over 30 yrs
- 0.0%
- Est. flood insurance / yr
- $507 – $1,088
Fire risk 5/10 · Moderate
- Est. fire insurance / yr
- $1,222 – $2,270
Heat risk 8/10 · Major
- Hot days now (above 111°F)
- 7 days/yr
- Hot days in 30 yrs
- 24 days/yr
Wind risk 9/10 · Severe
- Chance of severe wind over 30 yrs
- 99.0%
Air-quality risk 2/10 · Minimal
- Unhealthy air days now
- 2 days/yr
- Unhealthy air days in 30 yrs
- 2 days/yr
Risk factors via First Street. Map © Google.
Why this score? — see what drove the B- grade
The composite is a weighted blend of 9 inputs, each scored 0–100. Each bar is that input's sub-score; the figure is the points it added to the 100-point composite (weight × sub-score).
- Cash flow +21.2/30.0
- Appreciation +10.0/10.0
- ARV discount +7.5/15.0
- DSCR +6.7/10.0
- 1% rule +5.8/10.0
- Condition / age +4.0/5.0
- Schools +3.9/10.0
- Livability +3.7/5.0
- Rent growth +2.6/5.0
$225,990
🖨 Deal sheet 📄 Offer letter ✓ Due diligence
Listing remarks MLS
This single-level home showcases a spacious open floorplan shared between the kitchen, dining area and family room for easy entertaining during gatherings. An owner's suite enjoys a private location in a rear corner of the home, complemented by an en-suite bathroom and walk-in closet. There are two secondary bedrooms along the side of the home, which are ideal for household members and hosting overnight guests.
Key facts
- Walk-in closet
- Open floorplan
- Secondary bedrooms
Tags
Property features AI
Finance
- HOA & community: Alamo Management Group; Annual association fee of $400; Community playground
Exterior
- Parking: Attached 2-car garage
- Utilities: Public water; Public sewer
- Home design: Residential property; Under construction (new construction); Slab foundation; Living area approximately 1,273; Built in 2026; Constructed with brick and cement siding
- Construction: Brick and cement siding construction; Composition roof; Slab foundation; New construction (2026)
- Exterior features: Subdivision lot; Composition roof
Interior
- Kitchen: Dishwasher; Electric oven; Electric range; Gas oven; Gas range
- Bedrooms: 5 rooms total
- Flooring: Carpet; Vinyl
- Bathrooms: 2 full bathrooms
- Heating & cooling: Central heating (electric and gas); Central air conditioning (electric and gas)
- Interior features: Breakfast bar; Kitchen open to family room; Pantry; Separate shower; Tub with shower
- Laundry & utility: Washer hookup; Electric dryer hookup; Gas dryer hookup
Neighborhood map
What this means for you Summary
Snapshot
- This is a 3-bed/2.0-bath single-family listed at $226k. Condition is rated good.
Deal economics
- At list price, monthly cash flow is $289 ($3k/yr) — positive.
- The deal already cash-flows at list — no discount required.
- To meet the 1% rule (rent ≥ 1% of price), the offer needs to be $217k (4.1% below list).
- Recommended offer: $217k (4.1% below list) — sets the bar for 1% rule.
- Cap rate 8.0% vs local median 3.4% in Magnolia — top-decile yield for the area; either an underpriced asset or a hidden risk that comps aren't pricing in. Stress-test before assuming the spread holds.
Location & tenants
- Location reads 73/100 on livability (#222 in TX) — a middle-class / working-renter tenant base. Strengths: crime A+, cost of living A+, housing A+; Watch: amenities F, commute F.
- Magnolia ISD (rural): math 42% / reading 45% proficiency, ranked #247 of 826 in TX (top 30%) — families likely to look elsewhere, expect single-tenant / working-renter base with shorter leases.
- Zoned schools: Magnolia Parkway El (math 38% / reading 46%, grade F, #1,335 of 4,322 statewide, top 33%, 776 students, 45% FRL); Magnolia H S (math 47% / reading 62%, grade C-, #379 of 1,632 statewide, top 26%, 2,248 students, 31% FRL) — zoned schools at 38% FRL track the district average.
- Market conditions: Rents flat; 1604 active listings in the ZIP; 2 comparable units currently listed for rent nearby; high-income renter base; 13,259 units permitted in Montgomery County in 2024 (1,402 in 5+ unit buildings).
Forward outlook
- In year one you build about $22k of equity ($1k loan paydown + $20k appreciation (10.0% local appreciation)).
- Montgomery County population projected at +65% by 2050 — long-run rental-demand tailwind backs the buy-and-hold thesis.
- At projected returns (10.0% appreciation + 0.3% rent growth), your $56k cash investment doubles in ~3 years — after that, you're playing with house money.
- By year 2, paydown + projected appreciation supports a ~$35k cash-out refi (75% LTV) — recoverable capital for the next deal without selling this one.
Negotiation context
- It's been on market 28 days — a 2% lower offer ($223k) is reasonable based on typical stale-listing flexibility.
- 2 sale attempts; this cycle's ask has dropped $18k (7%) from the opening price — seller is motivated, your offer sets the floor, not the list.
Risks & watch-outs
- Climate carrying-cost: severe wind risk, 99% chance of damaging wind over 30y; moderate wildfire risk; extreme-heat days projected 7→24/yr by 2055 (HVAC capex compounding) — expect insurance premiums to compound above CPI over the hold.
Questions for the listing agent
- What does the HOA fee cover, when was the last increase, and are there any pending special assessments or reserve-fund shortfalls?
- Is there a deadline driving the sale (1031 exchange, divorce, estate, relocation)? That informs how much negotiation room exists.
- Schools are D-rated, which usually means shorter tenancies and higher turnover. Who's the typical renter profile here, and what's been the actual vacancy rate?
- What's the average days-on-market for RENTAL listings here right now (not sales)? A rising rental-DOM trend means longer vacancies and softer asking-rent achievability than the comps imply.
- What's the recent tenant-quality profile in this submarket — average credit score on applications, eviction rate, late-payment / NSF rate, and stable-employment percentage? A property-management company in the area should have these aggregated.
- How much new for-sale + rental construction is in the pipeline within 1–3 miles? Heavy new supply typically softens prices + rents 12–24 months out; constrained supply supports both.
Investment metrics
- 1% rule
- 1.08% ✓
- Cap rate
- 8.02%
- Cash-on-cash
- 6.16%
- DSCR
- 1.27
- GRM
- 7.7
CMA / ARV
- ARV (on-the-fly)
- $201,134
- Comps found
- 12
Show comp detail 12 sales within ~0.75 mi
| Address | Dist | Beds/Ba | Sqft | Sold | Price | $/sf | Match |
|---|---|---|---|---|---|---|---|
| 11962 Noble Wood Village Dr | 0.03mi | 3/2.0 | 1,273 (0%) | 0mo | $224,990 | $177 | 98 |
| 11982 Noble Wood Village Dr | 0.07mi | 3/2.0 | 1,273 (0%) | 0mo | $224,990 | $177 | 97 |
| 11736 Lazy Oak Creek Dr | 0.08mi | 3/2.0 | 1,273 (0%) | 1mo | $212,440 | $167 | 96 |
| 12002 Noble Wood Village Dr | 0.20mi | 3/2.0 | 1,273 (0%) | 1mo | $191,140 | $150 | 90 |
| 11990 Noble Wood Village Dr | 0.08mi | 3/2.0 | 1,409 (+11%) | 1mo | $224,990 | $160 | 78 |
| 11995 Noble Wood Village Dr | 0.09mi | 3/2.0 | 1,418 (+11%) | 1mo | $215,340 | $152 | 76 |
| 12010 Noble Wood Village Dr | 0.12mi | 3/2.0 | 1,409 (+11%) | 1mo | $213,040 | $151 | 76 |
| 12023 Noble Wood Village Dr | 0.20mi | 3/2.0 | 1,409 (+11%) | 2mo | $203,990 | $145 | 72 |
| 11999 Noble Wood Village Dr | 0.20mi | 3/2.0 | 1,409 (+11%) | 2mo | $219,990 | $156 | 72 |
| 12039 Noble Wood Village Dr | 0.21mi | 3/2.0 | 1,418 (+11%) | 0mo | $223,590 | $158 | 71 |
| 12059 Noble Wood Village Dr | 0.19mi | 3/2.0 | 1,418 (+11%) | 2mo | $223,990 | $158 | 71 |
| 11986 Noble Wood Village Dr | 0.22mi | 3/2.0 | 1,418 (+11%) | 1mo | $222,440 | $157 | 70 |
Match score weights: distance 35% · size 25% · config 20% · recency 20%. Top-matched comps best support the ARV.
Projected returns pro-forma
10.0% appreciation · 0.32% rent growth · sell at horizon
- IRR
- 27.7%
- Equity multiple
- 3.17×
- Total profit
- $122,318
- Equity at exit
- $181,197
- IRR
- 23.4%
- Equity multiple
- 6.96×
- Total profit
- $335,500
- Equity at exit
- $390,759
Cash invested: $56,318 (down + closing). Projections, not guarantees.
Landlord ↔ Tenant lean methodology
- Overall (STATE)
- 87 Strongly Landlord-Friendly
- State Texas
- 87 Strongly Landlord-Friendly · R+5
- County
- — inherits STATE
- City
- — inherits STATE
ZIP-level market 77354
- Home prices YoY
- 2.4%
- Rents YoY
- 0.3%
- Active inventory
- 1604
- Price-to-rent
- 8.7×
Monthly cashflow live
- Estimated rent
- $2,167 medium interval (Pro) →
- Mortgage (P&I)
- −$1,055
- Tax est. 1.5%
- −$251 /mo · $3,017/yr
- Insurance
- −$84
- HOA
- −$33
- Vacancy / Maint / Mgmt
- −$455
- Net cashflow
- $289
Break-even live
UW: 25.0% down · 7.5% · 30yr · 1.5% tax · 5.0% vac · 8.0% maint · 8.0% mgmt
Financing live
Cash to close
- Down payment
- $50,284
- Closing costs
- $6,034
- Reserves months
- —
- Total cash needed
- —
Loan-product check · same deal, 3 products live
Conventional
25% down · 7.5% · 30yr
- Down + closing
- —
- Monthly P&I
- —
- Monthly cashflow
- —
- DSCR
- —
- Eligible?
- —
Personal DTI + credit; lowest rate.
DSCR
20% down · 8.5% · 30yr
- Down + closing
- —
- Monthly P&I
- —
- Monthly cashflow
- —
- DSCR
- —
- Eligible?
- —
No personal income docs; deal must DSCR.
Hard money
10% down · 12.0% · 12mo
- Down + closing
- —
- Monthly P&I
- —
- Monthly cashflow
- —
- DSCR
- —
- Eligible?
- —
Short-term bridge; refi at stabilization.
Rent comps 2 comps
| Address | Beds | Baths | Sqft | Rent | $/sqft | DOM | Units | Dist |
|---|---|---|---|---|---|---|---|---|
| 30314 Ruby Forest Ct Magnolia, TX | 3.0 | 2.0 | 1650 | $2,595 | $1.57 | 43d | 1 | 0.83mi |
| 32626A Karen Dr Magnolia, TX | 2.0 | 1.0 | 1300 | $1,600 | $1.23 | 43d | 1 | 1.26mi |
HOA detail
- Monthly dues
- $33 · $396/yr
Listing history 19 events
-
2026-06-18price $225,990 Active 28 DOM
-
2026-06-18remarks 635-char remark
-
2026-06-18days on market $223,990 Active 28 DOM
-
2026-06-17days on market $223,990 Active 27 DOM
-
2026-06-16days on market $223,990 Active 26 DOM
-
2026-06-15days on market $223,990 Active 25 DOM
-
2026-06-13days on market $223,990 Active 23 DOM
-
2026-06-09pricedays on market $223,990 Active 19 DOM
-
2026-06-08days on market $228,990 Active 18 DOM
-
2026-06-07days on market $228,990 Active 17 DOM
-
2026-06-04days on market $228,990 Active 14 DOM
-
2026-06-03days on market $228,990 Active 13 DOM
-
2026-06-02days on market $228,990 Active 12 DOM
-
2026-06-01days on market $228,990 Active 11 DOM
-
2026-05-31days on market $228,990 Active 10 DOM
-
2026-05-22price $228,990
Show marketing remark (414 chars)
This single-level home showcases a spacious open floorplan shared between the kitchen, dining area and family room for easy entertaining during gatherings. An owner's suite enjoys a private location in a rear corner of the home, complemented by an en-suite bathroom and walk-in closet. There are two secondary bedrooms along the side of the home, which are ideal for household members and hosting overnight guests.
-
2026-05-22price $228,990 414-char remark
Show marketing remark (414 chars)
This single-level home showcases a spacious open floorplan shared between the kitchen, dining area and family room for easy entertaining during gatherings. An owner's suite enjoys a private location in a rear corner of the home, complemented by an en-suite bathroom and walk-in closet. There are two secondary bedrooms along the side of the home, which are ideal for household members and hosting overnight guests.
-
2026-05-21$243,890 Active
-
2026-05-19$243,890 Active 414-char remark
Show marketing remark (414 chars)
This single-level home showcases a spacious open floorplan shared between the kitchen, dining area and family room for easy entertaining during gatherings. An owner's suite enjoys a private location in a rear corner of the home, complemented by an en-suite bathroom and walk-in closet. There are two secondary bedrooms along the side of the home, which are ideal for household members and hosting overnight guests.
ⓘ Source: listings_history table (triggers on properties + properties_extension) + one-shot
backfill from property_details.listing_events for pre-trigger history.
Climate risk First Street
- Flood 1/10 Low FEMA zone X (unshaded) · 0% chance over 30 yrs
- Wildfire 5/10 Major
- Heat 8/10 Severe 7 d/yr ≥111°F today · 24 d/yr by 30 yrs out
- Wind 9/10 Extreme 99% chance of damaging wind over 30 yrs
- Air quality 2/10 Low 2 unhealthy d/yr today · 2 by 30 yrs out
Nearby sold comps map
Loading sold comps map…
Walkable amenities ~0.75 mi
Loading nearby amenities…
Taxation est. · year 1
- Rental income
- $26,007
- − Mortgage interest
- −$11,267
- − Property taxes
- −$3,017
- − Insurance
- −$1,006
- − Repairs & maintenance
- −$2,081
- − Management
- −$2,081
- − HOA
- −$396
- − Depreciation
- −$5,851
- Taxable income
- $309
- Est. tax owed @ 24.0%
- −$74
- After-tax cash flow
- $3,395/yr
For passive investors: Depreciation is non-cash, so a rental often shows a tax loss while cash-flowing — sheltering income. Rental losses are passive: they offset passive income freely, and up to $25,000/yr can offset ordinary (W-2) income if you actively participate and your MAGI is under $100k (phasing out to $0 by $150k); unused losses carry forward. On sale, claimed depreciation is recaptured at up to 25%, and gains may owe capital-gains tax (a 1031 exchange can defer both). Figures are a year-1 estimate at your 24.0% rate — not tax advice; consult a CPA.
Condition & rehab AI · 24 photos
This single-family home presents as move-in ready with a good condition score and minimal repairs needed. The property offers a spacious open floorplan and modern design, making it an attractive option for both resale and rental markets.
Value-add opportunities
- Both Painting the exterior and interior walls — Enhances curb appeal and interior aesthetics
- Both Updating the flooring to a more modern style — Improves the overall look and feel of the home
- Both Upgrading the kitchen appliances to a more modern style — Enhances functionality and appeal
- Both Adding smart home features — Improves convenience and energy efficiency
Renovation cost estimate screening
Value-add ROI direction
- Both Painting the exterior and interior walls — Enhances curb appeal and interior aesthetics ↑
- Both Updating the flooring to a more modern style — Improves the overall look and feel of the home ↑
- Both Upgrading the kitchen appliances to a more modern style — Enhances functionality and appeal ↑
- Both Adding smart home features — Improves convenience and energy efficiency ↑
ⓘ Cost ranges are severity-bucket heuristics (US national rule-of-thumb). Get contractor quotes + a written scope before underwriting a rehab budget.
Schools (NCES district)
- District
- Magnolia ISD
- NCES district ID
- 4828740
- Math proficiency
- 42% ▼ -7.00%
- Reading proficiency
- 45% ▼ -4.00%
- Median HH income
- $71,692
- Composite
- 39.46/100
- National rank
- #3958
- State rank
- #247 of 826 in TX
Livability — Magnolia
- Score
- 73/100
- State rank
- #222
- US rank
- #5442
Category grades
Schools grade is shown separately in the Schools card above.
Census & demographics
- County
- Montgomery County · 663,713 people
- City population
- 106,505
- Metro
- Houston-The Woodlands-Sugar Land, TX
- Population (ZIP)
- 44,900
- Household income
- $112,504
- Rent vs Own
- Severe rent burden
- 586.0
Population outlook (Montgomery County) Hauer SSP2
- Today (2025)
- 713,896 people
- By 2030
- 805,263 · +12.8%
- By 2040
- 992,708 · +39.1%
- By 2050
- 1,179,590 · +65.2%
- By 2075
- 1,628,084 · +128.1%
- By 2100
- 1,937,880 · +171.5%
Race, ethnicity, and origin ACS 2023
- Neighborhood character
- Predominantly White (66%)
- Race & ethnicity
- White 66% Hispanic / Latino 25% Two or more races 18% Black 3% Asian 1%
- Hispanic origin (detail)
- Mexican 14% Puerto Rican 1%
- Common ancestry
- Lithuanian 4% Slovak 2% Italian 2%
- Foreign-born
- 11% · Canada, Vietnam
- Languages at home
- 83% English-only · Spanish 15% Other Indo-European 1% German/W. Germanic 1%
Political lean MEDSL · Montgomery
- 2024 margin
- Solid R (+45.5) · D 26.8% · R 72.3%
- 2008→2024 swing
- +7.2pp toward D · 2008: -52.7pp · 2024: -45.5pp
- All cycles
- 2024: R+45.5 2020: R+43.8 2016: R+51.4 2012: R+60.7 2008: R+52.7
Not yet ingested
- Civics
- —
Market trends
- HPI YoY
- ▲ 12.09%
- Current HPI
- 512.87
- Rent YoY
- ▲ 0.32%
- Metro
- Houston-The Woodlands-Sugar Land, TX
- State GDP YoY
- ▲ 3.95%
- F500 in state
- 110
Industry mix (Fortune 500 HQ in TX)
| Industry | F500 HQs | Revenue |
|---|---|---|
| Energy | 16 | $1,198B |
|
||
| Technology | 5 | $198B |
|
||
| Engineering / Construction | 4 | $72B |
|
||
| Energy Services | 3 | $60B |
|
||
| Utilities | 3 | $41B |
|
||
| Healthcare | 2 | $330B |
|
||
Price history
-6.1% since first listed4 events — show timeline
- 2026-05-22 Price Changed $228,990 HARMLS
- 2026-05-22 Price Changed $228,990 Zillow
- 2026-05-21 Listed $243,890 HARMLS
- 2026-05-19 Listed $243,890 Zillow
Cash-flow waterfall
monthlySold comps — $/sqft
last 12 mo · ≤1 miLoading sold comps…