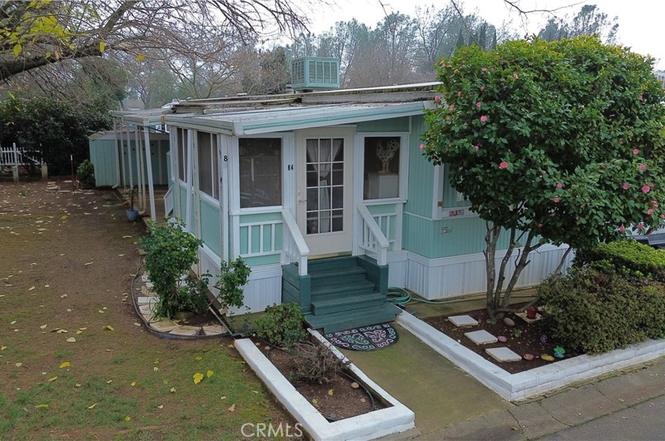
6368 Lincoln Blvd #84 · Palermo, CA
Flood risk 1/10 · Minimal
- FEMA flood zone
- X (unshaded)
- Chance of flooding over 30 yrs
- 0.0%
- Est. flood insurance / yr
- $507 – $1,088
Fire risk 10/10 · Severe
- Est. fire insurance / yr
- $659 – $1,223
Heat risk 7/10 · Major
- Hot days now (above 105°F)
- 7 days/yr
- Hot days in 30 yrs
- 15 days/yr
Wind risk 1/10 · Minimal
- Chance of severe wind over 30 yrs
- —
Air-quality risk 10/10 · Severe
- Unhealthy air days now
- 34 days/yr
- Unhealthy air days in 30 yrs
- 39 days/yr
Risk factors via First Street. Map © Google.
Why this score? — see what drove the B- grade
The composite is a weighted blend of 9 inputs, each scored 0–100. Each bar is that input's sub-score; the figure is the points it added to the 100-point composite (weight × sub-score).
- Cash flow +30.0/30.0
- 1% rule +10.0/10.0
- DSCR +10.0/10.0
- ARV discount +7.5/15.0
- Rent growth +2.5/5.0
- Schools +2.5/10.0
- Condition / age +2.5/5.0
- Livability +2.4/5.0
- Appreciation +0.0/10.0
$35,500
🖨 Deal sheet (PDF) 📄 Offer letter ✓ Due diligence
Listing remarks
Discover peaceful senior living in the welcoming Lake Vista Community. This well-maintained 2-bedroom, 2-bathroom manufactured home is thoughtfully designed for comfort and convenience—offering a move-in-ready feel with much of the furniture in great condition available to remain with the home if the buyer desires. Enter through a bright, enclosed sunroom into an open living area ideal for both everyday relaxation and hosting guests. The smart split floor plan provides privacy, with a bedroom and full bathroom at each end of the home. A washer and dryer are included, adding to the home's convenient, ready-to-enjoy appeal. Outside, a covered patio and shaded yard create the perfect set
Key facts
- Enclosed sunroom
- Split floor plan
- Shaded yard
Tags
Property features AI
Finance
- Other: Manager approval required for multi-unit aspects; Pets: call for details
- Financial info: Land lease of $750 per month (park-provided); Rent includes trash
- HOA & community: Onsite property management; Senior community; Park name: Lake Vista; Community features include biking
Exterior
- Parking: Attached carport; Has parking
- Utilities: Electricity connected (standard); Public/district water; Septic tank
- Home design: Single-story mobile home (12' x 56'); Mobile home remains on site; One-level layout; Front-facing entry
- Construction: Year built: other (source indicates other)
- Exterior features: Covered, enclosed patio; Outdoor lighting; Storage shed; Association pool
Interior
- Kitchen: Refrigerator; Dishwasher; Laminate counters
- Bedrooms: Single-story home (entry level 1)
- Flooring: Vinyl flooring; Carpet
- Bathrooms: 2 full bathrooms; Bathtub and shower-in-tub
- Heating & cooling: Forced air heating; Evaporative cooling
- Interior features: Ceiling fan; Double-pane windows; Front entry
- Laundry & utility: Washer included; Dryer included; Laundry available
Neighborhood map
What this means for you Summary
Snapshot
- This is a 2-bed/1.0-bath manufactured listed at $36k.
Deal economics
- At list price, monthly cash flow is $939 ($11k/yr) — positive.
- The deal already cash-flows at list — no discount required.
- Meets the 1% rule at list price ($1k rent vs $36k).
- Recommended offer: $31k (12.0% below list) — sets the bar for market timing.
- Cap rate 38.0% vs local median 3.8% in Palermo — top-decile yield for the area; either an underpriced asset or a hidden risk that comps aren't pricing in. Stress-test before assuming the spread holds.
Location & tenants
- Location reads 48/100 on livability (#1,219 in CA) — a working-class tenant base; expect higher turnover. Strengths: housing B+; Watch: crime F, amenities F, commute F.
- Palermo Union Elementary (town): math 20% / reading 33% proficiency, ranked #1,149 of 1,400 in CA (top 82%) — low school quality limits family demand, transient renter base, plan for 1-2y turnover; 72% free/reduced lunch — lower-income household profile, screen leases tightly.
- Zoned schools: Helen M. Wilcox Elementary (516 students, 83% FRL); Palermo (404 students, 78% FRL); Las Plumas High (math 17% / reading 52%, grade F, #618 of 1,170 statewide, top 56%, 1,287 students, 76% FRL).
- Market conditions: 376 active listings in the ZIP; 946 units permitted in Butte County in 2024 (254 in 5+ unit buildings).
Forward outlook
- Local home prices are declining (-3.0%/yr); year-one equity from $245 of loan paydown is wiped out by about $1k of value loss. Plan a longer hold.
- Butte County population projected at +10% by 2050 — modest demand growth; plan on rents tracking national, not racing it.
- At projected returns (-3.0% appreciation + 3.0% rent growth), your $10k cash investment doubles in ~1 year — after that, you're playing with house money.
Negotiation context
- It's been on market 145 days — a 12% lower offer ($31k) is reasonable based on typical stale-listing flexibility.
- 4 sale attempts since 17y ago; this cycle's ask is 9% above the opening price — seller raised mid-cycle; expect resistance to lowballs.
- Current owner paid $8k; list at $36k implies a 344% gain — meaningful room to come down on a strong offer.
Risks & watch-outs
- Climate carrying-cost: severe wildfire risk; extreme-heat days projected 7→15/yr by 2055 (HVAC capex compounding) — expect insurance premiums to compound above CPI over the hold.
Questions for the listing agent
- It's been on market 145 days. Have you received any prior offers? Is the seller open to a 12% concession, seller financing, or rate buy-down credit?
- Built in 1978 — when were the roof, HVAC, electrical panel, plumbing, and water heater last replaced?
- Why hasn't it sold? Are there any deal-killer items the seller is aware of (foundation, flood, title, zoning, code violations)?
- Is there a deadline driving the sale (1031 exchange, divorce, estate, relocation)? That informs how much negotiation room exists.
- Schools are F-rated, which usually means shorter tenancies and higher turnover. Who's the typical renter profile here, and what's been the actual vacancy rate?
- Crime grade is F in this area — have there been break-ins, vandalism, or insurance claims at this property in the last 3 years? What carrier currently insures it and at what premium?
- What's the average days-on-market for RENTAL listings here right now (not sales)? A rising rental-DOM trend means longer vacancies and softer asking-rent achievability than the comps imply.
- What's the recent tenant-quality profile in this submarket — average credit score on applications, eviction rate, late-payment / NSF rate, and stable-employment percentage? A property-management company in the area should have these aggregated.
- How much new for-sale + rental construction is in the pipeline within 1–3 miles? Heavy new supply typically softens prices + rents 12–24 months out; constrained supply supports both.
Investment metrics
- 1% rule
- 4.16% ✓
- Cap rate
- 38.02%
- Cash-on-cash
- 113.30%
- DSCR
- 6.04
- GRM
- 2.0
CMA / ARV
- ARV (on-the-fly)
- $15,834
- Comps found
- 3
Show comp detail 3 sales within ~0.75 mi
| Address | Dist | Beds/Ba | Sqft | Sold | Price | $/sf | Match |
|---|---|---|---|---|---|---|---|
| 6368 Lincoln Blvd #33 | 0.06mi | 1/1.0 (-1) | 753 (-0%) | 14mo | $17,000 | $23 | 80 |
| 6368 Lincoln Blvd #28 | 0.06mi | 2/1.0 | 816 (+8%) | 5mo | $17,000 | $21 | 80 |
| 6580 Lincoln #20 | 0.14mi | 2/1.0 | 720 (-4%) | 21mo | $8,500 | $12 | 69 |
Match score weights: distance 35% · size 25% · config 20% · recency 20%. Top-matched comps best support the ARV.
Projected returns pro-forma
-3.0% appreciation · 3.0% rent growth · sell at horizon
- IRR
- —
- Equity multiple
- 6.44×
- Total profit
- $54,034
- Equity at exit
- $5,293
- IRR
- —
- Equity multiple
- 13.48×
- Total profit
- $124,067
- Equity at exit
- $3,069
Cash invested: $9,940 (down + closing). Projections, not guarantees.
Landlord ↔ Tenant lean methodology
- Overall (STATE)
- 18 Strongly Tenant-Friendly
- State California
- 18 Strongly Tenant-Friendly · D+13
- County
- — inherits STATE
- City
- — inherits STATE
ZIP-level market 95966
- Active inventory
- 376
- Price-to-rent
- 2.0×
Monthly cashflow live
- Estimated rent
- $1,476 medium interval (Pro) →
- Mortgage (P&I)
- −$186
- Tax from tax record
- −$27 /mo · $318/yr
- Insurance
- −$15
- HOA
- −$0
- Vacancy / Maint / Mgmt
- −$310
- Net cashflow
- $939
Break-even live
Sensitivity live
| Price | -10% $959 | -5% $949 | +0% $939 | +5% $928 | +10% $918 |
|---|---|---|---|---|---|
| Rent | -10% $822 | -5% $880 | +0% $939 | +5% $997 | +10% $1,055 |
| Rate | -1.0pp $956 | -0.5pp $948 | base $939 | +0.5pp $929 | +1.0pp $920 |
UW: 25.0% down · 7.5% · 30yr · 1.5% tax · 5.0% vac · 8.0% maint · 8.0% mgmt
Financing live
Cash to close
- Down payment
- $8,875
- Closing costs
- $1,065
- Reserves months
- —
- Total cash needed
- —
Loan-product check · same deal, 3 products live
Conventional
25% down · 7.5% · 30yr
- Down + closing
- —
- Monthly P&I
- —
- Monthly cashflow
- —
- DSCR
- —
- Eligible?
- —
Personal DTI + credit; lowest rate.
DSCR
20% down · 8.5% · 30yr
- Down + closing
- —
- Monthly P&I
- —
- Monthly cashflow
- —
- DSCR
- —
- Eligible?
- —
No personal income docs; deal must DSCR.
Hard money
10% down · 12.0% · 12mo
- Down + closing
- —
- Monthly P&I
- —
- Monthly cashflow
- —
- DSCR
- —
- Eligible?
- —
Short-term bridge; refi at stabilization.
Listing history 28 events
-
2026-06-22days on market $35,500 Active 145 DOM
-
2026-06-19days on market $35,500 Active 143 DOM
-
2026-06-18days on market $35,500 Active 142 DOM
-
2026-06-17days on market $35,500 Active 141 DOM
-
2026-06-16days on market $35,500 Active 140 DOM
-
2026-06-15days on market $35,500 Active 139 DOM
-
2026-06-14days on market $35,500 Active 137 DOM
-
2026-06-13days on market $35,500 Active 136 DOM
-
2026-06-10days on market $35,500 Active 134 DOM
-
2026-06-09days on market $35,500 Active 133 DOM
-
2026-06-08days on market $35,500 Active 132 DOM
-
2026-06-07days on market $35,500 Active 131 DOM
-
2026-06-05days on market $35,500 Active 128 DOM
-
2026-06-02days on market $35,500 Active 126 DOM
-
2026-06-01days on market $35,500 Active 125 DOM
-
2026-05-31days on market $35,500 Active 124 DOM
-
2026-05-30days on market $35,500 Active 123 DOM
-
2026-05-07price $35,500
-
2026-03-20price $35,900
-
2026-01-27$32,500 Active
-
2026-01-20historical
-
2025-10-23price $32,500
-
2025-09-10$35,000 Active
-
2025-07-31historical
-
2025-06-26price $37,500
-
2025-04-15$41,500 Active
-
2009-12-30soldstatus $8,000
-
2009-11-02$10,000
ⓘ Source: listings_history table (triggers on properties + properties_extension) + one-shot
backfill from property_details.listing_events for pre-trigger history.
Tax reassessment forecast CA · Resets to sale price
- Current annual tax
- $318 · $27/mo
- Projected year-2 tax
- $318 · $27/mo
- Expected delta
- $0/yr ($0/mo · 0.0%)
ⓘ Screening estimate from a state-policy table — verify with the county assessor before closing.
Climate risk First Street
- Flood 1/10 Low FEMA zone X (unshaded) · 0% chance over 30 yrs
- Wildfire 10/10 Extreme
- Heat 7/10 Severe 7 d/yr ≥105°F today · 15 d/yr by 30 yrs out
- Wind 1/10 Low
- Air quality 10/10 Extreme 34 unhealthy d/yr today · 39 by 30 yrs out
Nearby sold comps map
Loading sold comps map…
Walkable amenities ~0.75 mi
Loading nearby amenities…
Taxation est. · year 1
- Rental income
- $17,711
- − Mortgage interest
- −$1,989
- − Property taxes
- −$318
- − Insurance
- −$178
- − Repairs & maintenance
- −$1,417
- − Management
- −$1,417
- − Depreciation
- −$1,033
- Taxable income
- $11,361
- Est. tax owed @ 24.0%
- −$2,727
- After-tax cash flow
- $8,536/yr
For passive investors: Depreciation is non-cash, so a rental often shows a tax loss while cash-flowing — sheltering income. Rental losses are passive: they offset passive income freely, and up to $25,000/yr can offset ordinary (W-2) income if you actively participate and your MAGI is under $100k (phasing out to $0 by $150k); unused losses carry forward. On sale, claimed depreciation is recaptured at up to 25%, and gains may owe capital-gains tax (a 1031 exchange can defer both). Figures are a year-1 estimate at your 24.0% rate — not tax advice; consult a CPA.
Schools (NCES district)
- District
- Palermo Union Elementary
- NCES district ID
- 0629540
- Math proficiency
- 20% ▲ 1.00%
- Reading proficiency
- 33% ▬ 0.00%
- Median HH income
- $39,628
- Composite
- 25.26/100
- National rank
- #12903
- State rank
- #1149 of 1400 in CA
Livability — Palermo
- Score
- 48/100
- State rank
- #1219
- US rank
- #26161
Category grades
Schools grade is shown separately in the Schools card above.
Census & demographics
- Census place
- Palermo, CA
- County
- Butte County · 175,030 people
- City population
- 1,346
- Metro
- Chico, CA
- Population (ZIP)
- 28,503
- Household income
- $65,586
- Rent vs Own
- Severe rent burden
- 807.0
Population outlook (Butte County) Hauer SSP2
- Today (2025)
- 237,527 people
- By 2030
- 243,804 · +2.6%
- By 2040
- 253,899 · +6.9%
- By 2050
- 262,561 · +10.5%
- By 2075
- 283,709 · +19.4%
- By 2100
- 282,689 · +19.0%
Race, ethnicity, and origin ACS 2023
- Neighborhood character
- Predominantly White (67%)
- Race & ethnicity
- White 67% Hispanic / Latino 18% Two or more races 14% Asian 6% Native American 2% Black 2%
- Hispanic origin (detail)
- Mexican 16%
- Common ancestry
- Lithuanian 3% Slovak 3% Portuguese 2%
- Foreign-born
- 6% · Canada
- Languages at home
- 88% English-only · Spanish 7% Other Asian/Pacific 3% Russian/Polish/Slavic 1%
Political lean MEDSL · Butte
- 2024 margin
- Toss-up / Even · D 46.8% · R 49.9% · Other 3.3%
- 2008→2024 swing
- -5.5pp toward R · 2008: 2.4pp · 2024: -3.1pp
- All cycles
- 2024: R+3.1 2020: D+1.7 2016: R+4.0 2012: R+3.9 2008: D+2.4
Not yet ingested
- Civics
- —
Market trends
- HPI YoY
- ▼ -284.58%
- Current HPI
- 267.1415
- Rent YoY
- —
- Metro
- Chico, CA
- State GDP YoY
- ▲ 3.21%
- F500 in state
- 116
Industry mix (Fortune 500 HQ in CA)
| Industry | F500 HQs | Revenue |
|---|---|---|
| Technology | 27 | $1,492B |
|
||
| Financial Services | 3 | $174B |
|
||
| Retail | 3 | $44B |
|
||
| Insurance | 3 | $26B |
|
||
| Media / Entertainment | 2 | $115B |
|
||
| Pharmaceuticals / Biotech | 2 | $62B |
|
||
Price history
+255.0% since first listed11 events — show timeline
- 2026-05-07 Price Changed $35,500 CRMLS
- 2026-03-20 Price Changed $35,900 CRMLS
- 2026-01-27 Listed $32,500 CRMLS
- 2026-01-20 Listing Removed — CRMLS
- 2025-10-23 Price Changed $32,500 CRMLS
- 2025-09-10 Listed $35,000 CRMLS
- 2025-07-31 Listing Removed — CRMLS
- 2025-06-26 Price Changed $37,500 CRMLS
- 2025-04-15 Listed $41,500 CRMLS
- 2009-12-30 Sold (MLS) $8,000 CRMLS
- 2009-11-02 Listed $10,000 CRMLS
Property tax history
+29.9%/yrLatest (2025): $318 · +856.6% YoY. Source: county tax records.
Cash-flow waterfall
monthlySold comps — $/sqft
last 12 mo · ≤1 miLoading sold comps…