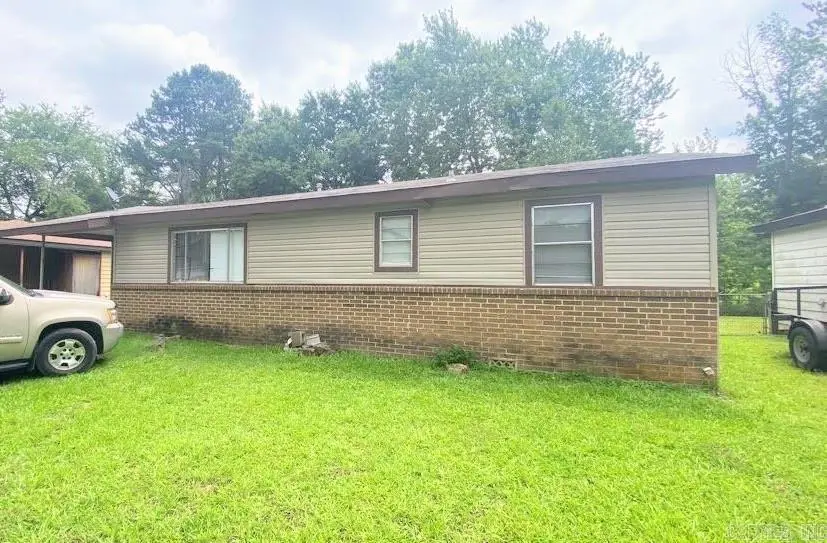
217 Cherry St · Jacksonville, AR
Flood risk 1/10 · Minimal
- FEMA flood zone
- X (unshaded)
- Chance of flooding over 30 yrs
- 0.0%
- Est. flood insurance / yr
- $507 – $1,088
Fire risk 3/10 · Minor
- Est. fire insurance / yr
- $1,499 – $2,785
Heat risk 6/10 · Moderate
- Hot days now (above 110°F)
- 7 days/yr
- Hot days in 30 yrs
- 18 days/yr
Wind risk 3/10 · Minor
- Chance of severe wind over 30 yrs
- 8.0%
Air-quality risk 2/10 · Minimal
- Unhealthy air days now
- 1 days/yr
- Unhealthy air days in 30 yrs
- 2 days/yr
Risk factors via First Street. Map © Google.
Why this score? — see what drove the B- grade
The composite is a weighted blend of 9 inputs, each scored 0–100. Each bar is that input's sub-score; the figure is the points it added to the 100-point composite (weight × sub-score).
- Cash flow +30.0/30.0
- 1% rule +10.0/10.0
- DSCR +10.0/10.0
- ARV discount +7.5/15.0
- Rent growth +3.3/5.0
- Livability +3.1/5.0
- Condition / age +2.5/5.0
- Schools +1.7/10.0
- Appreciation +0.0/10.0
$55,000
🖨 Deal sheet 📄 Offer letter ✓ Due diligence
Listing remarks MLS
This 3 bedroom home is a great investment property (has been rented by current tenants for over 10 years) or a good starter home. New water heater, new bathroom floors, roof is only 3 years old, HVAC installed in 2008, new back steps, up to date termite policy, and more! Close to local shopping and LRAFB. Call for more information or to schedule your private tour today! Agents see remarks.
Key facts
- 8,276 sq ft lot
- Built 1965
- Listed 3 days
Property features AI
Finance
- Other: Approx. 1,020 finished area; Approx. 0.19 acre lot (per tax records)
Exterior
- Parking: Carport
- Utilities: Public sewer; Municipal electric (Entergy); Natural gas
- Home design: Brick and metal/vinyl siding exterior
- Construction: Composition roof; Crawl space foundation
- Exterior features: Level lot; Paved road frontage
Interior
- Kitchen: Free-standing stove
- Flooring: Carpet; Laminate
- Bathrooms: 1 full bathroom
- Heating & cooling: Central gas heat; Central electric cooling
- Interior features: Carpet and laminate flooring; Free-standing stove
Neighborhood map
What this means for you Summary
Snapshot
- This is a 3-bed/1.5-bath single-family listed at $55k.
Deal economics
- At list price, monthly cash flow is $558 ($7k/yr) — positive.
- The deal already cash-flows at list — no discount required.
- Meets the 1% rule at list price ($1k rent vs $55k).
- Cap rate 18.5% vs local median 5.0% in Jacksonville — top-decile yield for the area; either an underpriced asset or a hidden risk that comps aren't pricing in. Stress-test before assuming the spread holds.
Location & tenants
- Location reads 61/100 on livability (#231 in AR) — a middle-class / working-renter tenant base. Strengths: cost of living A+, housing A+, health & safety A+; Watch: schools F, crime F, amenities F.
- Jacksonville North Pulaski School District (suburban): math 18% / reading 20% proficiency, ranked #211 of 238 in AR (top 89%) — low school quality limits family demand, transient renter base, plan for 1-2y turnover; 66% free/reduced lunch — lower-income household profile, screen leases tightly.
- Market conditions: Rents rising (+3.1%/yr); 154 active listings in the ZIP; 40 comparable units currently listed for rent nearby; rentals at typical pace (median 23d on market — plan ~3-4 weeks tenant-placement turnaround); 1,006 units permitted in Pulaski County in 2024 (0 in 5+ unit buildings).
Forward outlook
- Local home prices are declining (-3.0%/yr); year-one equity from $380 of loan paydown is wiped out by about $2k of value loss. Plan a longer hold.
- Pulaski County population projected at +6% by 2050 — modest demand growth; plan on rents tracking national, not racing it.
- At projected returns (-3.0% appreciation + 3.1% rent growth), your $15k cash investment doubles in ~3 years — after that, you're playing with house money.
Negotiation context
- Only 3 days on market — expect competitive offers; lowballing is unlikely to land.
- 7 sale attempts since 13y ago with the ask held roughly flat each time — persistent listings suggest the price (not the market) is what's stuck; bring a comps-based counter.
Risks & watch-outs
- Climate carrying-cost: extreme-heat days projected 7→18/yr by 2055 (HVAC capex compounding) — expect insurance premiums to compound above CPI over the hold.
Questions for the listing agent
- Built in 1965 — when were the roof, HVAC, electrical panel, plumbing, and water heater last replaced?
- Is there a deadline driving the sale (1031 exchange, divorce, estate, relocation)? That informs how much negotiation room exists.
- Schools are F-rated, which usually means shorter tenancies and higher turnover. Who's the typical renter profile here, and what's been the actual vacancy rate?
- Crime grade is F in this area — have there been break-ins, vandalism, or insurance claims at this property in the last 3 years? What carrier currently insures it and at what premium?
- What's the average days-on-market for RENTAL listings here right now (not sales)? A rising rental-DOM trend means longer vacancies and softer asking-rent achievability than the comps imply.
- What's the recent tenant-quality profile in this submarket — average credit score on applications, eviction rate, late-payment / NSF rate, and stable-employment percentage? A property-management company in the area should have these aggregated.
- How much new for-sale + rental construction is in the pipeline within 1–3 miles? Heavy new supply typically softens prices + rents 12–24 months out; constrained supply supports both.
Investment metrics
- 1% rule
- 2.14% ✓
- Cap rate
- 18.47%
- Cash-on-cash
- 43.50%
- DSCR
- 2.94
- GRM
- 3.9
CMA / ARV
- ARV (on-the-fly)
- $126,480
- Comps found
- 12
Show comp detail 12 sales within ~0.75 mi
| Address | Dist | Beds/Ba | Sqft | Sold | Price | $/sf | Match |
|---|---|---|---|---|---|---|---|
| 217 Cherry St | 0.00mi | 3/1.0 | 1,020 (0%) | 0mo | $38,000 | $37 | 98 |
| 212 Cherry St | 0.03mi | 3/1.5 | 1,031 (+1%) | 1mo | $127,900 | $124 | 96 |
| 11 Cherry Ct | 0.18mi | 3/1.0 | 1,032 (+1%) | 4mo | $123,000 | $119 | 84 |
| 221 Pearl St | 0.34mi | 3/1.0 | 944 (-8%) | 6mo | $93,000 | $99 | 64 |
| 108 Spruce St | 0.25mi | 3/2.0 | 1,159 (+14%) | 0mo | $172,934 | $149 | 63 |
| 99 Bellevue Cir | 0.62mi | 3/1.5 | 1,056 (+4%) | 2mo | $139,000 | $132 | 63 |
| 209 Northeastern Ave | 0.65mi | 3/1.0 | 960 (-6%) | 2mo | $100,000 | $104 | 56 |
| 626 Paul Pl | 0.68mi | 3/1.5 | 1,076 (+6%) | 4mo | $136,499 | $127 | 56 |
| 802 Towering Oaks Dr | 0.73mi | 3/1.5 | 1,076 (+6%) | 2mo | $90,000 | $84 | 55 |
| 1305 Ray Rd | 0.73mi | 3/1.5 | 1,076 (+6%) | 3mo | $139,900 | $130 | 54 |
| 601 Vine St | 0.70mi | 3/1.0 | 1,107 (+8%) | 4mo | $126,000 | $114 | 48 |
| 810 N Bailey Blvd | 0.72mi | 3/1.5 | 1,150 (+13%) | 1mo | $147,000 | $128 | 44 |
Match score weights: distance 35% · size 25% · config 20% · recency 20%. Top-matched comps best support the ARV.
Projected returns pro-forma
-3.0% appreciation · 3.07% rent growth · sell at horizon
- IRR
- 40.5%
- Equity multiple
- 2.74×
- Total profit
- $26,738
- Equity at exit
- $8,201
- IRR
- 46.8%
- Equity multiple
- 5.51×
- Total profit
- $69,455
- Equity at exit
- $4,755
Cash invested: $15,400 (down + closing). Projections, not guarantees.
Landlord ↔ Tenant lean methodology
- Overall (STATE)
- 92 Strongly Landlord-Friendly
- State Arkansas
- 92 Strongly Landlord-Friendly · R+14
- County
- — inherits STATE
- City
- — inherits STATE
ZIP-level market 72076
- Home prices YoY
- -30.3%
- Rents YoY
- 3.1%
- Active inventory
- 154
- Price-to-rent
- 3.9×
Monthly cashflow live
- Estimated rent
- $1,175 high interval (Pro) →
- Mortgage (P&I)
- −$288
- Tax from tax record
- −$59 /mo · $708/yr
- Insurance
- −$23
- HOA
- −$0
- Vacancy / Maint / Mgmt
- −$247
- Net cashflow
- $558
Break-even live
UW: 25.0% down · 7.5% · 30yr · 1.5% tax · 5.0% vac · 8.0% maint · 8.0% mgmt
Financing live
Cash to close
- Down payment
- $13,750
- Closing costs
- $1,650
- Reserves months
- —
- Total cash needed
- —
Loan-product check · same deal, 3 products live
Conventional
25% down · 7.5% · 30yr
- Down + closing
- —
- Monthly P&I
- —
- Monthly cashflow
- —
- DSCR
- —
- Eligible?
- —
Personal DTI + credit; lowest rate.
DSCR
20% down · 8.5% · 30yr
- Down + closing
- —
- Monthly P&I
- —
- Monthly cashflow
- —
- DSCR
- —
- Eligible?
- —
No personal income docs; deal must DSCR.
Hard money
10% down · 12.0% · 12mo
- Down + closing
- —
- Monthly P&I
- —
- Monthly cashflow
- —
- DSCR
- —
- Eligible?
- —
Short-term bridge; refi at stabilization.
Rent comps 40 comps
| Address | Beds | Baths | Sqft | Rent | $/sqft | DOM | Units | Dist |
|---|---|---|---|---|---|---|---|---|
| 428 N Oak St Jacksonville, AR | 3.0 | 1.5 | 996 | $1,325 | $1.33 | 43d | 1 | 0.12mi |
| 107 Pike Ave Jacksonville, AR | 3.0 | 1.0 | 1092 | $995 | $0.91 | 43d | 1 | 0.27mi |
| 308 N Oak St Jacksonville, AR | 2.0 | 1.0 | 788 | $800 | $1.02 | 14d | 1 | 0.28mi |
| 241 Pearl St Jacksonville, AR | 2.0 | 1.0 | 700 | $943 | $1.35 | 23d | 1 | 0.37mi |
| 873 Jane Dr Jacksonville, AR | 2.0 | 1.0 | 971 | $1,050 | $1.08 | 43d | 1 | 0.42mi |
| 131 Galloway Cir Jacksonville, AR | 3.0 | 1.0 | 912 | $895 | $0.98 | 43d | 1 | 0.45mi |
| 144 Pike Ave Jacksonville, AR | 2.0 | 1.0 | 1050 | $800 | $0.76 | 44d | 1 | 0.50mi |
| 1501 Angie Ct Jacksonville, AR | 3.0 | 2.0 | 1296 | $1,595 | $1.23 | 21d | 1 | 0.54mi |
| 105 Victory Cir Jacksonville, AR | 4.0 | 2.0 | 1157 | $1,550 | $1.34 | 43d | 1 | 0.54mi |
| 212 Wright Cv Jacksonville, AR | 3.0 | 1.5 | 1326 | $1,350 | $1.02 | 23d | 1 | 0.55mi |
| 172 Roosevelt Rd Jacksonville, AR | 2.0 | 1.0 | 1000 | $800 | $0.80 | 21d | 1 | 0.56mi |
| 197 Roosevelt Rd Jacksonville, AR | 3.0 | 1.0 | 1300 | $1,195 | $0.92 | 19d | 1 | 0.56mi |
| 130 Joiner Ave Jacksonville, AR | 4.0 | 2.0 | 1223 | $1,550 | $1.27 | 21d | 1 | 0.58mi |
| 89 Belair Loop Jacksonville, AR | 3.0 | 2.0 | 1093 | $1,450 | $1.33 | 21d | 1 | 0.58mi |
| 58 Wright Cir Jacksonville, AR | 4.0 | 2.5 | 1468 | $1,450 | $0.99 | 14d | 1 | 0.59mi |
| 66 Wright Cir Jacksonville, AR | 3.0 | 2.0 | 1246 | $1,595 | $1.28 | 23d | 1 | 0.60mi |
| 633 Smart St Jacksonville, AR | 3.0 | 1.5 | 936 | $995 | $1.06 | 23d | 1 | 0.60mi |
| 1115 Ray Rd Jacksonville, AR | 4.0 | 1.5 | 1495 | $1,495 | $1.00 | 14d | 1 | 0.66mi |
| 1112 Ray Rd Jacksonville, AR | 3.0 | 1.0 | 1166 | $895 | $0.77 | 43d | 1 | 0.69mi |
| 124 Karen Cv Jacksonville, AR | 4.0 | 1.5 | 1000 | $1,050 | $1.05 | 43d | 1 | 0.76mi |
| 1409 Southern St Jacksonville, AR | 3.0 | 1.0 | 1050 | $1,050 | $1.00 | 43d | 1 | 0.77mi |
| 516 Hill St Jacksonville, AR | 3.0 | 1.5 | 1380 | $1,175 | $0.85 | 43d | 1 | 0.80mi |
| 609 Sorrells Dr Jacksonville, AR | 3.0 | 1.0 | 1133 | $1,195 | $1.05 | 14d | 1 | 0.84mi |
| 622 S Oak St Unit 620 Jacksonville, AR | 2.0 | 1.5 | 1015 | $725 | $0.71 | 23d | 1 | 0.85mi |
| 714 S Spring St Unit 718 Jacksonville, AR | 2.0 | 2.0 | 1000 | $1,150 | $1.15 | 23d | 1 | 0.87mi |
| 712 W Martin St Jacksonville, AR | 2.0 | 1.0 | 936 | $995 | $1.06 | 43d | 1 | 0.88mi |
| 1811 Neely St Unit 1811 Jacksonville, AR | 3.0 | 1.0 | 996 | $825 | $0.83 | 43d | 1 | 0.89mi |
| 218 S J P Wright Loop Rd Unit 6 Jacksonville, AR | 2.0 | 2.0 | 760 | $850 | $1.12 | 21d | 1 | 0.89mi |
| 620 Neal St Jacksonville, AR | 3.0 | 1.0 | 900 | $895 | $0.99 | 43d | 1 | 0.90mi |
| 1301 Liberty Dr Jacksonville, AR | 3.0 | 2.0 | 1014 | $1,295 | $1.28 | 14d | 1 | 0.91mi |
| 708 Lehman Dr Jacksonville, AR | 3.0 | 1.5 | 1075 | $1,150 | $1.07 | 14d | 1 | 0.95mi |
| 950 Military Rd Jacksonville, AR | 1.0–3.0 | 1.0–2.0 | 867 | $1,015 | $1.17 | 14d | 13 | 1.02mi |
| 103 Overland Trl Jacksonville, AR | 3.0 | 1.5 | 960 | $1,195 | $1.24 | 19d | 1 | 1.03mi |
| 1101 Lehman Dr Jacksonville, AR | 3.0 | 1.5 | 1344 | $1,200 | $0.89 | 14d | 1 | 1.07mi |
| 4 Georgeann Cir Jacksonville, AR | 3.0 | 1.5 | 1479 | $1,250 | $0.85 | 14d | 1 | 1.12mi |
| 200 Crestview Dr Unit 9 Jacksonville, AR | 2.0 | 1.5 | 900 | $900 | $1.00 | 43d | 1 | 1.15mi |
| 7 Davis Ct Jacksonville, AR | 3.0 | 1.5 | 1080 | $925 | $0.86 | 43d | 1 | 1.19mi |
| 1011 S James St Unit 02-2G Jacksonville, AR | 2.0 | 1.0 | 858 | $765 | $0.89 | 23d | 1 | 1.22mi |
| 1011 S James St Jacksonville, AR | 2.0 | 1.0 | 858 | $765 | $0.89 | 14d | 1 | 1.22mi |
| 1110 Heather St Unit B Jacksonville, AR | 2.0 | 1.0 | 858 | $835 | $0.97 | 23d | 1 | 1.29mi |
Listing history 4 events
-
2026-06-09status $55,000 Under Contract 3 DOM
-
2026-06-08days on market $55,000 New Listing 3 DOM
-
2026-06-07remarks 142-char remark
-
2026-06-07$55,000 New Listing 2 DOM
ⓘ Source: listings_history table (triggers on properties + properties_extension) + one-shot
backfill from property_details.listing_events for pre-trigger history.
Tax reassessment forecast AR · Resets to sale price
- Current annual tax
- $708 · $59/mo
- Projected year-2 tax
- $708 · $59/mo
- Expected delta
- $0/yr ($0/mo · 0.0%)
ⓘ Screening estimate from a state-policy table — verify with the county assessor before closing.
Climate risk First Street
- Flood 1/10 Low FEMA zone X (unshaded) · 0% chance over 30 yrs
- Wildfire 3/10 Moderate
- Heat 6/10 Major 7 d/yr ≥110°F today · 18 d/yr by 30 yrs out
- Wind 3/10 Moderate 8% chance of damaging wind over 30 yrs
- Air quality 2/10 Low 1 unhealthy d/yr today · 2 by 30 yrs out
Nearby sold comps map
Loading sold comps map…
Walkable amenities ~0.75 mi
Loading nearby amenities…
Taxation est. · year 1
- Rental income
- $14,105
- − Mortgage interest
- −$3,081
- − Property taxes
- −$708
- − Insurance
- −$275
- − Repairs & maintenance
- −$1,128
- − Management
- −$1,128
- − Depreciation
- −$1,600
- Taxable income
- $6,185
- Est. tax owed @ 24.0%
- −$1,484
- After-tax cash flow
- $5,215/yr
For passive investors: Depreciation is non-cash, so a rental often shows a tax loss while cash-flowing — sheltering income. Rental losses are passive: they offset passive income freely, and up to $25,000/yr can offset ordinary (W-2) income if you actively participate and your MAGI is under $100k (phasing out to $0 by $150k); unused losses carry forward. On sale, claimed depreciation is recaptured at up to 25%, and gains may owe capital-gains tax (a 1031 exchange can defer both). Figures are a year-1 estimate at your 24.0% rate — not tax advice; consult a CPA.
Schools (NCES district)
- District
- Jacksonville North Pulaski School District
- NCES district ID
- 0500419
- Math proficiency
- 18% ▼ -7.00%
- Reading proficiency
- 20% ▼ -5.00%
- Median HH income
- $50,869
- Composite
- 17.16/100
- National rank
- #9110
- State rank
- #211 of 238 in AR
Livability — Jacksonville
- Score
- 61/100
- State rank
- #231
- US rank
- #17378
Category grades
Schools grade is shown separately in the Schools card above.
Census & demographics
- Census place
- Jacksonville, AR
- County
- Pulaski County · 372,764 people
- City population
- 38,437
- Metro
- Little Rock-North Little Rock-Conway, AR
- Population (ZIP)
- 38,437
- Household income
- $54,379
- Rent vs Own
- Severe rent burden
- 1733.0
Population outlook (Pulaski County) Hauer SSP2
- Today (2025)
- 415,378 people
- By 2030
- 423,720 · +2.0%
- By 2040
- 435,182 · +4.8%
- By 2050
- 440,904 · +6.1%
- By 2075
- 445,521 · +7.3%
- By 2100
- 419,173 · +0.9%
Race, ethnicity, and origin ACS 2023
- Neighborhood character
- Diverse neighborhood (Simpson 0.63)
- Race & ethnicity
- White 47% Black 38% Hispanic / Latino 8% Two or more races 8% Asian 1%
- Hispanic origin (detail)
- Mexican 6%
- Common ancestry
- Slovak 2% Italian 2% Serbian 1%
- Foreign-born
- 4% · Canada
- Languages at home
- 94% English-only · Spanish 4% Tagalog/Filipino 1%
Political lean MEDSL · Pulaski
- 2024 margin
- Strong D (+22.1) · D 59.8% · R 37.7% · Other 2.5%
- 2008→2024 swing
- +10.6pp toward D · 2008: 11.6pp · 2024: 22.1pp
- All cycles
- 2024: D+22.1 2020: D+22.5 2016: D+17.9 2012: D+11.4 2008: D+11.6
Not yet ingested
- Civics
- —
Market trends
- HPI YoY
- ▼ -87.51%
- Current HPI
- 201.6405
- Rent YoY
- ▲ 3.07%
- Metro
- Little Rock-North Little Rock-Conway, AR
- State GDP YoY
- ▲ 3.80%
- F500 in state
- 10
Industry mix (Fortune 500 HQ in AR)
| Industry | F500 HQs | Revenue |
|---|---|---|
| Retail | 1 | $681B |
|
||
| Food / Agriculture | 1 | $53B |
|
||
| Retail / Energy | 1 | $22B |
|
||
| Transportation / Logistics | 1 | $12B |
|
||
| Energy | 1 | $4B |
|
||
Price history
+13.4% since first listed17 events — show timeline
- 2026-06-05 Listed $55,000 CARMLS
- 2021-09-03 Sold (Public Records) $67,500 Public Records
- 2021-08-31 Sold (MLS) $67,500 CARMLS
- 2021-08-02 Pending — CARMLS
- 2021-07-29 Relisted — CARMLS
- 2021-07-27 Contingent — CARMLS
- 2021-06-26 Listing Removed — CARMLS
- 2021-06-23 Listed $65,000 CARMLS
- 2016-01-08 Listing Removed — CARMLS
- 2015-07-09 Price Changed $39,900 CARMLS
- 2015-07-08 Listed $34,000 CARMLS
- 2015-06-13 Listing Removed — CARMLS
- 2015-06-03 Listed $43,500 CARMLS
- 2014-04-22 Listing Removed — CARMLS
- 2014-01-27 Listed $48,500 CARMLS
- 2014-01-23 Listing Removed — CARMLS
- 2013-07-22 Listed $48,500 CARMLS
Property tax history
+4.4%/yrLatest (2025): $708 · +0.0% YoY. Source: county tax records.
Cash-flow waterfall
monthlySold comps — $/sqft
last 12 mo · ≤1 miLoading sold comps…