1649 Capitan Ave · Las Cruces, NM
Flood risk 1/10 · Minimal
- FEMA flood zone
- X (unshaded)
- Chance of flooding over 30 yrs
- 0.0%
- Est. flood insurance / yr
- $507 – $1,088
Fire risk 3/10 · Minor
- Est. fire insurance / yr
- $706 – $1,312
Heat risk 6/10 · Moderate
- Hot days now (above 99°F)
- 6 days/yr
- Hot days in 30 yrs
- 21 days/yr
Wind risk 1/10 · Minimal
- Chance of severe wind over 30 yrs
- —
Air-quality risk 1/10 · Minimal
- Unhealthy air days now
- 0 days/yr
- Unhealthy air days in 30 yrs
- 0 days/yr
Risk factors via First Street. Map © Google.
Why this score? — see what drove the C+ grade
The composite is a weighted blend of 9 inputs, each scored 0–100. Each bar is that input's sub-score; the figure is the points it added to the 100-point composite (weight × sub-score).
- Cash flow +26.0/30.0
- DSCR +8.8/10.0
- ARV discount +7.5/15.0
- 1% rule +6.4/10.0
- Schools +4.6/10.0
- Rent growth +3.4/5.0
- Livability +3.0/5.0
- Condition / age +2.5/5.0
- Appreciation +0.0/10.0
$135,000
🖨 Deal sheet (PDF) 📄 Offer letter ✓ Due diligence
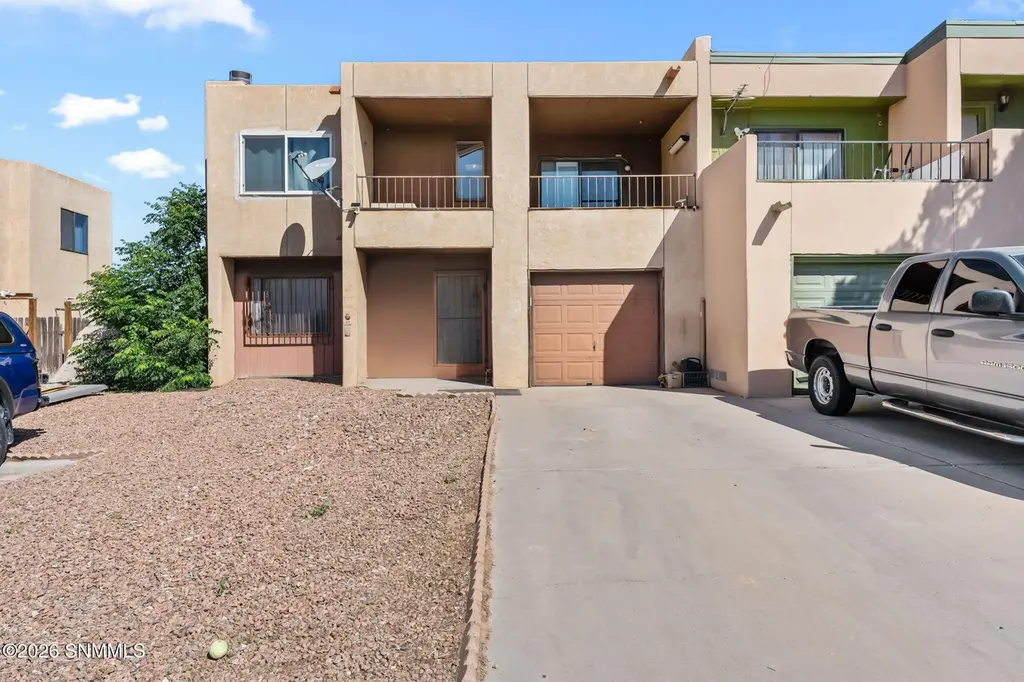
Listing remarks
Centrally located 3 bedroom, 2.5 bath townhouse with great potential! This fixer-upper offers a functional layout, attached garage, and low maintenace yard. conveniently located near shopping, dining, schools, and easy highway access. Perfect opportunity for buyers looking to add value and their own personal touch. Property is being sold AS-IS.
Key facts
- Low maintenance yard
- Attached garage
- Functional layout
Tags
Property features AI
Finance
- Other: Located in Villa Encantada Phase 3
Exterior
- Parking: 1-car garage
- Utilities: Public water; Public sewer; Natural gas available
- Home design: Townhouse; Two levels
- Construction: Frame and stucco construction; Slab foundation
- Exterior features: Chain link fencing
Interior
- Kitchen: Electric range; Refrigerator
- Bathrooms: 2 full bathrooms; 1 half bathroom
- Heating & cooling: Forced air heating; Evaporative cooling
- Interior features: Electric range; Refrigerator; Gas water heater
Neighborhood map
What this means for you Summary
Snapshot
- This is a 3-bed/3.0-bath townhouse listed at $135k.
Deal economics
- At list price, monthly cash flow is $338 ($4k/yr) — positive.
- The deal already cash-flows at list — no discount required.
- Meets the 1% rule at list price ($2k rent vs $135k).
Location & tenants
- Location reads 59/100 on livability (#120 in NM) — a working-class tenant base; expect higher turnover. Strengths: cost of living A+, housing A; Watch: amenities D+, crime F, commute F.
- Las Cruces Public Schools (urban): math 42% / reading 68% proficiency, ranked #5 of 29 in NM (top 17%) — acceptable for families but not a draw, mixed tenant base, ~2y average lease; 62% free/reduced lunch — lower-income household profile, screen leases tightly.
- Zoned schools: Hermosa Heights Elementary (401 students, 100% FRL); Sierra Middle (799 students, 100% FRL); Centennial High School (math 47% / reading 67%, grade C, #33 of 110 statewide, top 29%, 1,615 students, 0% FRL) — zoned schools at 67% FRL track the district average.
- Market conditions: Rents rising (+3.5%/yr); 145 active listings in the ZIP; 16 comparable units currently listed for rent nearby; rentals at typical pace (median 23d on market — plan ~3-4 weeks tenant-placement turnaround); lower-income renter base — watch delinquency; 964 units permitted in Doña Ana County in 2024 (0 in 5+ unit buildings).
- At $1,540/mo this rent would consume 56% of the median local household income ($33k/yr) (locally 2590% of renters already pay >50% of income on rent) — very limited rent-growth headroom before tenants either downsize or default.
Forward outlook
- Local home prices are declining (-3.0%/yr); year-one equity from $933 of loan paydown is wiped out by about $4k of value loss. Plan a longer hold.
- At projected returns (-3.0% appreciation + 3.5% rent growth), your $38k cash investment doubles in ~10 years — after that, you're playing with house money.
Negotiation context
- Only 2 days on market — expect competitive offers; lowballing is unlikely to land.
Risks & watch-outs
- Climate carrying-cost: extreme-heat days projected 6→21/yr by 2055 (HVAC capex compounding) — expect insurance premiums to compound above CPI over the hold.
Questions for the listing agent
- Built in 1979 — when were the roof, HVAC, electrical panel, plumbing, and water heater last replaced?
- Is there a deadline driving the sale (1031 exchange, divorce, estate, relocation)? That informs how much negotiation room exists.
- Schools are D-rated, which usually means shorter tenancies and higher turnover. Who's the typical renter profile here, and what's been the actual vacancy rate?
- Crime grade is F in this area — have there been break-ins, vandalism, or insurance claims at this property in the last 3 years? What carrier currently insures it and at what premium?
- What's the average days-on-market for RENTAL listings here right now (not sales)? A rising rental-DOM trend means longer vacancies and softer asking-rent achievability than the comps imply.
- What's the recent tenant-quality profile in this submarket — average credit score on applications, eviction rate, late-payment / NSF rate, and stable-employment percentage? A property-management company in the area should have these aggregated.
- How much new for-sale + rental construction is in the pipeline within 1–3 miles? Heavy new supply typically softens prices + rents 12–24 months out; constrained supply supports both.
Investment metrics
- 1% rule
- 1.14% ✓
- Cap rate
- 9.30%
- Cash-on-cash
- 10.72%
- DSCR
- 1.48
- GRM
- 7.3
CMA / ARV
No comps found within radius.
Projected returns pro-forma
-3.0% appreciation · 3.45% rent growth · sell at horizon
- IRR
- 0.2%
- Equity multiple
- 1.01×
- Total profit
- $328
- Equity at exit
- $20,129
- IRR
- 10.3%
- Equity multiple
- 1.82×
- Total profit
- $30,846
- Equity at exit
- $11,672
Cash invested: $37,800 (down + closing). Projections, not guarantees.
Landlord ↔ Tenant lean methodology
- Overall (STATE)
- 55 Moderately Landlord-Leaning
- State New Mexico
- 55 Moderately Landlord-Leaning · D+3
- County
- — inherits STATE
- City
- — inherits STATE
ZIP-level market 88001
- Rents YoY
- 3.5%
- Active inventory
- 145
- Price-to-rent
- 7.3×
Monthly cashflow live
- Estimated rent
- $1,540 high interval (Pro) →
- Mortgage (P&I)
- −$708
- Tax from tax record
- −$114 /mo · $1,373/yr
- Insurance
- −$56
- HOA
- −$0
- Vacancy / Maint / Mgmt
- −$323
- Net cashflow
- $338
Break-even live
Sensitivity live
| Price | -10% $414 | -5% $376 | +0% $338 | +5% $300 | +10% $261 |
|---|---|---|---|---|---|
| Rent | -10% $216 | -5% $277 | +0% $338 | +5% $399 | +10% $459 |
| Rate | -1.0pp $406 | -0.5pp $372 | base $338 | +0.5pp $303 | +1.0pp $267 |
UW: 25.0% down · 7.5% · 30yr · 1.5% tax · 5.0% vac · 8.0% maint · 8.0% mgmt
Financing live
Cash to close
- Down payment
- $33,750
- Closing costs
- $4,050
- Reserves months
- —
- Total cash needed
- —
Loan-product check · same deal, 3 products live
Conventional
25% down · 7.5% · 30yr
- Down + closing
- —
- Monthly P&I
- —
- Monthly cashflow
- —
- DSCR
- —
- Eligible?
- —
Personal DTI + credit; lowest rate.
DSCR
20% down · 8.5% · 30yr
- Down + closing
- —
- Monthly P&I
- —
- Monthly cashflow
- —
- DSCR
- —
- Eligible?
- —
No personal income docs; deal must DSCR.
Hard money
10% down · 12.0% · 12mo
- Down + closing
- —
- Monthly P&I
- —
- Monthly cashflow
- —
- DSCR
- —
- Eligible?
- —
Short-term bridge; refi at stabilization.
Rent comps 16 comps
| Address | Beds | Baths | Sqft | Rent | $/sqft | DOM | Units | Dist |
|---|---|---|---|---|---|---|---|---|
| 1000 Coyote Trl Las Cruces, NM | 3.0 | 2.0 | 1280 | $1,524 | $1.19 | 15d | 1 | 0.31mi |
| 1980 Buchanan Ave Las Cruces, NM | 3.0 | 2.0 | 1162 | $1,800 | $1.55 | 22d | 1 | 0.66mi |
| 2019 Evelyn St Las Cruces, NM | 3.0 | 2.0 | 1712 | $1,450 | $0.85 | 45d | 1 | 0.71mi |
| 1595 Carrillo Ct Unit A Las Cruces, NM | 3.0 | 2.0 | 1405 | $1,295 | $0.92 | 45d | 1 | 0.81mi |
| 2081 Nehemiah Ct Las Cruces, NM | 3.0 | 1.5 | 1380 | $1,700 | $1.23 | 22d | 1 | 0.82mi |
| 1151 Roadrunner Pkwy Apt 805 Las Cruces, NM | 2.0 | 2.0 | 1157 | $1,710 | $1.48 | 45d | 1 | 1.02mi |
| 1775 Roadrunner Pkwy Unit 2901 Las Cruces, NM | 2.0 | 2.0 | 1246 | $1,750 | $1.40 | 22d | 1 | 1.11mi |
| 1775 Roadrunner Pkwy Unit 2601 Las Cruces, NM | 3.0 | 2.0 | 1255 | $1,980 | $1.58 | 15d | 1 | 1.11mi |
| 2552 Los Misioneros Las Cruces, NM | 3.0 | 2.0 | 1466 | $1,450 | $0.99 | 22d | 1 | 1.12mi |
| 501 N Roadrunner Pkwy Las Cruces, NM | 1.0–2.0 | 1.0–2.5 | 1263 | $2,165 | $1.71 | 15d | 3 | 1.14mi |
| 2245 San Felipe Las Cruces, NM | 2.0 | 2.0 | 1340 | $1,450 | $1.08 | 45d | 1 | 1.18mi |
| 2242 Los Misioneros Las Cruces, NM | 3.0 | 2.0 | 1670 | $1,800 | $1.08 | 45d | 1 | 1.23mi |
| 251 N Roadrunner Pkwy Las Cruces, NM | 1.0–3.0 | 1.0–2.0 | 936 | $1,660 | $1.77 | 15d | 9 | 1.33mi |
| 169 Oban Ct Las Cruces, NM | 3.0 | 2.0 | 1289 | $1,350 | $1.05 | 15d | 1 | 1.37mi |
| 2711 Topley Ave Unit NA Las Cruces, NM | 3.0 | 2.0 | 1510 | $1,650 | $1.09 | 22d | 1 | 1.47mi |
| 2711 Topley Ave Las Cruces, NM | 3.0 | 2.0 | 1510 | $1,650 | $1.09 | 45d | 1 | 1.47mi |
Listing history 2 events
-
2026-05-15status Pending
-
2026-05-13$135,000 Active
ⓘ Source: listings_history table (triggers on properties + properties_extension) + one-shot
backfill from property_details.listing_events for pre-trigger history.
Tax reassessment forecast NM · Resets to sale price
- Current annual tax
- $1,373 · $114/mo
- Projected year-2 tax
- $1,373 · $114/mo
- Expected delta
- $0/yr ($0/mo · 0.0%)
ⓘ Screening estimate from a state-policy table — verify with the county assessor before closing.
Climate risk First Street
- Flood 1/10 Low FEMA zone X (unshaded) · 0% chance over 30 yrs
- Wildfire 3/10 Moderate
- Heat 6/10 Major 6 d/yr ≥99°F today · 21 d/yr by 30 yrs out
- Wind 1/10 Low
- Air quality 1/10 Low 0 unhealthy d/yr today · 0 by 30 yrs out
Nearby sold comps map
Loading sold comps map…
Walkable amenities ~0.75 mi
Loading nearby amenities…
Taxation est. · year 1
- Rental income
- $18,477
- − Mortgage interest
- −$7,562
- − Property taxes
- −$1,373
- − Insurance
- −$675
- − Repairs & maintenance
- −$1,478
- − Management
- −$1,478
- − Depreciation
- −$3,927
- Taxable income
- $1,983
- Est. tax owed @ 24.0%
- −$476
- After-tax cash flow
- $3,577/yr
For passive investors: Depreciation is non-cash, so a rental often shows a tax loss while cash-flowing — sheltering income. Rental losses are passive: they offset passive income freely, and up to $25,000/yr can offset ordinary (W-2) income if you actively participate and your MAGI is under $100k (phasing out to $0 by $150k); unused losses carry forward. On sale, claimed depreciation is recaptured at up to 25%, and gains may owe capital-gains tax (a 1031 exchange can defer both). Figures are a year-1 estimate at your 24.0% rate — not tax advice; consult a CPA.
Schools (NCES district)
- District
- Las Cruces Public Schools
- NCES district ID
- 3501500
- Math proficiency
- 42% ▲ 24.00%
- Reading proficiency
- 68% ▲ 35.00%
- Median HH income
- $41,157
- Composite
- 45.98/100
- National rank
- #2535
- State rank
- #5 of 29 in NM
Livability — Las Cruces
- Score
- 59/100
- State rank
- #120
- US rank
- #19687
Category grades
Schools grade is shown separately in the Schools card above.
Census & demographics
- Census place
- Las Cruces, NM
- County
- Dona Ana County · 144,044 people
- City population
- 131,421
- Metro
- Las Cruces, NM
- Population (ZIP)
- 37,690
- Household income
- $33,087
- Rent vs Own
- Severe rent burden
- 2590.0
Population outlook (Doña Ana County) Hauer SSP2
- Today (2025)
- 219,177 people
- By 2030
- 220,967 · +0.8%
- By 2040
- 222,775 · +1.6%
- By 2050
- 223,576 · +2.0%
- By 2075
- 228,461 · +4.2%
- By 2100
- 214,536 · -2.1%
Race, ethnicity, and origin ACS 2023
- Neighborhood character
- Predominantly Hispanic (72%)
- Race & ethnicity
- Hispanic / Latino 72% Two or more races 24% White 21% Black 3% Asian 2% Native American 2%
- Hispanic origin (detail)
- Mexican 59%
- Common ancestry
- Slovak 1% Italian 1% Romanian 1%
- Foreign-born
- 12% · Canada, South Korea
- Languages at home
- 56% English-only · Spanish 39% Other Indo-European 1% Other Asian/Pacific 1%
Political lean MEDSL · Doña Ana
- 2024 margin
- Lean D (+9.8) · D 53.8% · R 44.0% · Other 2.2%
- 2008→2024 swing
- -7.9pp toward R · 2008: 17.6pp · 2024: 9.8pp
- All cycles
- 2024: D+9.8 2020: D+18.3 2016: D+18.0 2012: D+14.9 2008: D+17.6
Not yet ingested
- Civics
- —
Market trends
- HPI YoY
- ▼ -239.44%
- Current HPI
- 219.0404
- Rent YoY
- ▲ 3.45%
- Metro
- Las Cruces, NM
- State GDP YoY
- —
- F500 in state
- 0
Price history
2 events — show timeline
- 2026-05-15 Pending — SNMMLS as distributed by MLS GRID
- 2026-05-13 Listed $135,000 SNMMLS as distributed by MLS GRID
Property tax history
+3.0%/yrLatest (2025): $1,373 · +2.4% YoY. Source: county tax records.
Cash-flow waterfall
monthlySold comps — $/sqft
last 12 mo · ≤1 miLoading sold comps…