 Triplex
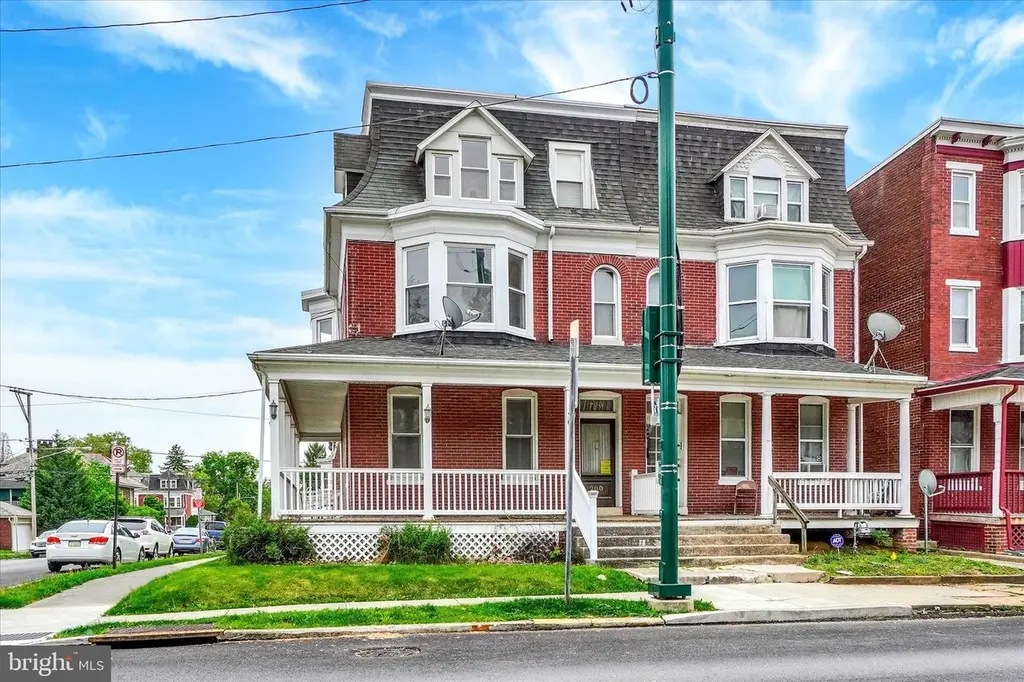
700 Pennsylvania Ave · York, PA
Flood risk 1/10 · Minimal
- FEMA flood zone
- X (unshaded)
- Chance of flooding over 30 yrs
- 0.0%
- Est. flood insurance / yr
- $473 – $860
Fire risk 1/10 · Minimal
- Est. fire insurance / yr
- $511 – $949
Heat risk 6/10 · Moderate
- Hot days now (above 103°F)
- 7 days/yr
- Hot days in 30 yrs
- 15 days/yr
Wind risk 4/10 · Minor
- Chance of severe wind over 30 yrs
- 11.0%
Air-quality risk 3/10 · Minor
- Unhealthy air days now
- 3 days/yr
- Unhealthy air days in 30 yrs
- 5 days/yr
Risk factors via First Street. Map © Google.
Why this score? — see what drove the C+ grade
The composite is a weighted blend of 9 inputs, each scored 0–100. Each bar is that input's sub-score; the figure is the points it added to the 100-point composite (weight × sub-score).
- Cash flow +30.0/30.0
- DSCR +10.0/10.0
- 1% rule +9.5/10.0
- Rent growth +4.1/5.0
- Livability +3.8/5.0
- ARV discount +3.2/15.0
- Condition / age +2.5/5.0
- Schools +0.8/10.0
- Appreciation +0.0/10.0
$230,000
🖨 Deal sheet (PDF) 📄 Offer letter ✓ Due diligence
Multi-family units
County records classify this as Multi-Family (2-4 Unit). Listing-text estimate: 3 units. confirmed
Listing remarks
Licensed 3-unit investment opportunity in York City offering strong income potential and flexibility. Currently vacant, giving the new owner the ability to set market rents from day one and maximize returns. Tenants responsible for electric while the landlord covers heat and hot water. The first and second floor units offer spacious layouts with large kitchens, separate dining rooms, comfortable living rooms, and one bedroom each, providing a layout that tenants truly value. The third floor unit is a 1 bedroom, 1 bath. A strong opportunity for an investor looking to establish or grow their portfolio with immediate upside and solid rental potential.
Key facts
- 4,896 sq ft lot
- Built 1900
- Listed 9 days
Property features AI
Finance
- Financial info: Total of 3 units with all 3 currently vacant
Exterior
- Parking: On-street parking
- Utilities: Public water; Public sewer
- Home design: Semi-detached property; Fee simple ownership
- Construction: Brick construction; Stone foundation; Above-grade and below-grade structures; Built year per assessor
- Exterior features: No tidal water
Interior
- Bedrooms: Three one-bedroom units (total units: 3)
- Heating & cooling: Hot water and central heating; Natural gas heating and hot water
- Interior features: Full basement
Neighborhood map
What this means for you Summary
Snapshot
- This is a 3 × 1-bed/1-bath units multifamily listed at $230k.
Deal economics
- At list price, monthly cash flow is $961 ($12k/yr) — positive. Per door: $320/mo.
- The deal already cash-flows at list — no discount required.
- Meets the 1% rule at list price ($3k rent vs $230k).
- Cap rate 11.3% vs local median 5.0% in York — top-decile yield for the area; either an underpriced asset or a hidden risk that comps aren't pricing in. Stress-test before assuming the spread holds.
Location & tenants
- Location reads 75/100 on livability (#427 in PA, #3,987 nationally) — a middle-class / working-renter tenant base. Strengths: cost of living A+, health & safety A+, housing A; Watch: amenities D+, crime F, employment F.
- York City SD (urban): math 4% / reading 16% proficiency, ranked #534 of 539 in PA (top 99%) — low school quality limits family demand, transient renter base, plan for 1-2y turnover; 72% free/reduced lunch — lower-income household profile, screen leases tightly.
- Market conditions: Rents rising fast (+6.4%/yr); 249 active listings in the ZIP; 6 comparable units currently listed for rent nearby; rentals lingering (median 44d on market — plan ~5-8 weeks vacancy on turnover, expect pricing pressure); 83% of comp listings sitting > 30 days — soft ceiling on asking rent; solid renter incomes; 1,328 units permitted in York County in 2024 (338 in 5+ unit buildings).
- At $3,334/mo this rent would consume 51% of the median local household income ($79k/yr) (locally 722% of renters already pay >50% of income on rent) — very limited rent-growth headroom before tenants either downsize or default.
Forward outlook
- Local home prices are declining (-3.0%/yr); year-one equity from $2k of loan paydown is wiped out by about $7k of value loss. Plan a longer hold.
- At projected returns (-3.0% appreciation + 6.4% rent growth), your $64k cash investment doubles in ~6 years — after that, you're playing with house money.
Negotiation context
- Only 9 days on market — expect competitive offers; lowballing is unlikely to land.
- Current owner paid $195k; 18% above their basis — modest negotiation headroom, anchor on the comps not their cost.
Risks & watch-outs
- Watch-outs: built in 1900 — expect roof / HVAC / electrical / plumbing capex.
- Climate carrying-cost: extreme-heat days projected 7→15/yr by 2055 (HVAC capex compounding) — expect insurance premiums to compound above CPI over the hold.
Questions for the listing agent
- Can we see the unit-by-unit rent roll, current vacancy, and any below-market leases? What's the average tenancy length?
- What capital expenditures (roof, boiler, parking lot, exteriors) have been made in the last 5 years, and what's planned in the next 2?
- Built in 1900 — when were the roof, HVAC, electrical panel, plumbing, and water heater last replaced?
- Is there a deadline driving the sale (1031 exchange, divorce, estate, relocation)? That informs how much negotiation room exists.
- Crime grade is F in this area — have there been break-ins, vandalism, or insurance claims at this property in the last 3 years? What carrier currently insures it and at what premium?
- What's the average days-on-market for RENTAL listings here right now (not sales)? A rising rental-DOM trend means longer vacancies and softer asking-rent achievability than the comps imply.
- What's the recent tenant-quality profile in this submarket — average credit score on applications, eviction rate, late-payment / NSF rate, and stable-employment percentage? A property-management company in the area should have these aggregated.
- How much new apartment / multifamily construction is in the pipeline within 1–3 miles? Heavy new supply (>2% of stock underway) typically softens rents 12–24 months out; light construction supports rent growth.
Investment metrics
- 1% rule
- 1.45% ✓
- Cap rate
- 11.31%
- Cash-on-cash
- 17.90%
- DSCR
- 1.80
- GRM
- 5.7
CMA / ARV
- ARV (median comp)
- $210,000
- List price
- $230,000
- Delta
- 9.52%
- Verdict
- FAIR
- Comps
- 20 within 1.0 mi
Show comp detail 12 sales within ~0.75 mi
| Address | Dist | Beds/Ba | Sqft | Sold | Price | $/sf | Match |
|---|---|---|---|---|---|---|---|
| 700 Pennsylvania Ave | 0.00mi | 3/— | 2,601 (+0%) | 0mo | $195,000 | $75 | 99 |
| 725 Pennsylvania Ave | 0.06mi | 4/— (+1) | 2,556 (-1%) | 1mo | $220,000 | $86 | 89 |
| 743 Madison Ave | 0.07mi | 4/2.0 (+1) | 2,555 (-1%) | 1mo | $229,000 | $90 | 89 |
| 707 Pennsylvania Ave | 0.03mi | 3/— | 2,348 (-9%) | 1mo | $210,000 | $89 | 82 |
| 646 Pennsylvania Ave | 0.05mi | 3/— | 2,292 (-12%) | 1mo | $210,000 | $92 | 77 |
| 658 Pennsylvania Ave | 0.03mi | 4/2.0 (+1) | 2,292 (-12%) | 0mo | $210,000 | $92 | 74 |
| 642 Pennsylvania Ave | 0.06mi | 4/— (+1) | 2,292 (-12%) | 1mo | $205,000 | $89 | 72 |
| 730 Pennsylvania Ave | 0.06mi | 4/— (+1) | 2,292 (-12%) | 1mo | $210,000 | $92 | 72 |
| 638 Pennsylvania Ave | 0.07mi | 4/— (+1) | 2,292 (-12%) | 9mo | $225,000 | $98 | 65 |
| 726 W Philadelphia St | 0.28mi | 4/2.0 (+1) | 2,256 (-13%) | 6mo | $185,000 | $82 | 55 |
| 311 Carlisle Ave | 0.17mi | 4/3.0 (+1) | 2,244 (-13%) | 9mo | $205,000 | $91 | 53 |
| 1242 W King St | 0.61mi | 4/— (+1) | 2,508 (-3%) | 10mo | $200,000 | $80 | 53 |
Match score weights: distance 35% · size 25% · config 20% · recency 20%. Top-matched comps best support the ARV.
Projected returns pro-forma
-3.0% appreciation · 6.38% rent growth · sell at horizon
- IRR
- 13.4%
- Equity multiple
- 1.56×
- Total profit
- $35,751
- Equity at exit
- $34,294
- IRR
- 24.8%
- Equity multiple
- 3.51×
- Total profit
- $161,912
- Equity at exit
- $19,886
Cash invested: $64,400 (down + closing). Projections, not guarantees.
Landlord ↔ Tenant lean methodology
- Overall (STATE)
- 62 Landlord-Friendly
- State Pennsylvania
- 62 Landlord-Friendly · EVEN
- County
- — inherits STATE
- City
- — inherits STATE
ZIP-level market 17404
- Rents YoY
- 6.4%
- Active inventory
- 249
- Price-to-rent
- 17.2×
Monthly cashflow live
- Estimated rent
- $3,334 high interval (Pro) →
- Mortgage (P&I)
- −$1,206
- Tax from tax record
- −$371 /mo · $4,452/yr
- Insurance
- −$96
- HOA
- −$0
- Vacancy / Maint / Mgmt
- −$700
- Net cashflow
- $961
Break-even live
Sensitivity live
| Price | -10% $1,091 | -5% $1,026 | +0% $961 | +5% $896 | +10% $831 |
|---|---|---|---|---|---|
| Rent | -10% $697 | -5% $829 | +0% $961 | +5% $1,093 | +10% $1,224 |
| Rate | -1.0pp $1,077 | -0.5pp $1,019 | base $961 | +0.5pp $901 | +1.0pp $841 |
3-unit breakdown (identical units grouped — click to expand)
| Units | Beds | Baths | Est. rent |
|---|---|---|---|
| 3× units | 1 | 1 | $3,333 |
| #1 | 1 | 1 | $1,111 |
| #2 | 1 | 1 | $1,111 |
| #3 | 1 | 1 | $1,111 |
| Total (3 units) | $3,334 | ||
UW: 25.0% down · 7.5% · 30yr · 1.5% tax · 5.0% vac · 8.0% maint · 8.0% mgmt
Financing live
Cash to close
- Down payment
- $57,500
- Closing costs
- $6,900
- Reserves months
- —
- Total cash needed
- —
Loan-product check · same deal, 3 products live
Conventional
25% down · 7.5% · 30yr
- Down + closing
- —
- Monthly P&I
- —
- Monthly cashflow
- —
- DSCR
- —
- Eligible?
- —
Personal DTI + credit; lowest rate.
DSCR
20% down · 8.5% · 30yr
- Down + closing
- —
- Monthly P&I
- —
- Monthly cashflow
- —
- DSCR
- —
- Eligible?
- —
No personal income docs; deal must DSCR.
Hard money
10% down · 12.0% · 12mo
- Down + closing
- —
- Monthly P&I
- —
- Monthly cashflow
- —
- DSCR
- —
- Eligible?
- —
Short-term bridge; refi at stabilization.
Rent comps 6 comps
| Address | Beds | Baths | Sqft | Rent | $/sqft | DOM | Units | Dist |
|---|---|---|---|---|---|---|---|---|
| 702 W Philadelphia St Unit 2 York, PA | 3.0 | 1.0 | 2154 | $1,375 | $0.64 | 44d | 1 | 0.28mi |
| 645 W Philadelphia St Unit 2ND FLOOR York, PA | 3.0 | 1.0 | 2124 | $1,100 | $0.52 | 44d | 1 | 0.30mi |
| 901 W King St Unit 2 York, PA | 2.0 | 1.0 | 2328 | $975 | $0.42 | 44d | 1 | 0.44mi |
| 537 W Jackson St York, PA | 3.0 | 2.0 | 1795 | $1,795 | $1.00 | 14d | 1 | 1.16mi |
| 103 W 6th Ave Unit 2ND FLOOR York, PA | 2.0 | 1.0 | 1896 | $1,195 | $0.63 | 44d | 1 | 1.38mi |
| 119 W Jackson St York, PA | 4.0 | 1.0 | 1800 | $1,395 | $0.78 | 44d | 1 | 1.46mi |
Listing history 3 events
-
2026-05-12status Pending 656-char remark
-
2026-05-04$230,000 Active 656-char remark
-
2026-05-02historical $230,000 656-char remark
ⓘ Source: listings_history table (triggers on properties + properties_extension) + one-shot
backfill from property_details.listing_events for pre-trigger history.
Tax reassessment forecast PA · Partial reset (capped growth)
- Current annual tax
- $4,452 · $371/mo
- Projected year-2 tax
- $4,452 · $371/mo
- Expected delta
- $0/yr ($0/mo · 0.0%)
ⓘ Screening estimate from a state-policy table — verify with the county assessor before closing.
Climate risk First Street
- Flood 1/10 Low FEMA zone X (unshaded) · 0% chance over 30 yrs
- Wildfire 1/10 Low
- Heat 6/10 Major 7 d/yr ≥103°F today · 15 d/yr by 30 yrs out
- Wind 4/10 Moderate 11% chance of damaging wind over 30 yrs
- Air quality 3/10 Moderate 3 unhealthy d/yr today · 5 by 30 yrs out
Nearby sold comps map
Loading sold comps map…
Walkable amenities ~0.75 mi
Loading nearby amenities…
Taxation est. · year 1
- Rental income
- $40,008
- − Mortgage interest
- −$12,884
- − Property taxes
- −$4,452
- − Insurance
- −$1,150
- − Repairs & maintenance
- −$3,201
- − Management
- −$3,201
- − Depreciation
- −$6,691
- Taxable income
- $8,430
- Est. tax owed @ 24.0%
- −$2,023
- After-tax cash flow
- $9,507/yr
For passive investors: Depreciation is non-cash, so a rental often shows a tax loss while cash-flowing — sheltering income. Rental losses are passive: they offset passive income freely, and up to $25,000/yr can offset ordinary (W-2) income if you actively participate and your MAGI is under $100k (phasing out to $0 by $150k); unused losses carry forward. On sale, claimed depreciation is recaptured at up to 25%, and gains may owe capital-gains tax (a 1031 exchange can defer both). Figures are a year-1 estimate at your 24.0% rate — not tax advice; consult a CPA.
Schools (NCES district)
- District
- York City SD
- NCES district ID
- 4226820
- Math proficiency
- 4% ▼ -7.00%
- Reading proficiency
- 16% ▼ -9.00%
- Median HH income
- $29,470
- Composite
- 7.61/100
- National rank
- #9943
- State rank
- #534 of 539 in PA
Livability — York
- Score
- 75/100
- State rank
- #427
- US rank
- #3987
Category grades
Schools grade is shown separately in the Schools card above.
Census & demographics
- Census place
- York, PA
- County
- York County · 278,806 people
- City population
- 184,764
- Metro
- York-Hanover, PA
- Population (ZIP)
- 39,374
- Household income
- $78,506
- Rent vs Own
- Severe rent burden
- 722.0
Population outlook (York County) Hauer SSP2
- Today (2025)
- 454,205 people
- By 2030
- 457,407 · +0.7%
- By 2040
- 457,529 · +0.7%
- By 2050
- 448,261 · -1.3%
- By 2075
- 427,388 · -5.9%
- By 2100
- 384,218 · -15.4%
Race, ethnicity, and origin ACS 2023
- Neighborhood character
- Majority White (65%)
- Race & ethnicity
- White 65% Hispanic / Latino 19% Black 12% Two or more races 8%
- Hispanic origin (detail)
- Mexican 2% Puerto Rican 9% Dominican 4%
- Common ancestry
- Romanian 2% Slovak 2% Lithuanian 1%
- Foreign-born
- 6% · Canada, Vietnam
- Languages at home
- 85% English-only · Spanish 12% Russian/Polish/Slavic 1%
Political lean MEDSL · York
- 2024 margin
- Strong R (+25.3) · D 36.9% · R 62.1%
- 2008→2024 swing
- -11.7pp toward R · 2008: -13.6pp · 2024: -25.3pp
- All cycles
- 2024: R+25.3 2020: R+24.6 2016: R+29.3 2012: R+21.2 2008: R+13.6
Not yet ingested
- Civics
- —
Market trends
- HPI YoY
- ▼ -135.44%
- Current HPI
- 237.5683
- Rent YoY
- ▲ 6.38%
- Metro
- York-Hanover, PA
- State GDP YoY
- ▲ 1.68%
- F500 in state
- 34
Industry mix (Fortune 500 HQ in PA)
| Industry | F500 HQs | Revenue |
|---|---|---|
| Healthcare | 2 | $309B |
|
||
| Insurance | 2 | $27B |
|
||
| Telecommunications / Media | 1 | $124B |
|
||
| Industrial Distribution | 1 | $22B |
|
||
| Financial Services | 1 | $20B |
|
||
| Chemicals / Materials | 1 | $18B |
|
||
Price history
-15.2% since first listed4 events — show timeline
- 2026-06-10 Sold (MLS) $195,000 BRIGHT MLS
- 2026-05-12 Pending — BRIGHT MLS
- 2026-05-04 Listed $230,000 BRIGHT MLS
- 2026-05-02 Coming Soon $230,000 BRIGHT MLS
Property tax history
+0.8%/yrLatest (2026): $4,452 · +1.6% YoY. Source: county tax records.
Cash-flow waterfall
monthlySold comps — $/sqft
last 12 mo · ≤1 miLoading sold comps…