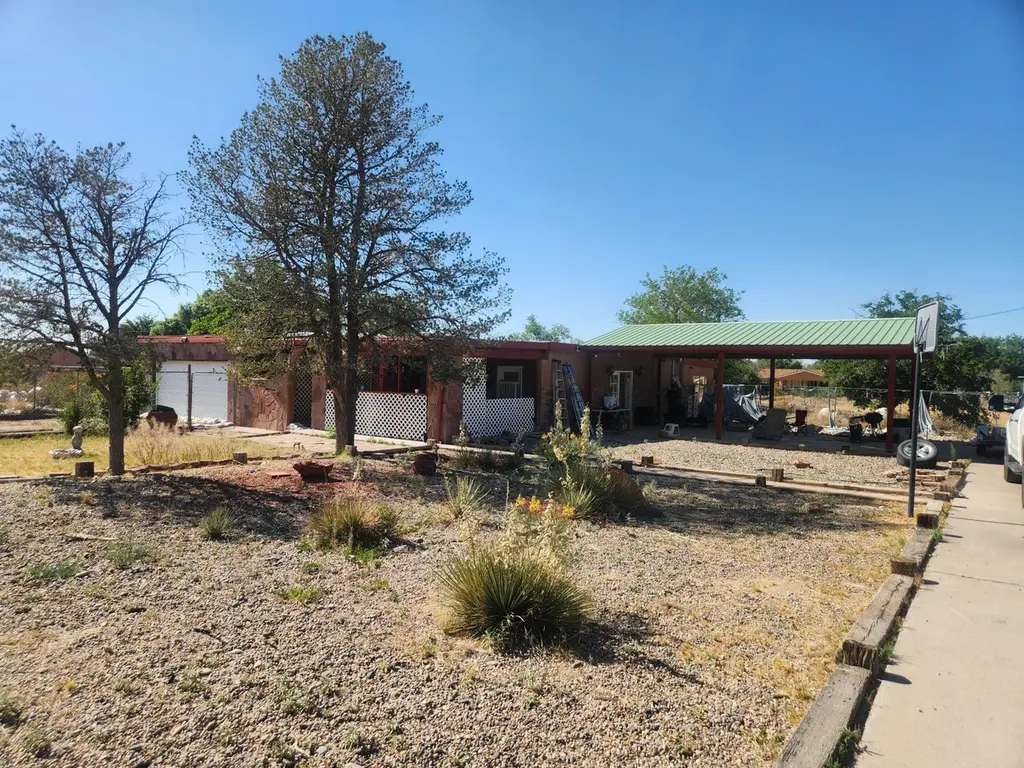
314 Goddard Ave · Rio Communities, NM
Flood risk 1/10 · Minimal
- FEMA flood zone
- X (unshaded)
- Chance of flooding over 30 yrs
- 0.0%
- Est. flood insurance / yr
- $507 – $1,088
Fire risk 4/10 · Minor
- Est. fire insurance / yr
- $706 – $1,312
Heat risk 5/10 · Moderate
- Hot days now (above 97°F)
- 7 days/yr
- Hot days in 30 yrs
- 20 days/yr
Wind risk 1/10 · Minimal
- Chance of severe wind over 30 yrs
- —
Air-quality risk 1/10 · Minimal
- Unhealthy air days now
- 0 days/yr
- Unhealthy air days in 30 yrs
- 0 days/yr
Risk factors via First Street. Map © Google.
Why this score? — see what drove the D+ grade
The composite is a weighted blend of 9 inputs, each scored 0–100. Each bar is that input's sub-score; the figure is the points it added to the 100-point composite (weight × sub-score).
- Cash flow +15.3/30.0
- ARV discount +15.0/15.0
- DSCR +4.7/10.0
- 1% rule +3.2/10.0
- Livability +2.8/5.0
- Rent growth +2.5/5.0
- Condition / age +2.5/5.0
- Schools +2.3/10.0
- Appreciation +0.0/10.0
$199,000
🖨 Deal sheet 📄 Offer letter ✓ Due diligence
Listing remarks
Ideal 3/2 family home on a large lot. 2 car garage, and large attached cover/carport for outdoor patio or working area. Excellent opportunity for investors.
Key facts
- 1.02 acre lot
- 2 garage spots
- Built 1972
Property features AI
Exterior
- Parking: Attached garage with workshop; 2 garage spaces; Carport (4 spaces); RV access/parking
- Utilities: Electricity connected; Natural gas connected; Public water; Septic tank
- Home design: Single-story; Faces south; Resale property; Double-wide mobile home body type
- Construction: Frame and stucco construction; Tar and gravel roof; Concrete perimeter foundation; Built per public records
- Exterior features: Private yard; Landscaped lot; Covered arena; Back yard fencing with gate (full enclosure)
Interior
- Kitchen: Dishwasher; Free-standing electric range; Refrigerator
- Bedrooms: Main-level bedroom (12 x 12)
- Flooring: Carpet; Tile
- Bathrooms: 2 full bathrooms
- Heating & cooling: Central forced-air heating; Evaporative cooling
- Interior features: Main-level primary bedroom; Double-pane insulated vinyl windows
- Laundry & utility: Electric dryer hookup
Neighborhood map
What this means for you Summary
Snapshot
- This is a 3-bed/2.0-bath single-family listed at $199k.
Deal economics
- At list price, monthly cash flow is $74 ($884/yr) — positive.
- The deal already cash-flows at list — no discount required.
- To meet the 1% rule (rent ≥ 1% of price), the offer needs to be $163k (18.2% below list).
- Recommended offer: $163k (18.2% below list) — sets the bar for 1% rule.
- Cap rate 6.7% vs local median 3.7% in Rio Communities — top-decile yield for the area; either an underpriced asset or a hidden risk that comps aren't pricing in. Stress-test before assuming the spread holds.
Location & tenants
- Location reads 56/100 on livability (#191 in NM) — a working-class tenant base; expect higher turnover. Strengths: cost of living A+, housing A; Watch: schools F, crime F, amenities F.
- Belen Consolidated Schools (other): math 19% / reading 28% proficiency, ranked #50 of 95 in NM (top 53%) — low school quality limits family demand, transient renter base, plan for 1-2y turnover; 83% free/reduced lunch — lower-income household profile, screen leases tightly.
- Market conditions: 426 active listings in the ZIP; 1 comparable units currently listed for rent nearby; 303 units permitted in Valencia County in 2024 (0 in 5+ unit buildings).
- This rent runs 38% of the median local income ($52k/yr) — at the standard rent-burdened threshold; future hikes will face affordability resistance.
Forward outlook
- Local home prices are declining (-3.0%/yr); year-one equity from $1k of loan paydown is wiped out by about $6k of value loss. Plan a longer hold.
- Valencia County population projected at -14% by 2050 — secular population decline; favor cash flow + early exit over multi-decade hold.
Negotiation context
- It's been on market 20 days — a 2% lower offer ($196k) is reasonable based on typical stale-listing flexibility.
Risks & watch-outs
- Climate carrying-cost: extreme-heat days projected 7→20/yr by 2055 (HVAC capex compounding) — expect insurance premiums to compound above CPI over the hold.
Questions for the listing agent
- Built in 1972 — when were the roof, HVAC, electrical panel, plumbing, and water heater last replaced?
- Is there a deadline driving the sale (1031 exchange, divorce, estate, relocation)? That informs how much negotiation room exists.
- Schools are F-rated, which usually means shorter tenancies and higher turnover. Who's the typical renter profile here, and what's been the actual vacancy rate?
- Crime grade is F in this area — have there been break-ins, vandalism, or insurance claims at this property in the last 3 years? What carrier currently insures it and at what premium?
- The area grade is low — what's the realistic commute time and amenity access for the typical tenant pool here? Any planned neighborhood developments (good or bad) we should know about?
- What's the average days-on-market for RENTAL listings here right now (not sales)? A rising rental-DOM trend means longer vacancies and softer asking-rent achievability than the comps imply.
- What's the recent tenant-quality profile in this submarket — average credit score on applications, eviction rate, late-payment / NSF rate, and stable-employment percentage? A property-management company in the area should have these aggregated.
- How much new for-sale + rental construction is in the pipeline within 1–3 miles? Heavy new supply typically softens prices + rents 12–24 months out; constrained supply supports both.
Investment metrics
- 1% rule
- 0.82% ✗
- Cap rate
- 6.74%
- Cash-on-cash
- 1.59%
- DSCR
- 1.07
- GRM
- 10.2
CMA / ARV
- ARV (on-the-fly)
- $268,392
- Comps found
- 6
Show comp detail 6 sales within ~0.75 mi
| Address | Dist | Beds/Ba | Sqft | Sold | Price | $/sf | Match |
|---|---|---|---|---|---|---|---|
| 317 Hillandale Ave | 0.07mi | 3/2.0 | 1,888 (+12%) | 3mo | $240,000 | $127 | 74 |
| 305 Gorman Ave | 0.24mi | 3/2.0 | 1,540 (-9%) | 3mo | $245,000 | $159 | 72 |
| 90 Moraga St | 0.15mi | 2/2.0 (-1) | 1,485 (-12%) | 0mo | $230,000 | $155 | 68 |
| 342 Goddard Ave | 0.25mi | 3/2.0 | 1,542 (-9%) | 10mo | $279,900 | $182 | 65 |
| 444 Aquina Ct | 0.60mi | 3/2.0 | 1,890 (+12%) | 2mo | $285,000 | $151 | 50 |
| 92 Horner St | 0.19mi | 2/2.0 (-1) | 1,440 (-15%) | 15mo | $250,000 | $174 | 49 |
Match score weights: distance 35% · size 25% · config 20% · recency 20%. Top-matched comps best support the ARV.
Projected returns pro-forma
-3.0% appreciation · 3.0% rent growth · sell at horizon
- IRR
- -13.8%
- Equity multiple
- 0.50×
- Total profit
- $-27,630
- Equity at exit
- $29,672
- IRR
- -5.0%
- Equity multiple
- 0.67×
- Total profit
- $-18,325
- Equity at exit
- $17,206
Cash invested: $55,720 (down + closing). Projections, not guarantees.
Landlord ↔ Tenant lean methodology
- Overall (STATE)
- 55 Moderately Landlord-Leaning
- State New Mexico
- 55 Moderately Landlord-Leaning · D+3
- County
- — inherits STATE
- City
- — inherits STATE
ZIP-level market 87002
- Home prices YoY
- -19.0%
- Active inventory
- 426
- Price-to-rent
- 10.2×
Monthly cashflow live
- Estimated rent
- $1,628 medium interval (Pro) →
- Mortgage (P&I)
- −$1,044
- Tax from tax record
- −$86 /mo · $1,032/yr
- Insurance
- −$83
- HOA
- −$0
- Vacancy / Maint / Mgmt
- −$342
- Net cashflow
- $74
Break-even live
UW: 25.0% down · 7.5% · 30yr · 1.5% tax · 5.0% vac · 8.0% maint · 8.0% mgmt
Financing live
Cash to close
- Down payment
- $49,750
- Closing costs
- $5,970
- Reserves months
- —
- Total cash needed
- —
Loan-product check · same deal, 3 products live
Conventional
25% down · 7.5% · 30yr
- Down + closing
- —
- Monthly P&I
- —
- Monthly cashflow
- —
- DSCR
- —
- Eligible?
- —
Personal DTI + credit; lowest rate.
DSCR
20% down · 8.5% · 30yr
- Down + closing
- —
- Monthly P&I
- —
- Monthly cashflow
- —
- DSCR
- —
- Eligible?
- —
No personal income docs; deal must DSCR.
Hard money
10% down · 12.0% · 12mo
- Down + closing
- —
- Monthly P&I
- —
- Monthly cashflow
- —
- DSCR
- —
- Eligible?
- —
Short-term bridge; refi at stabilization.
Rent comps 1 comps
| Address | Beds | Baths | Sqft | Rent | $/sqft | DOM | Units | Dist |
|---|---|---|---|---|---|---|---|---|
| 1099 Carmel Rd Rio Communities, NM | 2.0 | 2.0 | 1877 | $1,700 | $0.91 | 21d | 1 | 1.15mi |
Listing history 13 events
-
2026-06-18days on market $199,000 Active 20 DOM
-
2026-06-17days on market $199,000 Active 19 DOM
-
2026-06-16days on market $199,000 Active 18 DOM
-
2026-06-15days on market $199,000 Active 17 DOM
-
2026-06-13days on market $199,000 Active 15 DOM
-
2026-06-10days on market $199,000 Active 12 DOM
-
2026-06-09days on market $199,000 Active 11 DOM
-
2026-06-08days on market $199,000 Active 10 DOM
-
2026-06-07days on market $199,000 Active 9 DOM
-
2026-06-03days on market $199,000 Active 5 DOM
-
2026-06-02days on market $199,000 Active 4 DOM
-
2026-06-01days on market $199,000 Active 3 DOM
-
2026-05-31days on market $199,000 Active 2 DOM
ⓘ Source: listings_history table (triggers on properties + properties_extension) + one-shot
backfill from property_details.listing_events for pre-trigger history.
Tax reassessment forecast NM · Resets to sale price
- Current annual tax
- $1,032 · $86/mo
- Projected year-2 tax
- $1,592 · $133/mo
- Expected delta
- +$560/yr (+$47/mo · 54.3%)
ⓘ Screening estimate from a state-policy table — verify with the county assessor before closing.
Climate risk First Street
- Flood 1/10 Low FEMA zone X (unshaded) · 0% chance over 30 yrs
- Wildfire 4/10 Moderate
- Heat 5/10 Major 7 d/yr ≥97°F today · 20 d/yr by 30 yrs out
- Wind 1/10 Low
- Air quality 1/10 Low 0 unhealthy d/yr today · 0 by 30 yrs out
Nearby sold comps map
Loading sold comps map…
Walkable amenities ~0.75 mi
Loading nearby amenities…
Taxation est. · year 1
- Rental income
- $19,537
- − Mortgage interest
- −$11,147
- − Property taxes
- −$1,032
- − Insurance
- −$995
- − Repairs & maintenance
- −$1,563
- − Management
- −$1,563
- − Depreciation
- −$5,789
- Taxable loss
- −$2,552
- Est. tax savings @ 24.0%
- +$613
- After-tax cash flow
- $1,497/yr
For passive investors: Depreciation is non-cash, so a rental often shows a tax loss while cash-flowing — sheltering income. Rental losses are passive: they offset passive income freely, and up to $25,000/yr can offset ordinary (W-2) income if you actively participate and your MAGI is under $100k (phasing out to $0 by $150k); unused losses carry forward. On sale, claimed depreciation is recaptured at up to 25%, and gains may owe capital-gains tax (a 1031 exchange can defer both). Figures are a year-1 estimate at your 24.0% rate — not tax advice; consult a CPA.
Schools (NCES district)
- District
- Belen Consolidated Schools
- NCES district ID
- 3500180
- Math proficiency
- 19% —
- Reading proficiency
- 28% —
- Median HH income
- $38,445
- Composite
- 22.79/100
- National rank
- #13408
- State rank
- #50 of 95 in NM
Livability — Rio Communities
- Score
- 56/100
- State rank
- #191
- US rank
- #22989
Category grades
Schools grade is shown separately in the Schools card above.
Census & demographics
- Census place
- Rio Communities, NM
- County
- Valencia County · 68,779 people
- Metro
- Albuquerque, NM
- Population (ZIP)
- 21,265
- Household income
- $51,961
- Rent vs Own
- Severe rent burden
- 318.0
Population outlook (Valencia County) Hauer SSP2
- Today (2025)
- 73,788 people
- By 2030
- 72,101 · -2.3%
- By 2040
- 67,930 · -7.9%
- By 2050
- 63,191 · -14.4%
- By 2075
- 53,644 · -27.3%
- By 2100
- 40,882 · -44.6%
Race, ethnicity, and origin ACS 2023
- Neighborhood character
- Majority Hispanic (63%)
- Race & ethnicity
- Hispanic / Latino 63% White 31% Two or more races 28% Black 1%
- Hispanic origin (detail)
- Mexican 38%
- Common ancestry
- Slovak 2% Lithuanian 1% Iranian 1%
- Foreign-born
- 9% · Canada, Vietnam
- Languages at home
- 73% English-only · Spanish 27%
Political lean MEDSL · Valencia
- 2024 margin
- R (+16.4) · D 40.9% · R 57.3% · Other 1.8%
- 2008→2024 swing
- -24.1pp toward R · 2008: 7.7pp · 2024: -16.4pp
- All cycles
- 2024: R+16.4 2020: R+9.6 2016: R+8.7 2012: D+2.5 2008: D+7.7
Not yet ingested
- Civics
- —
Market trends
- HPI YoY
- ▼ -51.62%
- Current HPI
- 219.5581
- Rent YoY
- —
- Metro
- Albuquerque, NM
- State GDP YoY
- —
- F500 in state
- 0
Price history
3 events — show timeline
- 2026-05-18 Listed $199,000 Southwest MLS
- 2003-04-07 Sold (Public Records) — Public Records
- 2000-04-05 Sold (Public Records) — Public Records
Property tax history
+1.3%/yrLatest (2025): $1,032 · +26.4% YoY. Source: county tax records.
Cash-flow waterfall
monthlySold comps — $/sqft
last 12 mo · ≤1 miLoading sold comps…