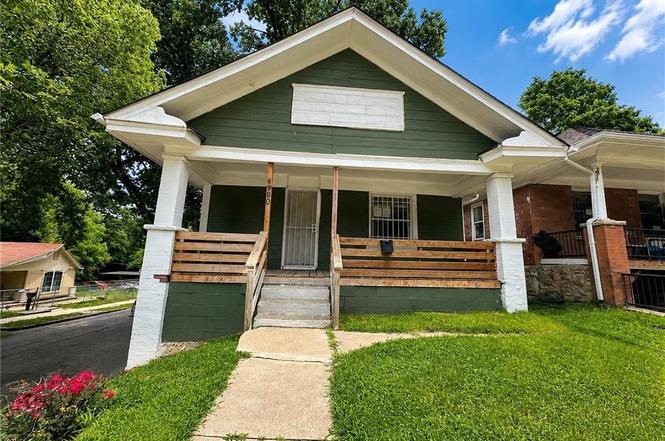
4900 E 23rd St · Kansas City, MO
Flood risk 1/10 · Minimal
- FEMA flood zone
- X (unshaded)
- Chance of flooding over 30 yrs
- 0.0%
- Est. flood insurance / yr
- $473 – $860
Fire risk 1/10 · Minimal
- Est. fire insurance / yr
- $1,054 – $1,958
Heat risk 4/10 · Minor
- Hot days now (above 106°F)
- 7 days/yr
- Hot days in 30 yrs
- 16 days/yr
Wind risk 2/10 · Minimal
- Chance of severe wind over 30 yrs
- —
Air-quality risk 3/10 · Minor
- Unhealthy air days now
- 2 days/yr
- Unhealthy air days in 30 yrs
- 3 days/yr
Risk factors via First Street. Map © Google.
Why this score? — see what drove the B+ grade
The composite is a weighted blend of 9 inputs, each scored 0–100. Each bar is that input's sub-score; the figure is the points it added to the 100-point composite (weight × sub-score).
- Cash flow +30.0/30.0
- ARV discount +15.0/15.0
- DSCR +10.0/10.0
- 1% rule +8.9/10.0
- Livability +3.9/5.0
- Rent growth +2.7/5.0
- Condition / age +2.5/5.0
- Schools +1.5/10.0
- Appreciation +1.1/10.0
$99,000
🖨 Deal sheet (PDF) 📄 Offer letter ✓ Due diligence
Listing remarks MLS
Step into this delightful 2-bedroom, 1-bathroom bungalow, a perfect blend of classic charm and contemporary updates. The original hardwood floors have been refinished, adding warmth and character. The entire house has been meticulously rewired, ensuring safety and efficiency. Enjoy the curb appeal of a brand-new front porch, perfect for morning coffee or evening relaxation. All windows have been replaced enhancing energy efficiency. Every door in the house is new, complemented by smart locks for added security and convenience. Modern LED lighting is installed throughout, providing bright and energy-efficient illumination. The plumbing system has been updated with PEX piping, offering reliability and longevity. Freshly painted interiors create a bright and welcoming atmosphere, accented by elegant 5-inch baseboards that add a touch of sophistication. This bungalow is move-in ready and waiting for you to call it home.
Key facts
- Replacement windows
- Updated plumbing
- 3,357 sq ft lot
Tags
Property features AI
Finance
- Other: Lot approximately 3,357 square feet (per public records)
Exterior
- Parking: Other parking
- Security: Smart door lock; Smoke detector(s)
- Utilities: Public water; Public sewer
- Home design: Single family residence; Residential property; Bungalow style; One story (main level living noted)
- Construction: Frame construction; Composition roof; Full unfinished stone/rock basement
- Exterior features: Front porch; Metal fencing; Paved road access; Not in a flood plain
Interior
- Kitchen: Built-in features; Solid surface counters; Disposal; Electric range
- Bedrooms: 2 bedrooms on the main level; Both bedrooms have wood flooring
- Flooring: Wood; Laminate; Tile
- Bathrooms: 1 full bathroom on the main level with ceramic tile and shower over tub
- Heating & cooling: Natural gas heating; Window unit(s) for cooling
- Interior features: Painted cabinets; Bungalow floor plan
- Laundry & utility: Laundry in the basement
Neighborhood map
What this means for you Summary
Snapshot
- This is a 4-bed/1.0-bath single-family listed at $99k.
Deal economics
- At list price, monthly cash flow is $493 ($6k/yr) — positive.
- The deal already cash-flows at list — no discount required.
- Meets the 1% rule at list price ($1k rent vs $99k).
- Cap rate 12.3% vs local median 3.9% in Kansas City — top-decile yield for the area; either an underpriced asset or a hidden risk that comps aren't pricing in. Stress-test before assuming the spread holds.
Location & tenants
- Location reads 78/100 on livability (#28 in MO, #2,671 nationally) — a middle-class / working-renter tenant base. Strengths: amenities A+, commute A+, cost of living A+; Watch: crime F.
- Kansas City 33 (urban): math 12% / reading 24% proficiency, ranked #308 of 324 in MO (top 95%) — low school quality limits family demand, transient renter base, plan for 1-2y turnover; 75% free/reduced lunch — lower-income household profile, screen leases tightly.
- Zoned schools: Phillis Wheatley Elementary (math 2% / reading 8%, grade F, #1,072 of 1,115 statewide, top 98%, 391 students, 99% FRL); Central Middle School (math 0% / reading 9%, grade F, #388 of 391 statewide, top 99%, 428 students, 99% FRL); Northeast High (math 2% / reading 22%, grade F, #497 of 521 statewide, top 96%, 657 students, 100% FRL) — zoned schools average 99% FRL vs 75% district-wide (24 pts higher); higher-poverty schools than district average — tighter screening recommended.
- Market conditions: Rents flat; 107 active listings in the ZIP; 10 comparable units currently listed for rent nearby; rentals at typical pace (median 18d on market — plan ~3-4 weeks tenant-placement turnaround); lower-income renter base — watch delinquency; 4,002 units permitted in Jackson County in 2024 (2,271 in 5+ unit buildings).
- At $1,380/mo this rent would consume 50% of the median local household income ($33k/yr) (locally 1943% of renters already pay >50% of income on rent) — very limited rent-growth headroom before tenants either downsize or default.
Forward outlook
- Local home prices are declining (-3.0%/yr); year-one equity from $684 of loan paydown is wiped out by about $3k of value loss. Plan a longer hold.
- Jackson County population projected at +4% by 2050 — modest demand growth; plan on rents tracking national, not racing it.
- At projected returns (-3.0% appreciation + 0.9% rent growth), your $28k cash investment doubles in ~7 years — after that, you're playing with house money.
Negotiation context
- Only 3 days on market — expect competitive offers; lowballing is unlikely to land.
- 3 sale attempts since 4y ago; this cycle's ask has dropped $16k (14%) from the opening price — seller is motivated, your offer sets the floor, not the list.
Risks & watch-outs
- Watch-outs: built in 1910 — expect roof / HVAC / electrical / plumbing capex.
Questions for the listing agent
- Built in 1910 — when were the roof, HVAC, electrical panel, plumbing, and water heater last replaced?
- Is there a deadline driving the sale (1031 exchange, divorce, estate, relocation)? That informs how much negotiation room exists.
- Crime grade is F in this area — have there been break-ins, vandalism, or insurance claims at this property in the last 3 years? What carrier currently insures it and at what premium?
- What's the average days-on-market for RENTAL listings here right now (not sales)? A rising rental-DOM trend means longer vacancies and softer asking-rent achievability than the comps imply.
- What's the recent tenant-quality profile in this submarket — average credit score on applications, eviction rate, late-payment / NSF rate, and stable-employment percentage? A property-management company in the area should have these aggregated.
- How much new for-sale + rental construction is in the pipeline within 1–3 miles? Heavy new supply typically softens prices + rents 12–24 months out; constrained supply supports both.
Investment metrics
- 1% rule
- 1.39% ✓
- Cap rate
- 12.27%
- Cash-on-cash
- 21.35%
- DSCR
- 1.95
- GRM
- 6.0
CMA / ARV
- ARV (on-the-fly)
- $120,224
- Comps found
- 9
Show comp detail 9 sales within ~0.75 mi
| Address | Dist | Beds/Ba | Sqft | Sold | Price | $/sf | Match |
|---|---|---|---|---|---|---|---|
| 2320 Chelsea Ave | 0.07mi | 3/1.0 (-1) | 945 (+7%) | 17mo | $45,000 | $48 | 66 |
| 2237 Oakley Ave | 0.49mi | 3/1.0 (-1) | 889 (+1%) | 11mo | $150,000 | $169 | 62 |
| 2410 Myrtle Ave | 0.55mi | 3/1.5 (-1) | 837 (-5%) | 1mo | $134,900 | $161 | 57 |
| 2021 Spruce Ave | 0.37mi | 3/1.0 (-1) | 1,000 (+13%) | 8mo | $63,000 | $63 | 49 |
| 2534 Lawn Ave | 0.37mi | 3/1.0 (-1) | 996 (+13%) | 14mo | $135,000 | $136 | 45 |
| 2454 Cypress Ave | 0.34mi | 3/1.0 (-1) | 800 (-10%) | 22mo | $120,000 | $150 | 45 |
| 2835 Raytown Rd | 0.72mi | 3/1.0 (-1) | 958 (+8%) | 7mo | $185,000 | $193 | 42 |
| 2701 Oakley Ave | 0.72mi | 3/1.0 (-1) | 984 (+11%) | 19mo | $115,000 | $117 | 27 |
| 2807 Quincy Ave | 0.69mi | 3/1.0 (-1) | 756 (-14%) | 19mo | $89,999 | $119 | 23 |
Match score weights: distance 35% · size 25% · config 20% · recency 20%. Top-matched comps best support the ARV.
Projected returns pro-forma
-3.0% appreciation · 0.94% rent growth · sell at horizon
- IRR
- 11.7%
- Equity multiple
- 1.45×
- Total profit
- $12,538
- Equity at exit
- $14,761
- IRR
- 19.1%
- Equity multiple
- 2.45×
- Total profit
- $40,201
- Equity at exit
- $8,560
Cash invested: $27,720 (down + closing). Projections, not guarantees.
Landlord ↔ Tenant lean methodology
- Overall (STATE)
- 81 Strongly Landlord-Friendly
- State Missouri
- 81 Strongly Landlord-Friendly · R+10
- County
- — inherits STATE
- City
- — inherits STATE
ZIP-level market 64127
- Home prices YoY
- -2.6%
- Rents YoY
- 0.9%
- Active inventory
- 107
- Price-to-rent
- 6.0×
Monthly cashflow live
- Estimated rent
- $1,380 high interval (Pro) →
- Mortgage (P&I)
- −$519
- Tax from tax record
- −$37 /mo · $443/yr
- Insurance
- −$41
- HOA
- −$0
- Vacancy / Maint / Mgmt
- −$290
- Net cashflow
- $493
Break-even live
Sensitivity live
| Price | -10% $549 | -5% $521 | +0% $493 | +5% $465 | +10% $437 |
|---|---|---|---|---|---|
| Rent | -10% $384 | -5% $439 | +0% $493 | +5% $548 | +10% $602 |
| Rate | -1.0pp $543 | -0.5pp $518 | base $493 | +0.5pp $468 | +1.0pp $442 |
UW: 25.0% down · 7.5% · 30yr · 1.5% tax · 5.0% vac · 8.0% maint · 8.0% mgmt
Financing live
Cash to close
- Down payment
- $24,750
- Closing costs
- $2,970
- Reserves months
- —
- Total cash needed
- —
Loan-product check · same deal, 3 products live
Conventional
25% down · 7.5% · 30yr
- Down + closing
- —
- Monthly P&I
- —
- Monthly cashflow
- —
- DSCR
- —
- Eligible?
- —
Personal DTI + credit; lowest rate.
DSCR
20% down · 8.5% · 30yr
- Down + closing
- —
- Monthly P&I
- —
- Monthly cashflow
- —
- DSCR
- —
- Eligible?
- —
No personal income docs; deal must DSCR.
Hard money
10% down · 12.0% · 12mo
- Down + closing
- —
- Monthly P&I
- —
- Monthly cashflow
- —
- DSCR
- —
- Eligible?
- —
Short-term bridge; refi at stabilization.
Rent comps 10 comps
| Address | Beds | Baths | Sqft | Rent | $/sqft | DOM | Units | Dist |
|---|---|---|---|---|---|---|---|---|
| 1904 Elmwood Ave Kansas City, MO | 4.0 | 2.0 | 864 | $1,152 | $1.33 | 45d | 1 | 0.35mi |
| 2454 Cypress Ave Kansas City, MO | 3.0 | 1.0 | 800 | $1,300 | $1.62 | 5d | 1 | 0.37mi |
| 2424 Norton Ave Unit B Kansas City, MO | 3.0 | 1.0 | 982 | $1,150 | $1.17 | 18d | 1 | 0.53mi |
| 2419 Bales Ave Kansas City, MO | 3.0 | 1.5 | 1116 | $1,500 | $1.34 | 4d | 1 | 0.84mi |
| 5108 E 30th St Kansas City, MO | 3.0 | 1.0 | 960 | $1,400 | $1.46 | 4d | 1 | 0.91mi |
| 3032 Elmwood Ave Kansas City, MO | 3.0 | 1.0 | 1027 | $1,275 | $1.24 | 9d | 1 | 1.01mi |
| 2900 E 21st St Kansas City, MO | 3.0 | 1.5 | 897 | $1,650 | $1.84 | 18d | 1 | 1.22mi |
| 3243 Denver Dr Kansas City, MO | 1.0–3.0 | 1.0 | 862 | $1,226 | $1.42 | 45d | 1 | 1.25mi |
| 6011 E 11th St Kansas City, MO | 3.0 | 1.0 | 900 | $1,200 | $1.33 | 18d | 1 | 1.33mi |
| 3414 Elmwood Ave Kansas City, MO | 4.0 | 1.0 | 1109 | $1,300 | $1.17 | 18d | 1 | 1.46mi |
Listing history 7 events
-
2026-06-21statusdays on market $99,000 Active 3 DOM
-
2026-06-18days on market $99,000 Coming Soon 7 DOM
-
2026-06-17days on market $99,000 Coming Soon 6 DOM
-
2026-06-16days on market $99,000 Coming Soon 5 DOM
-
2026-06-15days on market $99,000 Coming Soon 4 DOM
-
2026-06-13remarks 699-char remark
-
2026-06-13$99,000 Coming Soon 2 DOM
ⓘ Source: listings_history table (triggers on properties + properties_extension) + one-shot
backfill from property_details.listing_events for pre-trigger history.
Tax reassessment forecast MO · Resets to sale price
- Current annual tax
- $443 · $37/mo
- Projected year-2 tax
- $960 · $80/mo
- Expected delta
- +$518/yr (+$43/mo · 117.0%)
ⓘ Screening estimate from a state-policy table — verify with the county assessor before closing.
Climate risk First Street
- Flood 1/10 Low FEMA zone X (unshaded) · 0% chance over 30 yrs
- Wildfire 1/10 Low
- Heat 4/10 Moderate 7 d/yr ≥106°F today · 16 d/yr by 30 yrs out
- Wind 2/10 Low
- Air quality 3/10 Moderate 2 unhealthy d/yr today · 3 by 30 yrs out
Nearby sold comps map
Loading sold comps map…
Walkable amenities ~0.75 mi
Loading nearby amenities…
Taxation est. · year 1
- Rental income
- $16,566
- − Mortgage interest
- −$5,546
- − Property taxes
- −$443
- − Insurance
- −$495
- − Repairs & maintenance
- −$1,325
- − Management
- −$1,325
- − Depreciation
- −$2,880
- Taxable income
- $4,552
- Est. tax owed @ 24.0%
- −$1,092
- After-tax cash flow
- $4,827/yr
For passive investors: Depreciation is non-cash, so a rental often shows a tax loss while cash-flowing — sheltering income. Rental losses are passive: they offset passive income freely, and up to $25,000/yr can offset ordinary (W-2) income if you actively participate and your MAGI is under $100k (phasing out to $0 by $150k); unused losses carry forward. On sale, claimed depreciation is recaptured at up to 25%, and gains may owe capital-gains tax (a 1031 exchange can defer both). Figures are a year-1 estimate at your 24.0% rate — not tax advice; consult a CPA.
Schools (NCES district)
- District
- Kansas City 33
- NCES district ID
- 2916400
- Math proficiency
- 12% ▼ -8.00%
- Reading proficiency
- 24% ▬ 0.00%
- Median HH income
- $35,227
- Composite
- 14.8/100
- National rank
- #9387
- State rank
- #308 of 324 in MO
Livability — Kansas City
- Score
- 78/100
- State rank
- #28
- US rank
- #2671
Category grades
Schools grade is shown separately in the Schools card above.
Census & demographics
- Census place
- Kansas City, MO
- County
- Jackson County · 687,798 people
- City population
- 439,467
- Metro
- Kansas City, MO-KS
- Population (ZIP)
- 17,668
- Household income
- $33,111
- Rent vs Own
- Severe rent burden
- 1943.0
Population outlook (Jackson County) Hauer SSP2
- Today (2025)
- 719,589 people
- By 2030
- 731,456 · +1.6%
- By 2040
- 746,689 · +3.8%
- By 2050
- 749,289 · +4.1%
- By 2075
- 736,227 · +2.3%
- By 2100
- 668,210 · -7.1%
Race, ethnicity, and origin ACS 2023
- Neighborhood character
- Diverse neighborhood (Simpson 0.65)
- Race & ethnicity
- Black 42% Hispanic / Latino 40% Two or more races 13% White 12% Native American 1%
- Hispanic origin (detail)
- Mexican 28%
- Foreign-born
- 20% · Canada, Vietnam
- Languages at home
- 67% English-only · Spanish 29%
Political lean MEDSL · Jackson
- 2024 margin
- D (+19.3) · D 58.9% · R 39.5% · Other 1.6%
- 2008→2024 swing
- -6.1pp toward R · 2008: 25.4pp · 2024: 19.3pp
- All cycles
- 2024: D+19.3 2020: D+22.0 2016: D+16.6 2012: D+19.0 2008: D+25.4
Not yet ingested
- Civics
- —
Market trends
- HPI YoY
- ▼ -7.88%
- Current HPI
- 289.2468
- Rent YoY
- ▲ 0.94%
- Metro
- Kansas City, MO-KS
- State GDP YoY
- ▲ 1.84%
- F500 in state
- 20
Industry mix (Fortune 500 HQ in MO)
| Industry | F500 HQs | Revenue |
|---|---|---|
| Healthcare | 1 | $163B |
|
||
| Insurance | 1 | $21B |
|
||
| Industrial Technology | 1 | $17B |
|
||
| Retail | 1 | $16B |
|
||
| Industrial Distribution | 1 | $10B |
|
||
| Utilities | 1 | $9B |
|
||
Price history
+65.0% since first listed20 events — show timeline
- 2026-06-12 Coming Soon $99,000 Heartland MLS as Distributed by MLS Grid
- 2026-01-29 Listing Removed — Heartland MLS as Distributed by MLS Grid
- 2025-12-05 Price Changed $102,000 Heartland MLS as Distributed by MLS Grid
- 2025-11-07 Price Changed $106,000 Heartland MLS as Distributed by MLS Grid
- 2025-10-21 Price Changed $110,000 Heartland MLS as Distributed by MLS Grid
- 2025-09-27 Listed $115,000 Heartland MLS as Distributed by MLS Grid
- 2024-11-12 Sold (Public Records) — Public Records
- 2024-11-08 Sold (MLS) — Heartland MLS as Distributed by MLS Grid
- 2024-09-11 Pending — Heartland MLS as Distributed by MLS Grid
- 2024-08-12 Price Changed $95,000 Heartland MLS as Distributed by MLS Grid
- 2024-07-23 Price Changed $109,995 Heartland MLS as Distributed by MLS Grid
- 2024-07-09 Listed $120,000 Heartland MLS as Distributed by MLS Grid
- 2022-10-10 Sold (Public Records) — Public Records
- 2022-10-06 Sold (MLS) — Heartland MLS as Distributed by MLS Grid
- 2022-08-19 Contingent — Heartland MLS as Distributed by MLS Grid
- 2022-08-12 Price Changed $50,000 Heartland MLS as Distributed by MLS Grid
- 2022-07-07 Listed $60,000 Heartland MLS as Distributed by MLS Grid
- 2019-07-29 Sold (Public Records) — Public Records
- 2017-11-09 Sold (Public Records) — Public Records
- 1992-01-21 Sold (Public Records) — Public Records
Property tax history
+4.5%/yrLatest (2025): $443 · -23.5% YoY. Source: county tax records.
Cash-flow waterfall
monthlySold comps — $/sqft
last 12 mo · ≤1 miLoading sold comps…