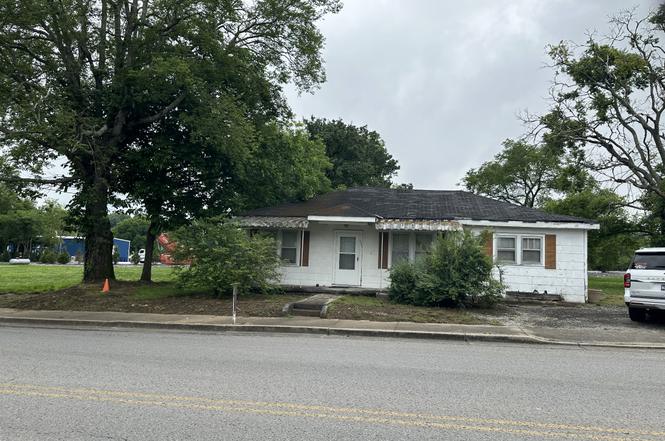
111 Bethany Ln · Shelbyville, TN
Flood risk 1/10 · Minimal
- FEMA flood zone
- X (unshaded)
- Chance of flooding over 30 yrs
- 0.0%
- Est. flood insurance / yr
- $507 – $1,088
Fire risk 1/10 · Minimal
- Est. fire insurance / yr
- $949 – $1,763
Heat risk 5/10 · Moderate
- Hot days now (above 105°F)
- 7 days/yr
- Hot days in 30 yrs
- 20 days/yr
Wind risk 4/10 · Minor
- Chance of severe wind over 30 yrs
- 11.0%
Air-quality risk 2/10 · Minimal
- Unhealthy air days now
- 1 days/yr
- Unhealthy air days in 30 yrs
- 2 days/yr
Risk factors via First Street. Map © Google.
Why this score? — see what drove the C+ grade
The composite is a weighted blend of 9 inputs, each scored 0–100. Each bar is that input's sub-score; the figure is the points it added to the 100-point composite (weight × sub-score).
- Cash flow +25.2/30.0
- ARV discount +15.0/15.0
- DSCR +8.3/10.0
- 1% rule +5.4/10.0
- Livability +3.2/5.0
- Rent growth +2.5/5.0
- Condition / age +2.5/5.0
- Schools +2.0/10.0
- Appreciation +0.0/10.0
$150,000
🖨 Deal sheet (PDF) 📄 Offer letter ✓ Due diligence
Listing remarks
Selling 111 and 113 Bethany Ln together as one unit. Tax IDs 089F F 023.01 & 089F F 023.02. No splitting. Conventional or Cash. The house is in disrepair, selling as is. Craig & Wheeler to hold earnest.
Key facts
- 6,969 sq ft lot
- Built 1950
Neighborhood map
What this means for you Summary
Snapshot
- This is a 3-bed/1.0-bath single-family listed at $150k.
Deal economics
- At list price, monthly cash flow is $336 ($4k/yr) — positive.
- The deal already cash-flows at list — no discount required.
- Meets the 1% rule at list price ($2k rent vs $150k).
- Cap rate 9.0% vs local median 3.6% in Shelbyville — top-decile yield for the area; either an underpriced asset or a hidden risk that comps aren't pricing in. Stress-test before assuming the spread holds.
Location & tenants
- Location reads 64/100 on livability (#183 in TN) — a middle-class / working-renter tenant base. Strengths: cost of living A+, housing A+; Watch: health & safety C-, crime D, employment D.
- Bedford County (rural): math 24% / reading 23% proficiency, ranked #97 of 139 in TN (top 70%) — low school quality limits family demand, transient renter base, plan for 1-2y turnover.
- Zoned schools: Learning Way Elementary (math 12% / reading 12%, grade F, #786 of 952 statewide, top 84%, 675 students, 0% FRL); Harris Middle School (math 16% / reading 13%, grade F, #231 of 333 statewide, top 70%, 963 students, 0% FRL); Shelbyville Central High School (math 2% / reading 28%, grade F, #236 of 332 statewide, top 71%, 1,553 students, 0% FRL) — zoned schools average 0% FRL vs 56% district-wide (56 pts lower); this property's tenant base skews higher-income than the district average.
- Market conditions: 354 active listings in the ZIP; 3 comparable units currently listed for rent nearby; rentals lingering (median 45d on market — plan ~5-8 weeks vacancy on turnover, expect pricing pressure); 67% of comp listings sitting > 30 days — soft ceiling on asking rent; 630 units permitted in Bedford County in 2024 (6 in 5+ unit buildings).
Forward outlook
- Local home prices are declining (-3.0%/yr); year-one equity from $1k of loan paydown is wiped out by about $4k of value loss. Plan a longer hold.
- Bedford County population projected at +16% by 2050 — long-run rental-demand tailwind backs the buy-and-hold thesis.
Negotiation context
- Only 0 days on market — expect competitive offers; lowballing is unlikely to land.
- Current owner paid $24k; list at $150k implies a 538% gain — meaningful room to come down on a strong offer.
Risks & watch-outs
- Watch-outs: built in 1950 — expect roof / HVAC / electrical / plumbing capex.
- Climate carrying-cost: extreme-heat days projected 7→20/yr by 2055 (HVAC capex compounding) — expect insurance premiums to compound above CPI over the hold.
Questions for the listing agent
- Built in 1950 — when were the roof, HVAC, electrical panel, plumbing, and water heater last replaced?
- Is there a deadline driving the sale (1031 exchange, divorce, estate, relocation)? That informs how much negotiation room exists.
- Schools are F-rated, which usually means shorter tenancies and higher turnover. Who's the typical renter profile here, and what's been the actual vacancy rate?
- Crime grade is D in this area — have there been break-ins, vandalism, or insurance claims at this property in the last 3 years? What carrier currently insures it and at what premium?
- What's the average days-on-market for RENTAL listings here right now (not sales)? A rising rental-DOM trend means longer vacancies and softer asking-rent achievability than the comps imply.
- What's the recent tenant-quality profile in this submarket — average credit score on applications, eviction rate, late-payment / NSF rate, and stable-employment percentage? A property-management company in the area should have these aggregated.
- How much new for-sale + rental construction is in the pipeline within 1–3 miles? Heavy new supply typically softens prices + rents 12–24 months out; constrained supply supports both.
Investment metrics
- 1% rule
- 1.04% ✓
- Cap rate
- 8.98%
- Cash-on-cash
- 9.60%
- DSCR
- 1.43
- GRM
- 8.0
CMA / ARV
- ARV (on-the-fly)
- $239,148
- Comps found
- 10
Show comp detail 10 sales within ~0.75 mi
| Address | Dist | Beds/Ba | Sqft | Sold | Price | $/sf | Match |
|---|---|---|---|---|---|---|---|
| 114 Nutmeg Dr | 0.33mi | 3/2.0 | 1,066 (-2%) | 14mo | $242,000 | $227 | 65 |
| 112 Elizabeth St | 0.40mi | 2/1.0 (-1) | 1,033 (-5%) | 7mo | $199,700 | $193 | 62 |
| 425 Fairground Hts | 0.26mi | 3/2.0 | 1,200 (+10%) | 10mo | $263,000 | $219 | 59 |
| 417 Fairground Hts | 0.30mi | 2/1.0 (-1) | 1,116 (+2%) | 22mo | $209,000 | $187 | 59 |
| 202 Maplewood Dr | 0.38mi | 2/1.0 (-1) | 1,008 (-8%) | 10mo | $225,000 | $223 | 56 |
| 215 Coney Island Rd | 0.38mi | 3/2.0 | 1,042 (-5%) | 18mo | $279,000 | $268 | 56 |
| 207 Martha St | 0.41mi | 3/2.0 | 1,200 (+10%) | 7mo | $230,000 | $192 | 55 |
| 103 Coney Island Rd | 0.46mi | 3/1.0 | 1,000 (-8%) | 14mo | $230,000 | $230 | 53 |
| 113 S Thompson St | 0.65mi | 3/1.5 | 1,040 (-5%) | 10mo | $150,000 | $144 | 52 |
| 900 Landers St | 0.71mi | 2/1.5 (-1) | 1,050 (-4%) | 12mo | $229,900 | $219 | 44 |
Match score weights: distance 35% · size 25% · config 20% · recency 20%. Top-matched comps best support the ARV.
Projected returns pro-forma
-3.0% appreciation · 3.0% rent growth · sell at horizon
- IRR
- -1.9%
- Equity multiple
- 0.93×
- Total profit
- $-2,970
- Equity at exit
- $22,365
- IRR
- 7.8%
- Equity multiple
- 1.59×
- Total profit
- $24,719
- Equity at exit
- $12,969
Cash invested: $42,000 (down + closing). Projections, not guarantees.
Landlord ↔ Tenant lean methodology
- Overall (STATE)
- 87 Strongly Landlord-Friendly
- State Tennessee
- 87 Strongly Landlord-Friendly · R+13
- County
- — inherits STATE
- City
- — inherits STATE
ZIP-level market 37160
- Home prices YoY
- -23.1%
- Active inventory
- 354
- Price-to-rent
- 8.0×
Monthly cashflow live
- Estimated rent
- $1,563 medium interval (Pro) →
- Mortgage (P&I)
- −$787
- Tax from tax record
- −$50 /mo · $597/yr
- Insurance
- −$62
- HOA
- −$0
- Vacancy / Maint / Mgmt
- −$328
- Net cashflow
- $336
Break-even live
Sensitivity live
| Price | -10% $421 | -5% $378 | +0% $336 | +5% $294 | +10% $251 |
|---|---|---|---|---|---|
| Rent | -10% $212 | -5% $274 | +0% $336 | +5% $398 | +10% $459 |
| Rate | -1.0pp $412 | -0.5pp $374 | base $336 | +0.5pp $297 | +1.0pp $258 |
UW: 25.0% down · 7.5% · 30yr · 1.5% tax · 5.0% vac · 8.0% maint · 8.0% mgmt
Financing live
Cash to close
- Down payment
- $37,500
- Closing costs
- $4,500
- Reserves months
- —
- Total cash needed
- —
Loan-product check · same deal, 3 products live
Conventional
25% down · 7.5% · 30yr
- Down + closing
- —
- Monthly P&I
- —
- Monthly cashflow
- —
- DSCR
- —
- Eligible?
- —
Personal DTI + credit; lowest rate.
DSCR
20% down · 8.5% · 30yr
- Down + closing
- —
- Monthly P&I
- —
- Monthly cashflow
- —
- DSCR
- —
- Eligible?
- —
No personal income docs; deal must DSCR.
Hard money
10% down · 12.0% · 12mo
- Down + closing
- —
- Monthly P&I
- —
- Monthly cashflow
- —
- DSCR
- —
- Eligible?
- —
Short-term bridge; refi at stabilization.
Rent comps 3 comps
| Address | Beds | Baths | Sqft | Rent | $/sqft | DOM | Units | Dist |
|---|---|---|---|---|---|---|---|---|
| 228 Coney Island Rd Shelbyville, TN | 3.0 | 2.0 | 1046 | $1,525 | $1.46 | 45d | 1 | 0.30mi |
| 125 Sunlite Rd Shelbyville, TN | 2.0–3.0 | 2.0 | 1147 | $1,130 | $0.99 | 25d | 1 | 0.69mi |
| 107 Pickle St Unit C Shelbyville, TN | 2.0 | 1.0 | 1025 | $1,225 | $1.20 | 45d | 1 | 1.43mi |
Listing history 2 events
-
2026-06-13remarks 206-char remark
-
2026-06-13$150,000 Pending
ⓘ Source: listings_history table (triggers on properties + properties_extension) + one-shot
backfill from property_details.listing_events for pre-trigger history.
Tax reassessment forecast TN · Resets to sale price
- Current annual tax
- $597 · $50/mo
- Projected year-2 tax
- $1,065 · $89/mo
- Expected delta
- +$468/yr (+$39/mo · 78.4%)
ⓘ Screening estimate from a state-policy table — verify with the county assessor before closing.
Climate risk First Street
- Flood 1/10 Low FEMA zone X (unshaded) · 0% chance over 30 yrs
- Wildfire 1/10 Low
- Heat 5/10 Major 7 d/yr ≥105°F today · 20 d/yr by 30 yrs out
- Wind 4/10 Moderate 11% chance of damaging wind over 30 yrs
- Air quality 2/10 Low 1 unhealthy d/yr today · 2 by 30 yrs out
Nearby sold comps map
Loading sold comps map…
Walkable amenities ~0.75 mi
Loading nearby amenities…
Taxation est. · year 1
- Rental income
- $18,757
- − Mortgage interest
- −$8,402
- − Property taxes
- −$597
- − Insurance
- −$750
- − Repairs & maintenance
- −$1,501
- − Management
- −$1,501
- − Depreciation
- −$4,364
- Taxable income
- $1,643
- Est. tax owed @ 24.0%
- −$394
- After-tax cash flow
- $3,637/yr
For passive investors: Depreciation is non-cash, so a rental often shows a tax loss while cash-flowing — sheltering income. Rental losses are passive: they offset passive income freely, and up to $25,000/yr can offset ordinary (W-2) income if you actively participate and your MAGI is under $100k (phasing out to $0 by $150k); unused losses carry forward. On sale, claimed depreciation is recaptured at up to 25%, and gains may owe capital-gains tax (a 1031 exchange can defer both). Figures are a year-1 estimate at your 24.0% rate — not tax advice; consult a CPA.
Schools (NCES district)
- District
- Bedford County
- NCES district ID
- 4700180
- Math proficiency
- 24% ▼ -4.00%
- Reading proficiency
- 23% ▼ -3.00%
- Median HH income
- $41,704
- Composite
- 20.03/100
- National rank
- #8658
- State rank
- #97 of 139 in TN
Livability — Shelbyville
- Score
- 64/100
- State rank
- #183
- US rank
- #14818
Category grades
Schools grade is shown separately in the Schools card above.
Census & demographics
- Census place
- Shelbyville, TN
- County
- Bedford County · 38,148 people
- City population
- 38,148
- Metro
- Shelbyville, TN
- Population (ZIP)
- 38,148
- Household income
- $64,800
- Rent vs Own
- Severe rent burden
- 1093.0
Population outlook (Bedford County) Hauer SSP2
- Today (2025)
- 51,064 people
- By 2030
- 52,954 · +3.7%
- By 2040
- 56,534 · +10.7%
- By 2050
- 59,482 · +16.5%
- By 2075
- 65,597 · +28.5%
- By 2100
- 68,030 · +33.2%
Race, ethnicity, and origin ACS 2023
- Neighborhood character
- Predominantly White (66%)
- Race & ethnicity
- White 66% Hispanic / Latino 21% Two or more races 11% Black 8% Native American 2%
- Hispanic origin (detail)
- Mexican 15%
- Common ancestry
- Serbian 1% Lithuanian 1% Slovak 1%
- Foreign-born
- 9% · Canada
- Languages at home
- 84% English-only · Spanish 15% Arabic 1%
Political lean MEDSL · Bedford
- 2024 margin
- Solid R (+58.0) · D 20.5% · R 78.5%
- 2008→2024 swing
- -24.5pp toward R · 2008: -33.5pp · 2024: -58.0pp
- All cycles
- 2024: R+58.0 2020: R+51.9 2016: R+52.8 2012: R+40.3 2008: R+33.5
Not yet ingested
- Civics
- —
Market trends
- HPI YoY
- ▼ -99.18%
- Current HPI
- 330.802
- Rent YoY
- —
- Metro
- Shelbyville, TN
- State GDP YoY
- ▲ 2.78%
- F500 in state
- 22
Industry mix (Fortune 500 HQ in TN)
| Industry | F500 HQs | Revenue |
|---|---|---|
| Healthcare | 3 | $91B |
|
||
| Retail | 3 | $72B |
|
||
| Transportation / Logistics | 1 | $88B |
|
||
| Paper / Packaging | 1 | $19B |
|
||
| Insurance | 1 | $13B |
|
||
| Energy | 1 | $12B |
|
||
Price history
+538.3% since first listed3 events — show timeline
- 2026-06-11 Listed $150,000 REALTRACS as Distributed by MLS Grid
- 2026-06-11 Listing Removed — REALTRACS as Distributed by MLS Grid
- 2003-11-03 Sold (Public Records) $23,500 Public Records
Property tax history
+7.2%/yrLatest (2025): $597 · +0.0% YoY. Source: county tax records.
Cash-flow waterfall
monthlySold comps — $/sqft
last 12 mo · ≤1 miLoading sold comps…